MEMBERS ONLY
Economic Modern Family Has Eyes on Granny Retail
In the world of large cap and tech stocks, Friday was an interesting trading day.
Lots of those stocks touched down on their 50-DMA. To name a few: JD.com (JD), Baidu (BIDU), IQ, Netflix (NFLX) and Microsoft (MSFT). With sentiment or risk on/off gauges flashing bearish, these...
READ MORE
MEMBERS ONLY
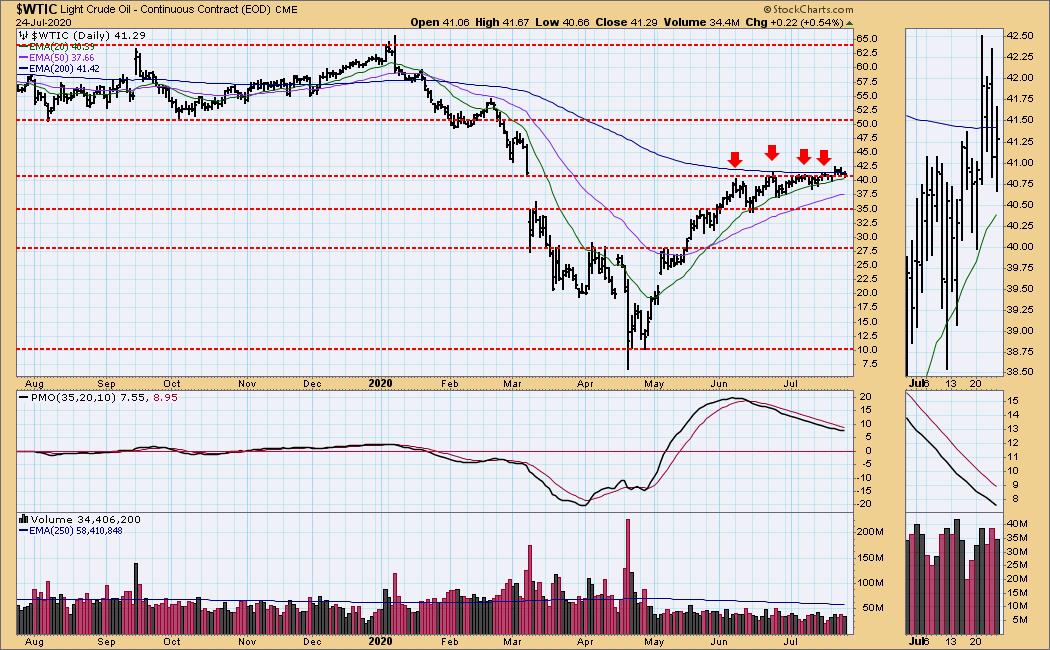
Energy Sector Heating Up - Here are Possible Winners

by Erin Swenlin,
Vice President, DecisionPoint.com
I have been watching the Energy sector closely this week. $WTIC, which I follow daily in the DecisionPoint Alert report, finally broke out and, although the Price Momentum Oscillator (PMO) hasn't turned up, Oil prices are staying above the 20-EMA and have made an attempt to get...
READ MORE
MEMBERS ONLY

QQQ Goes on a Bender

by Arthur Hill,
Chief Technical Strategist, TrendInvestorPro.com
QQQ can do little wrong here in 2020, but the ETF is ripe for a corrective period as it becomes the most extended since 1999. Current conditions, while frothy, are not quite the same as they were in 2000 so I do not expect another crash. For those of us...
READ MORE
MEMBERS ONLY

The Secret to Outperformance: Personal Teflon and Velcro - ChartPack Update #28 (Q2 / 2020)

by Grayson Roze,
Chief Strategist, StockCharts.com

by Gatis Roze,
Author, "Tensile Trading"
What is the singular attribute absolutely ALL successful investors you can name possess? It's resiliency! Consistency, profitability and longevity demand that an investor maintain an even keel through many challenging market cycles. The essential tool they all use are their "Routines". The end result: resiliency.
Routines...
READ MORE
MEMBERS ONLY
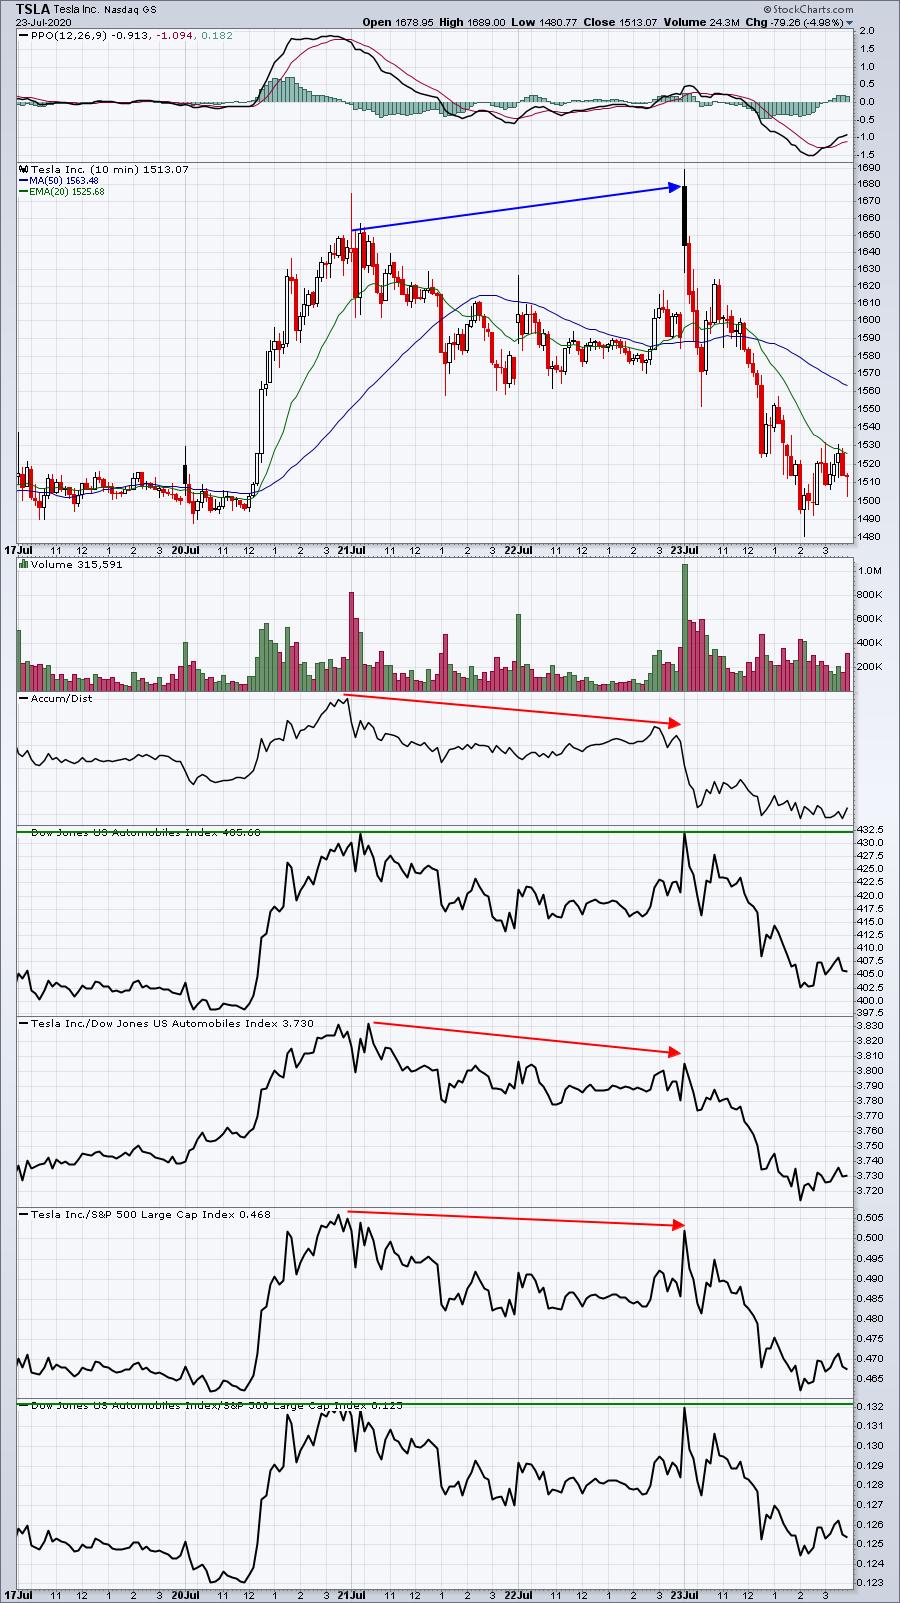
TSLA Has Likely Topped, But How Far Could It Fall?

by Tom Bowley,
Chief Market Strategist, EarningsBeats.com
There's been one common denominator thus far in earnings season: high-flying stocks have seemed to hit a brick wall after posting earnings - even spectacular, way-above-consensus-estimates earnings. That was my biggest question as we headed into earnings season. I knew the numbers would be incredible...
READ MORE
MEMBERS ONLY

BIG TECHS LEAD MARKET RETREAT -- NASDAQ 100 IS BIGGEST LOSER AND LOOKS VULNERABLE TO DEEPER PULLBACK

by John Murphy,
Chief Technical Analyst, StockCharts.com
NASDAQ 100 TESTS 20-DAY LINE... A selloff in the biggest tech stocks is putting downside pressure on stocks today; and is helping make the Nasdaq 100 the day's biggest percentage loser. And it looks technically vulnerable to a deeper pullback. The daily bars in Chart 1 show...
READ MORE
MEMBERS ONLY
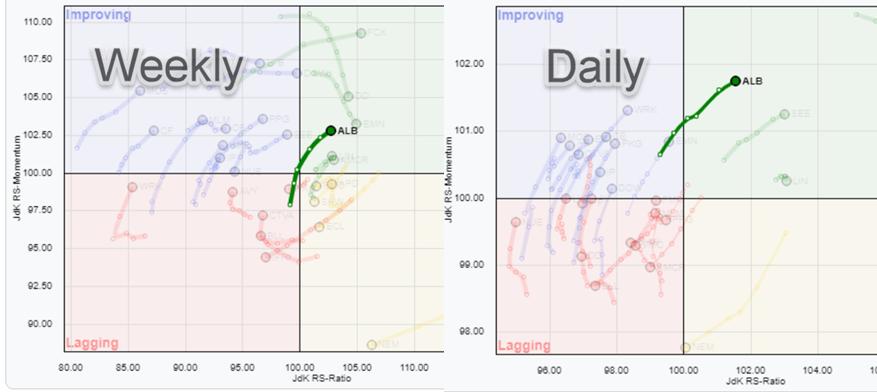
Here's a Materials Stock With Potential

by Julius de Kempenaer,
Senior Technical Analyst, StockCharts.com
With the Materials sector (XLB) moving into the leading quadrant on the weekly RRG, it makes sense to look for some individual stocks that may offer upside potential. Using Relative Rotation Graphs, we can do just that by loading all members of the Materials sector and using XLBas the benchmark...
READ MORE
MEMBERS ONLY
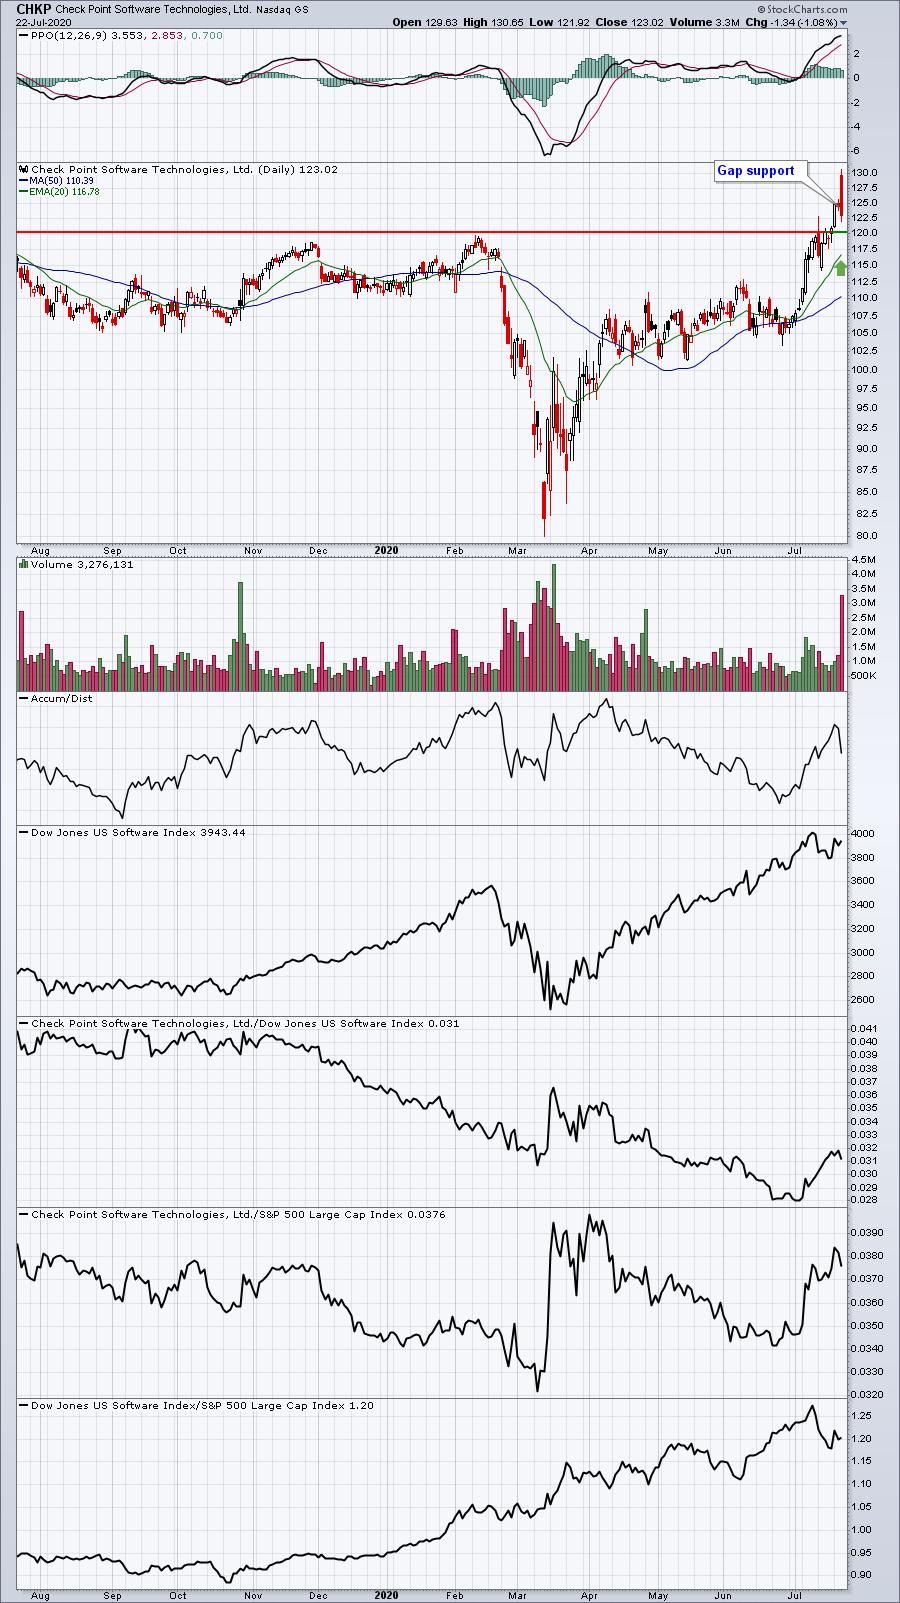
To Buy Or Not To Buy?? That Is The Gap Question
by Tom Bowley,
Chief Market Strategist, EarningsBeats.com
Trading earnings-related gaps is what I like to do. It's what we do at EarningsBeats.com. Well, we do lots of things at EarningsBeats.com, but doing our homework and preparing our members to trade earnings-related gaps is certainly high on our list. It always amazes...
READ MORE
MEMBERS ONLY

Bullish Market Bias - Can't Beat 'Em, Join 'Em
by Erin Swenlin,
Vice President, DecisionPoint.com

by Carl Swenlin,
President and Founder, DecisionPoint.com
In this episode of DecisionPoint, Carl and Erin discuss negative divergences and BUY signal divergences that are being defeated by a strong bullish bias in the market. Carl looks at breadth anomalies. Apple (AAPL)'s parabolic (or should we say "vertical") price movement should give Apple investors...
READ MORE
MEMBERS ONLY
Follow the Path to Money
As my loyal readers and followers know, I have been bullish on gold and silver since 2018.
Oh sure, we have had some ups and downs, but since the March low, every dip has been a buy opportunity. But my bullish stance in the metals was not always met with...
READ MORE
MEMBERS ONLY

ACP Indicators Unleashed (and More)

by Dave Landry,
Founder, Sentive Trading, LLC
In this edition of Trading Simplified, Dave explores his new "Stick with the Trend" indicators, which have now been released on the StockCharts.com Advanced Charting Platform (StockChartsACP). This is a new FREE plugin you can easily install on ACP, and Dave shows how to make the best...
READ MORE
MEMBERS ONLY

EURO CLIMBS TO TWO -YEAR HIGH -- THAT'S GOOD FOR EUROZONE ETFS -- GERMAN ISHARES NEAR BULLISH BREAKOUT -- WEAK DOLLAR BOOSTS EMERGING MARKETS
by John Murphy,
Chief Technical Analyst, StockCharts.com
EURO RALLIES TO TWO-YEAR HIGH... Yesterday's message showed the euro testing its March high. Chart 2 shows the eurozone currency trading above that level in today's trading. That puts the euro at the highest level in nearly two years. The rising euro is putting more...
READ MORE
MEMBERS ONLY

Sector Spotlight: Short-Term Sector Rotation Out of Technology
by Julius de Kempenaer,
Senior Technical Analyst, StockCharts.com
On this episode of Sector Spotlight, after a quick overview of Asset Class and Sector rotation, I go over and update my longer-term views using the investment pyramid. In the second half of the show, I give a thorough update of the Long/Short baskets while putting these picks...
READ MORE
MEMBERS ONLY
Small-Cap Stocks Escape Late Day Fade - Here's a Name on the Move!

by Mary Ellen McGonagle,
President, MEM Investment Research
Small Cap stocks were the best performers last week and it's of great interest to me to see them continue outperforming this week. A quick look at the Russell 2000 Small Cap Index will show that last week's bullish break above its 200-day moving average...
READ MORE
MEMBERS ONLY

AAPL Advance Is Too Steep
by Carl Swenlin,
President and Founder, DecisionPoint.com
Apple (AAPL) has a history of sharp, parabolic price advances, followed by vertical collapses. Normal spacing between the tops runs from about two to four years, but recent periodicity has become compressed. The top in early 2020 arrived only about 15 months after the 2018 top, and it appears to...
READ MORE
MEMBERS ONLY

Where Do You Invest if the Trend Favoring the US Against the World Reverses?

by Martin Pring,
President, Pring Research
* The US versus the Rest of the World
* Europe
* Asia
The US versus the Rest of the World
Chart 1 shows that the up trend favoring the S&P Composite against the Vanguard All-World Ex-US ETF (the VEU) is intact. That's because the latest plot...
READ MORE
MEMBERS ONLY

RISING EURO PUSHES DOLLAR TO LOWEST LEVEL SINCE MARCH -- A WEAKER DOLLAR IS BOOSTING ENERGY AND METAL PRICES -- AND STOCKS TIED TO THEM
by John Murphy,
Chief Technical Analyst, StockCharts.com
RISING EURO PUSHES DOLLAR LOWER...Chart 1 show the Invesco Dollar Index Bullish Fund (UUP) declining today to the lowest level since March. The dollar surged during the first quarter in a flight to safety as stock prices plunged. Then fell from late March to July as stocks recovered. And...
READ MORE
MEMBERS ONLY
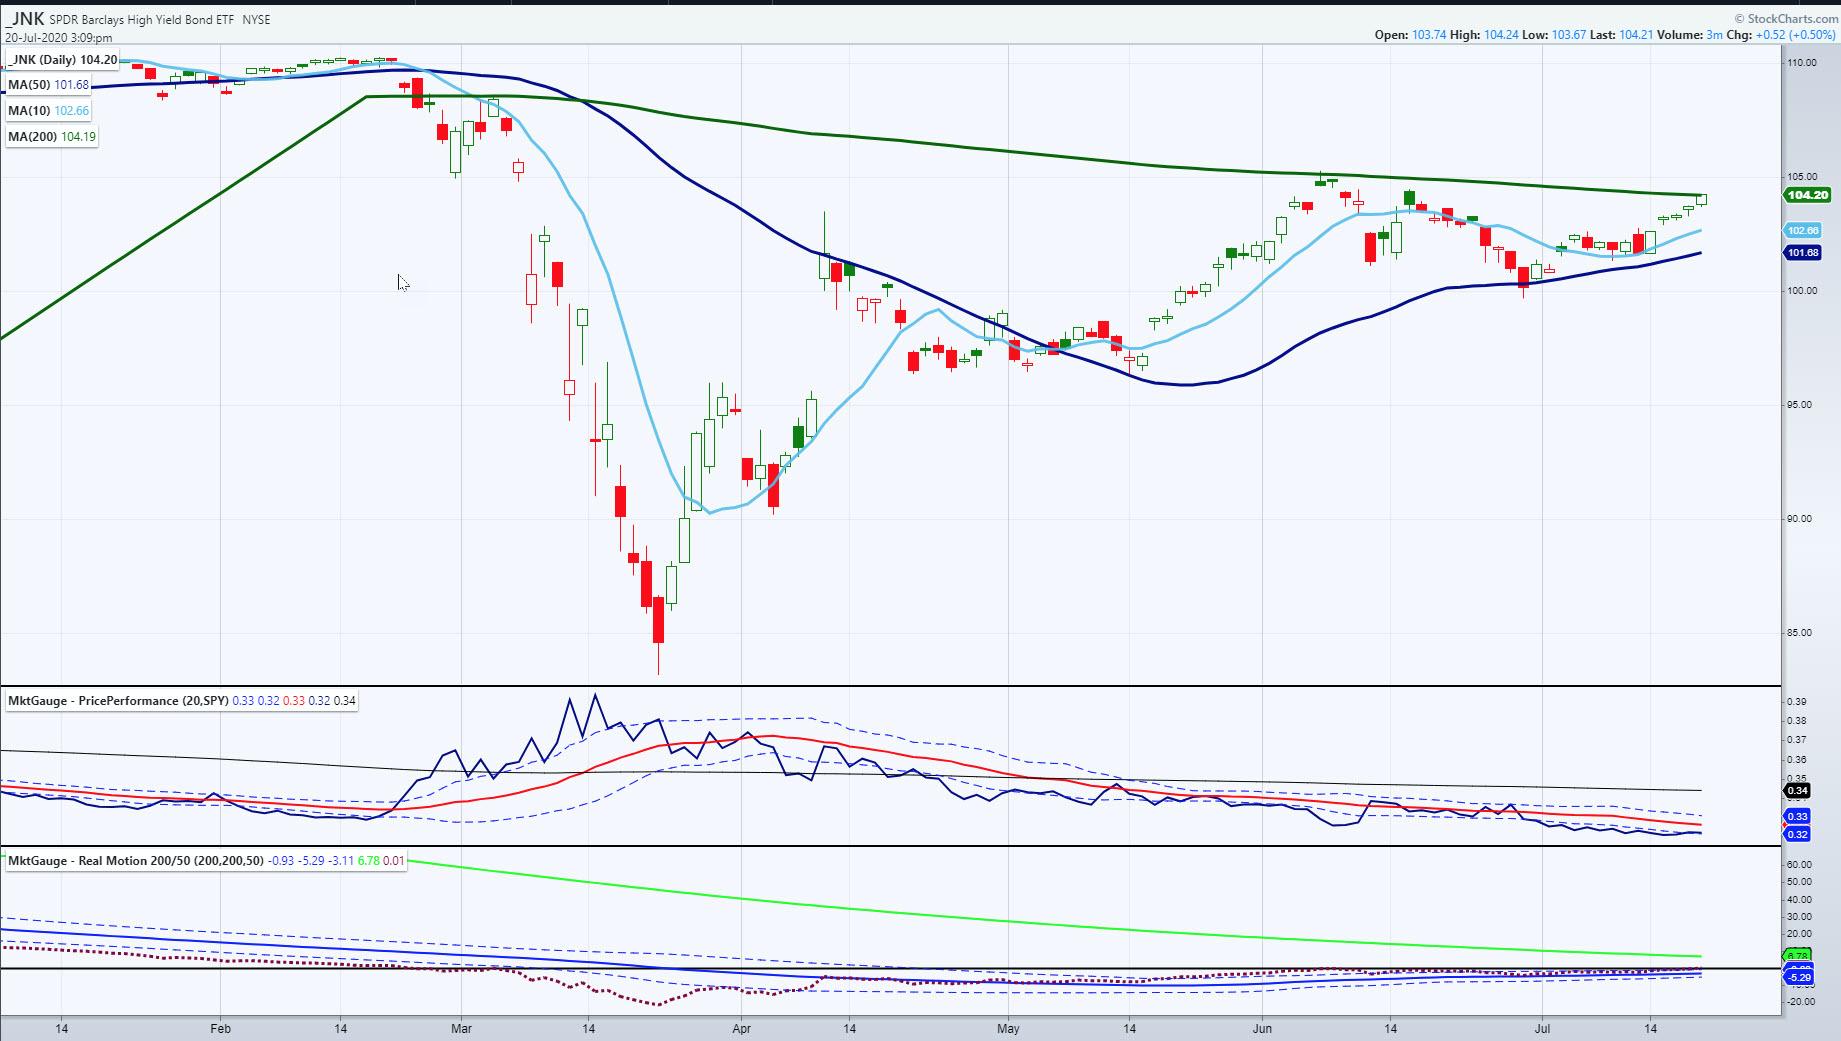
Junk Bonds - A Test of Resistance
With such divergence blaringly apparent in the market, I like to look at junk bonds.
Junk bonds help us see risk appetite. Last week, I wrote a piece on JNK when they appeared more vulnerable, skidding along the 50-daily moving average you see in blue. Then, buyers showed up...
READ MORE
MEMBERS ONLY

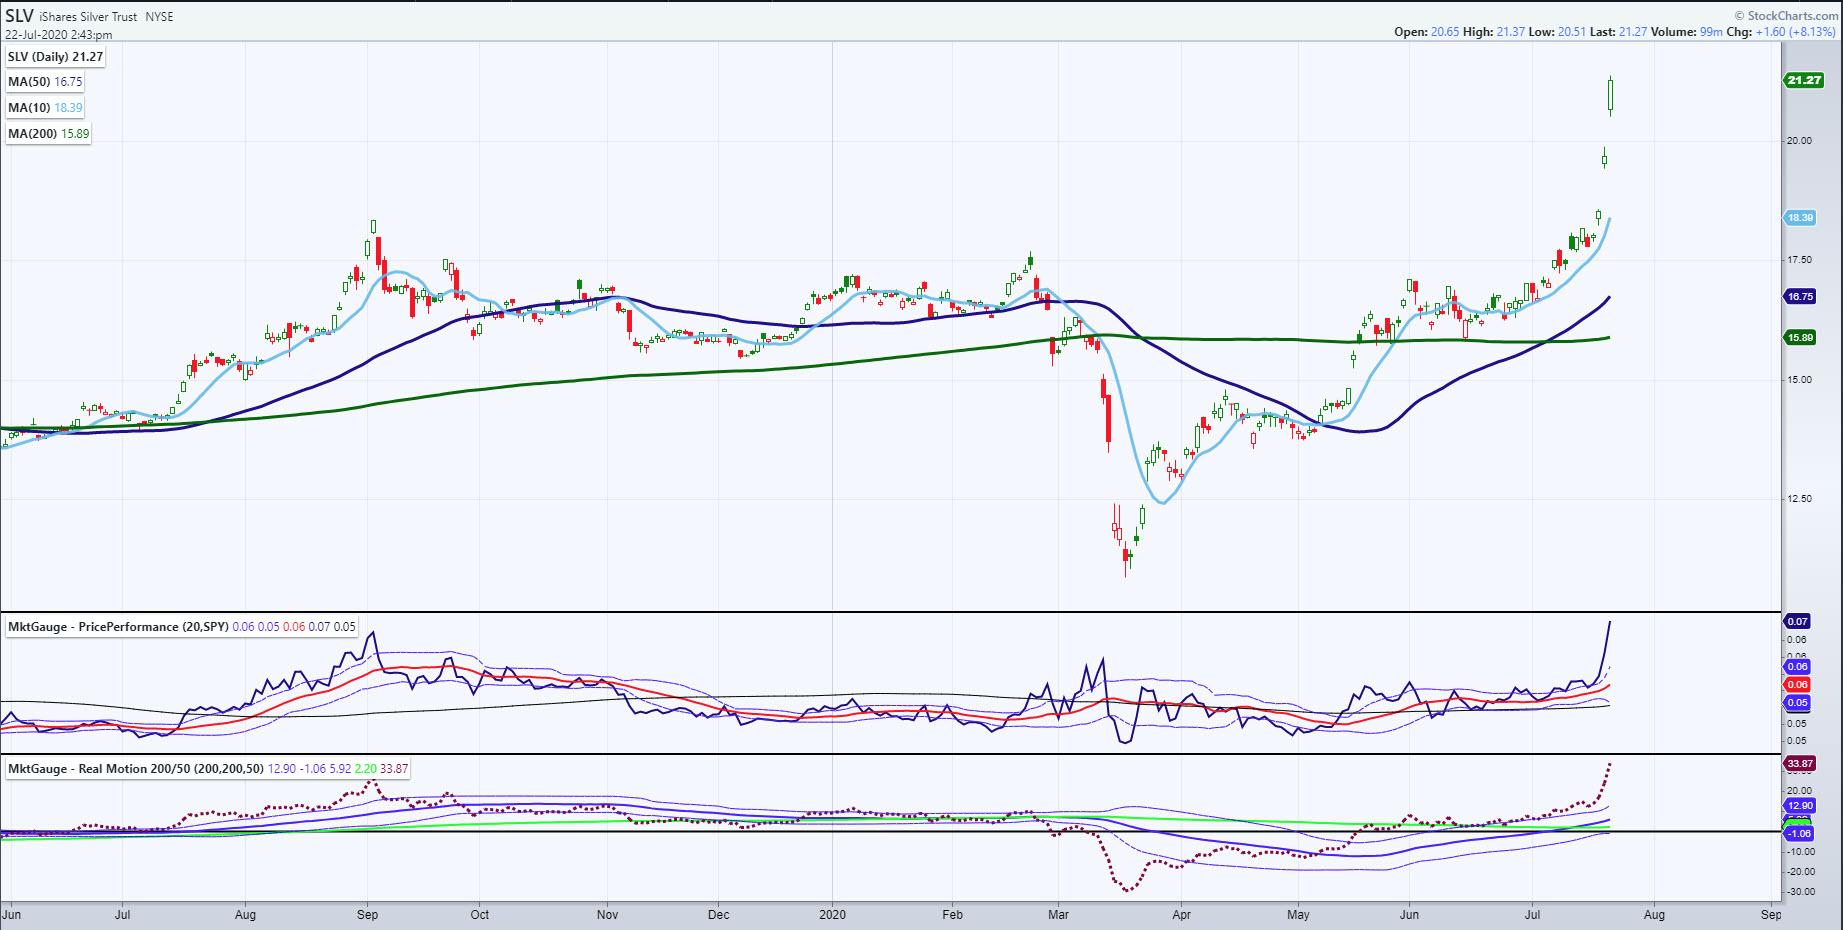
SILVER ISHARES REACH FOUR-YEAR HIGH -- SILVER CONTINUES TO OUTPACE GOLD --THE GOLD/SILVER RATIO AT ALL-TIME HIGH -- WHICH MAKES SILVER HISTORICALLY CHEAP
by John Murphy,
Chief Technical Analyst, StockCharts.com
SILVER ISHARES HIT FOUR-YEAR HIGH... Precious metals (and their mining ETFs) are rising again today with all of them hitting multi-year highs. As has been the case recently, however, silver (and its miners) are actually rising faster than gold (and its miners). The black daily bars in Chart...
READ MORE
MEMBERS ONLY
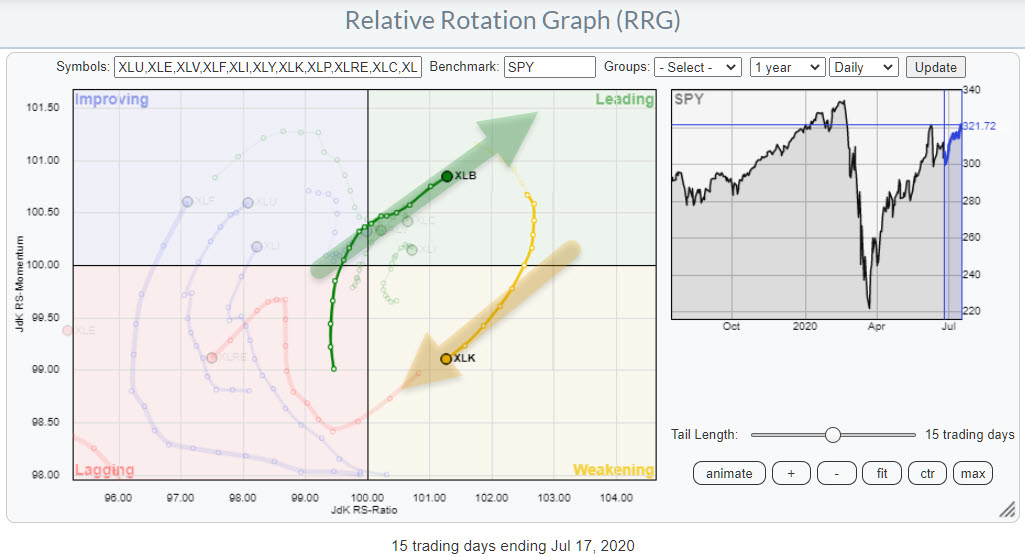
XLB Picking Up More Strength as Sector Rotates Further into Leading; XLK Loses Relative Momentum inside Weakening
by Julius de Kempenaer,
Senior Technical Analyst, StockCharts.com
On the weekly Relative Rotation Graph for US sectors, there are five sectors rotating at the right hand side of the graph, either inside the leading quadrant (XLB,XLC,XLK,XLY) or inside the weakening quadrant (XLV). On the daily RRG, it's also only these sectors at the...
READ MORE
MEMBERS ONLY

Raising Guidance Can Result In A BIG Advance
by Tom Bowley,
Chief Market Strategist, EarningsBeats.com
That seems rather plausible. After all, earnings are one key factor that drives stock prices. But, in this case, I'm referring specifically to Big Lots, Inc. (BIG). It's part of a very strong industry group, broadline retail ($DJUSRB), which set a new 52-week relative high...
READ MORE
MEMBERS ONLY
Internet Stocks Remain Strong And This One Could Explode Higher
by Tom Bowley,
Chief Market Strategist, EarningsBeats.com
We can talk about earnings, the economic outlook, technical conditions, etc., but to be quite honest, the real keys to successful investing/trading come down to timing, patience, and managing risk. At EarningsBeats.com, we do all the research for our members. We provide so many trading opportunities and literally...
READ MORE
MEMBERS ONLY
Weekend Visit with the Economic Modern Family
With Daily's recently-titled "Granny Retail Hangs Tough" and "Granddad Russell 2000 Takes the Lead", it's no wonder we saw rotation out of tech and into the matriarch and patriarch of the Economic Modern Family. However, this catch-up play is a...
READ MORE
MEMBERS ONLY
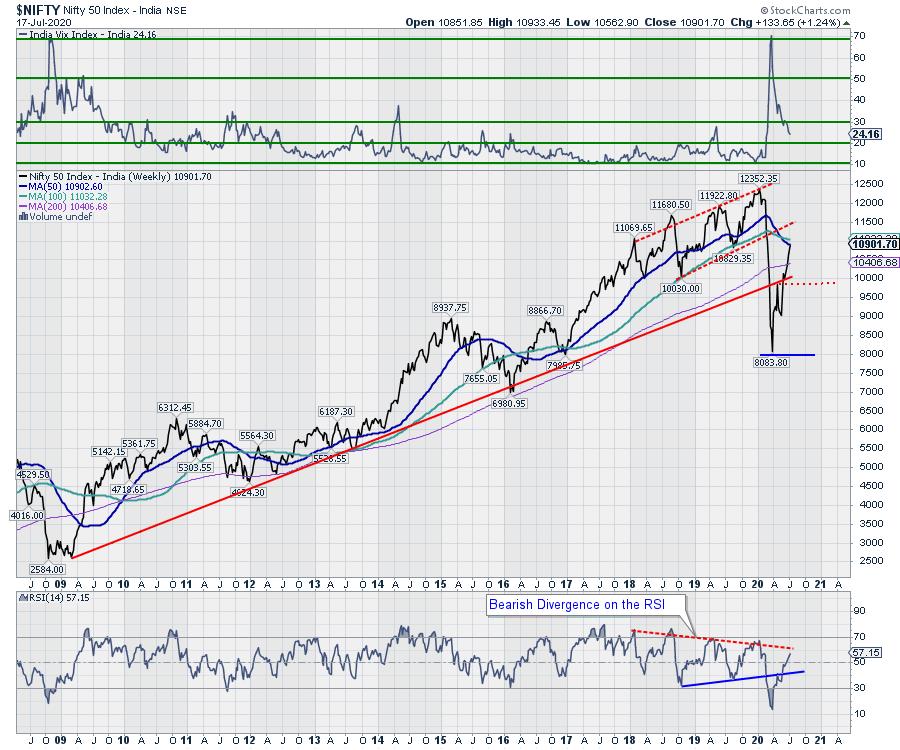
Week Ahead: NIFTY has Three Important Levels to Deal With; RRGs Clearly Show Change of Leadership

by Milan Vaishnav,
Founder and Technical Analyst, EquityResearch.asia and ChartWizard.ae
In the previous weekly note, we had mentioned that the markets were losing momentum in general despite some measured incremental up moves. The week that went by traded much on the anticipated lines. The trading range increased over the past couple of days as the NIFTY continued to witness selling...
READ MORE
MEMBERS ONLY
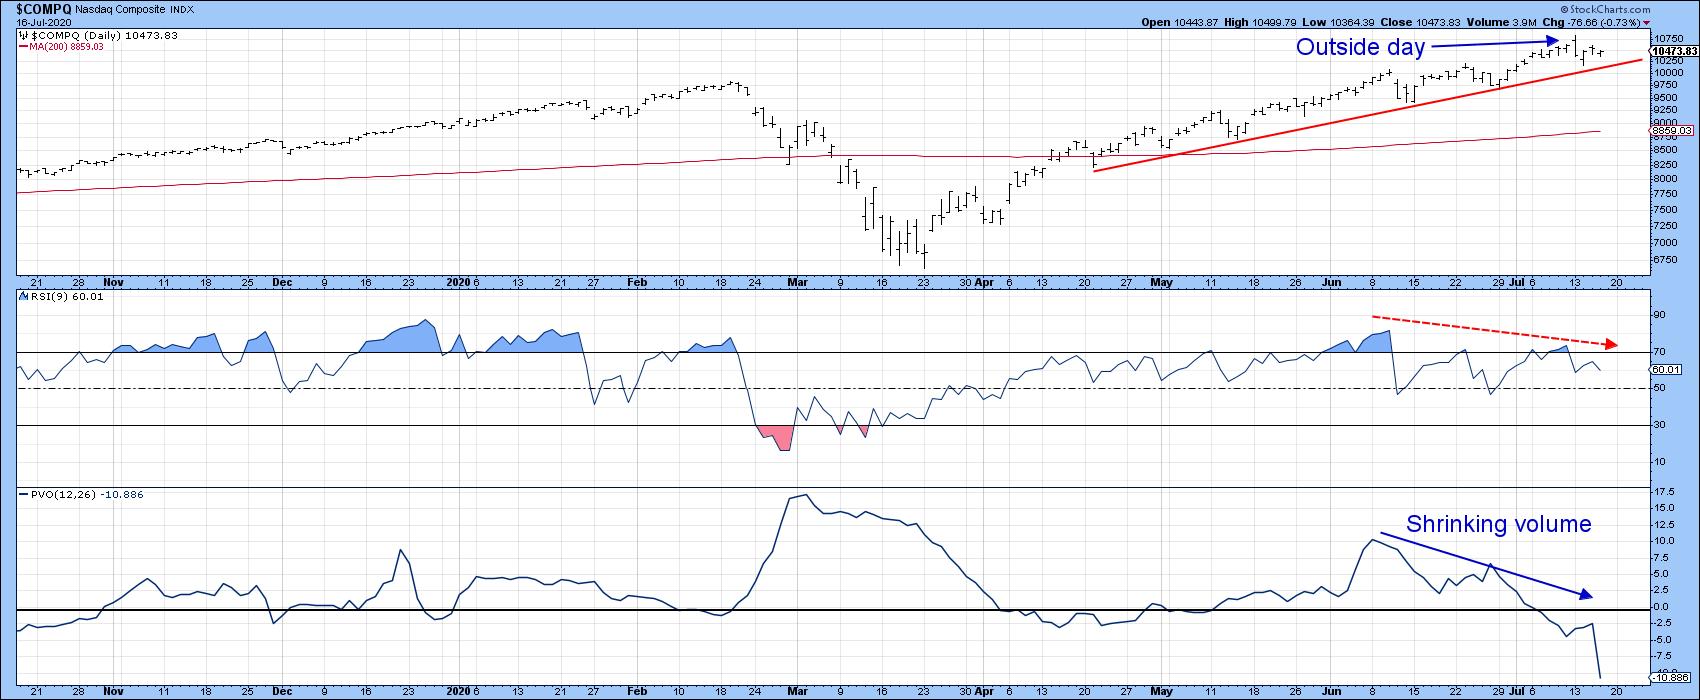
New Sector Leadership May Be Emerging
by Martin Pring,
President, Pring Research
Technology About to Pause?
The undisputed king of sectors so far this year has been technology. This week's price action from the tech dominated NASDAQ Composite ($COMPQ), though, suggests that this leadership may be rotating elsewhere. Take Chart 1, for instance; it shows that Monday's price...
READ MORE
MEMBERS ONLY
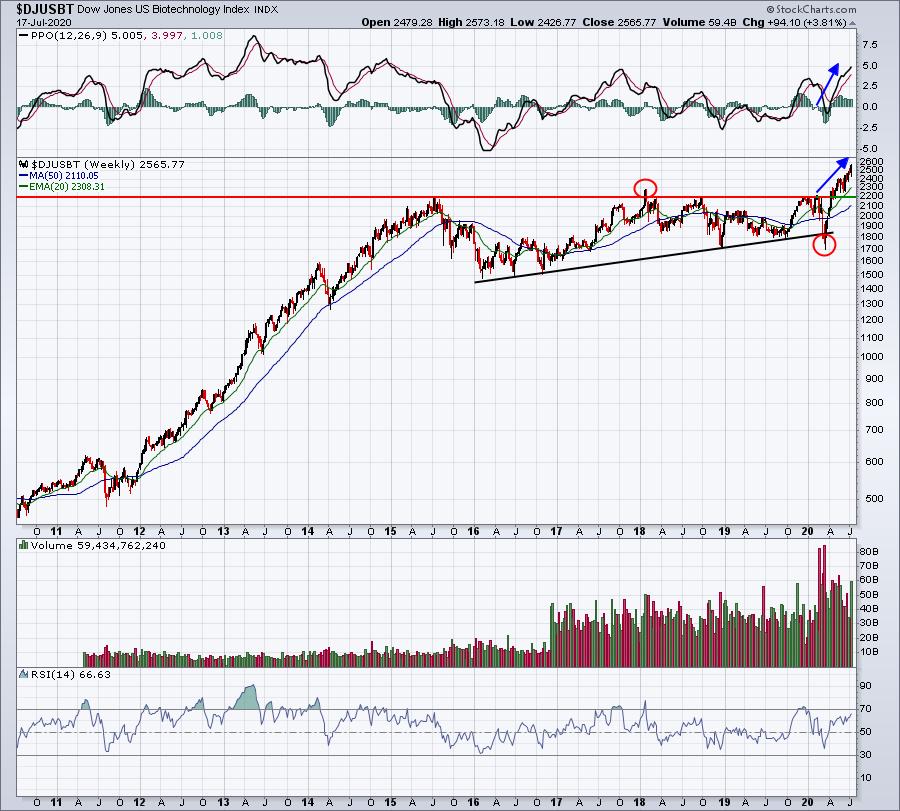
These 3 Industries are Poised to Deliver Companies with Blowout Results
by Tom Bowley,
Chief Market Strategist, EarningsBeats.com
I've been patiently waiting for the BIG breakout, the one that really kickstarts this group. I believe we just saw it on Friday. Health Care (XLV) definitively made its move after already recently providing some very bullish clues. After weeks and weeks of sideways action, in which the...
READ MORE
MEMBERS ONLY

Have Growth Stocks Topped?
by Mary Ellen McGonagle,
President, MEM Investment Research
In this episode of StockCharts TV'sThe MEM Edge, Mary Ellen takes a close look at the Nasdaq as well as individual growth stocks following last week's action. She also shares 5 small-cap stocks that look attractive, as well as a review of notable stocks that...
READ MORE
MEMBERS ONLY

A BB Breakout or the Dreaded Head Fake?
by Arthur Hill,
Chief Technical Strategist, TrendInvestorPro.com
There were a number of Bollinger Band squeeze plays over the last two weeks and also a number of breakouts. These breakouts are bullish until proven otherwise, but chartists should also be aware of the head fake. In his book, Bollinger on Bollinger Bands, John Bollinger puts it as follows:...
READ MORE
MEMBERS ONLY
The "Diamonds" of the Materials Sector
by Erin Swenlin,
Vice President, DecisionPoint.com
As part of my preparation of the "DecisionPoint Diamonds Report", I seek areas that are showing leadership, and the Materials sector has been doing just that. Materials was up 5.47% on the week, which was only second to Industrials at 5.87%. The "darling" of...
READ MORE
MEMBERS ONLY
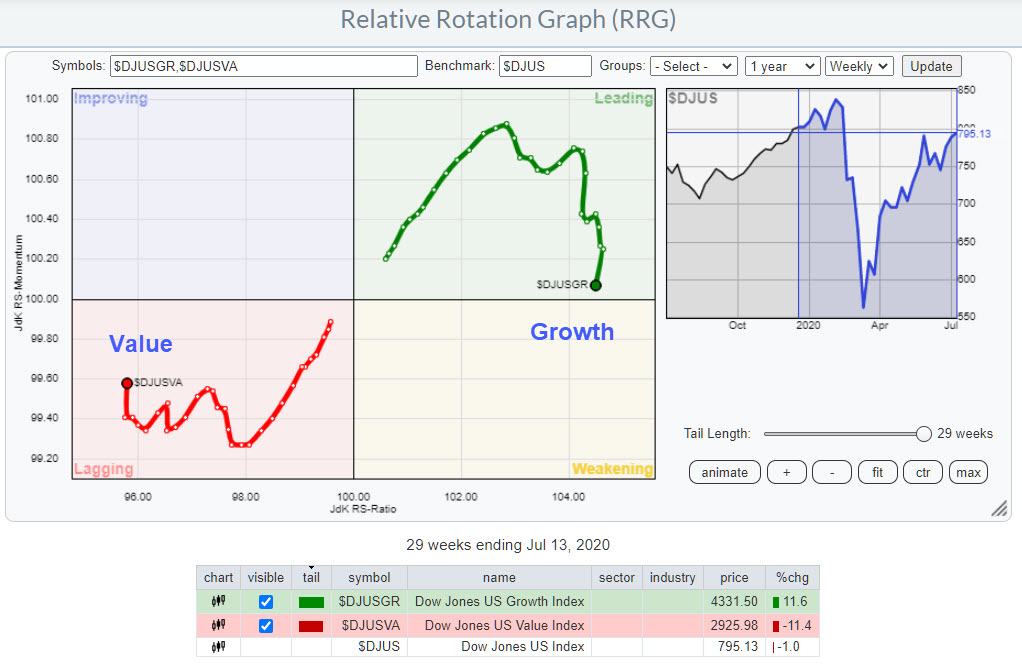
What About Growth vs. Value Going into the Second Half?
by Julius de Kempenaer,
Senior Technical Analyst, StockCharts.com
The last time Value took over from Growth was at the end of 2018, and even that was only for a short period going into and following the Christmas Crash. But that situation rapidly reversed a few weeks into 2019, when the uptrend in the Growth-Value ratio continued strongly....
READ MORE
MEMBERS ONLY
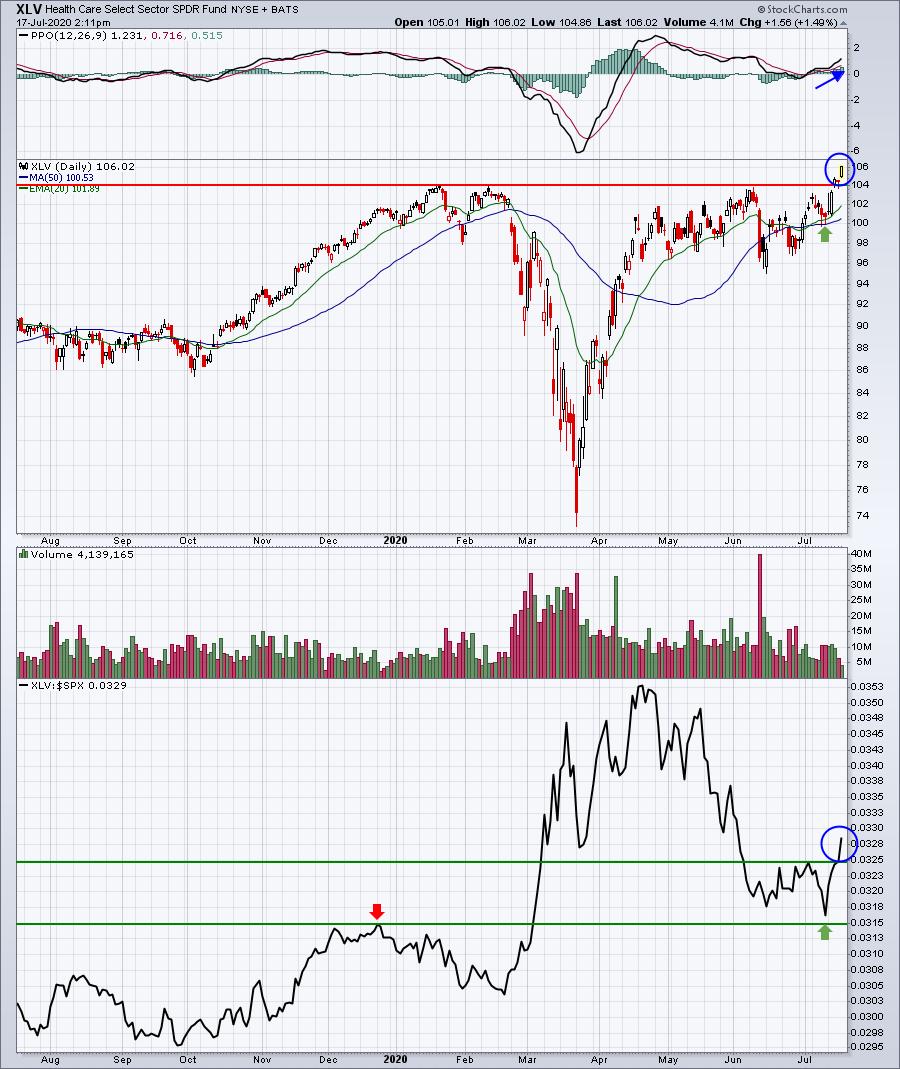
Health Care Is Starting Another Leg Higher; Here Are A Few Trading Candidates To Consider
by Tom Bowley,
Chief Market Strategist, EarningsBeats.com
Below is today's Daily Market Report (DMR) that I send to EarningsBeats.com members every day. Today's focus was definitely on health care (XLV). I've been waiting for a few months for its sideways consolidation to resolve and we're getting that now:...
READ MORE
MEMBERS ONLY

TRUCKERS LEAD TRANSPORTS HIGHER -- JB HUNT, OLD DOMINION, AND KNIGHT-SWIFT TRANSPORTATION HIT RECORD HIGHS -- C.H. ROBINSON IS TURNING UP...LANDSTAR MAY BE NEARING UPSIDE BREAKOUT
by John Murphy,
Chief Technical Analyst, StockCharts.com
RAILS AND TRUCKERS LEAD TRANSPORTS HIGHER... Wednesday's message showed the Dow Transports closing above their 200-day line for the first time since early June. Chart 1 shows them continuing to build on that upturn. Their relative strength ratio in the upper box has turned up as well,...
READ MORE
MEMBERS ONLY

A Changing of the Guard? New Sector Leadership May Be Emerging
by Martin Pring,
President, Pring Research
* Technology About to Pause?
* New Blood is Starting to Emerge
* Two Fence Sitters
Technology About to Pause?
The undisputed king of sectors so far this year has been technology. This week's price action from the tech dominated NASDAQ Composite ($COMPQ), though, suggests that this leadership may be rotating...
READ MORE
MEMBERS ONLY

Overbought Names Begin Potential Topping Process

by David Keller,
President and Chief Strategist, Sierra Alpha Research
I wrote this article for last Saturday's ChartWatchers newsletter, focusing on the overbought conditions rampant in mega cap technology and consumer names. Monday's selloff certainly changes the short-term look of most of these charts, potentially beginning the topping process I described below.
The next move...
READ MORE
MEMBERS ONLY
This Thing Has 70% Upside Potential...
by Julius de Kempenaer,
Senior Technical Analyst, StockCharts.com
I got triggered to watch the chart printed above when I was scrolling through the pre-defined RRG groups.
This is a routine I go through on a regular basis; just flip through all pre-defined RRGs and see if I note any strange or particularly strong or weak rotations....
READ MORE
MEMBERS ONLY

DP Show: New BUY Signal for the SPY!
by Erin Swenlin,
Vice President, DecisionPoint.com
by Carl Swenlin,
President and Founder, DecisionPoint.com
In this episode of DecisionPoint, Carl and Erin discuss their outlooks for the market based on new signals and divergences popping up on the charts. Erin focuses in on the Dollar, Gold and Gold Miners. Carl brings his wisdom discussing Earnings outlooks that aren't in line with price...
READ MORE
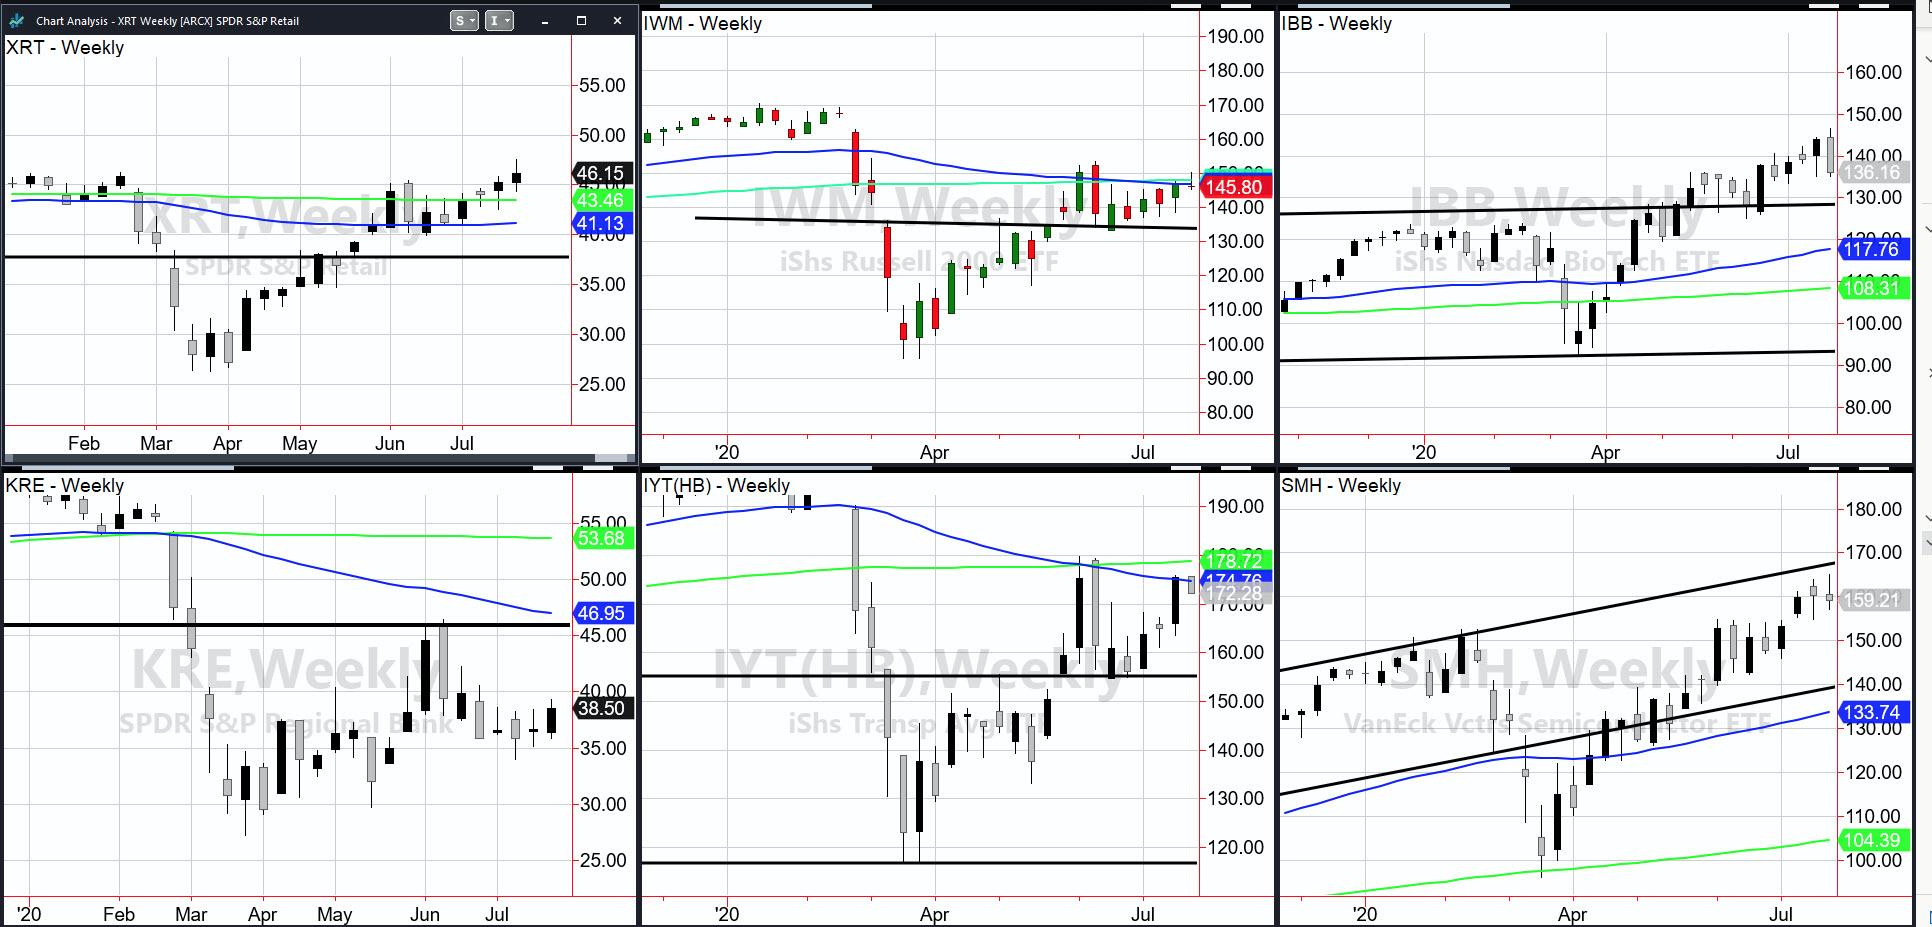
MEMBERS ONLY
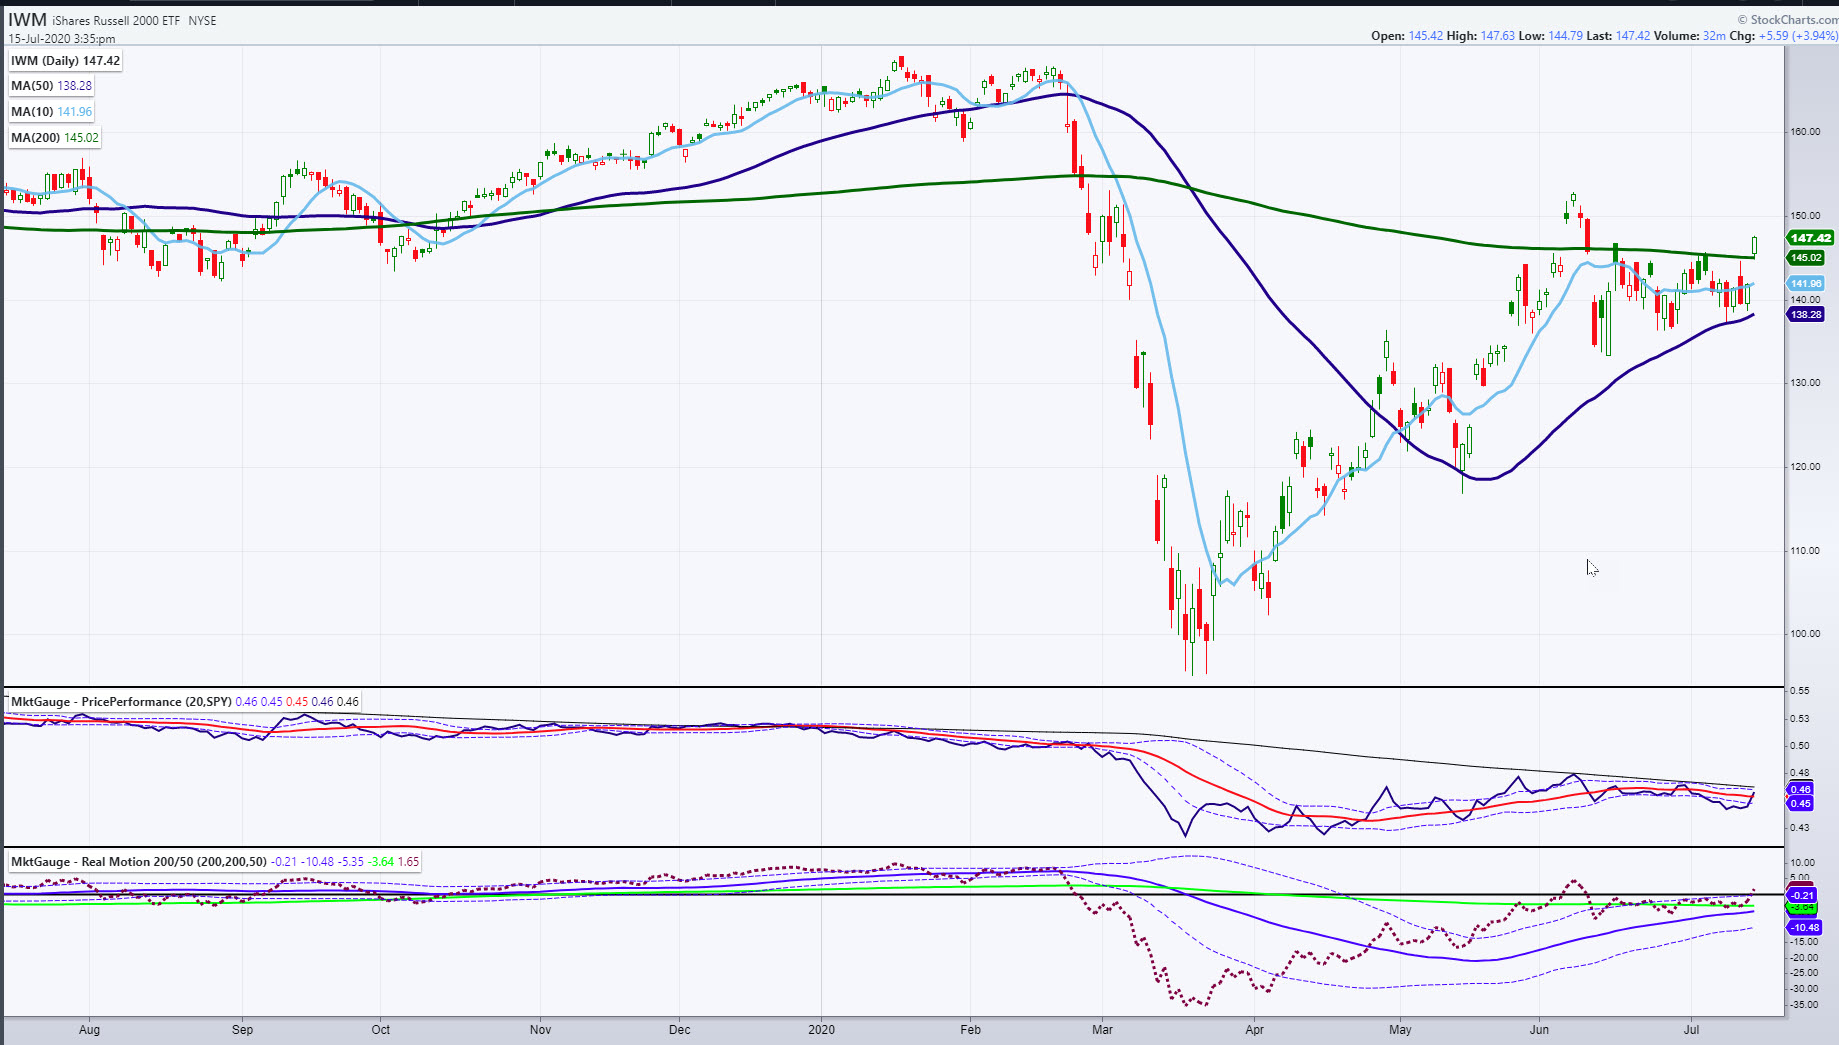
Granddad Russell 2000 Takes the Lead
Last week I did a piece called "Granny Retail Hangs Tough". At the time, I noted "On the weekly chart, XRT is above the 200-week moving average, while her husband, Russell 2000 (IWM) is not."
Also, at the time I wrote, "XRT is in...
READ MORE
MEMBERS ONLY

S&P 500 TESTS TOP OF RECENT RANGE -- RUSSELL 2000 AND DOW TRANSPORTS CLEAR 200-DAY LINES -- VALUE STOCKS GAIN GROUND -- HEALTHCARE HITS NEW RECORD -- MATERIAL STOCKS MAY BE NEXT
by John Murphy,
Chief Technical Analyst, StockCharts.com
S&P 500 TESTS JUNE HIGH... Stocks gained more ground today with ten of eleven sectors in the black. Chart 1 shows the S&P 500 ending the day just below its early June intra-day high at 3233. Also encouraging was better participation by value stocks which...
READ MORE
MEMBERS ONLY
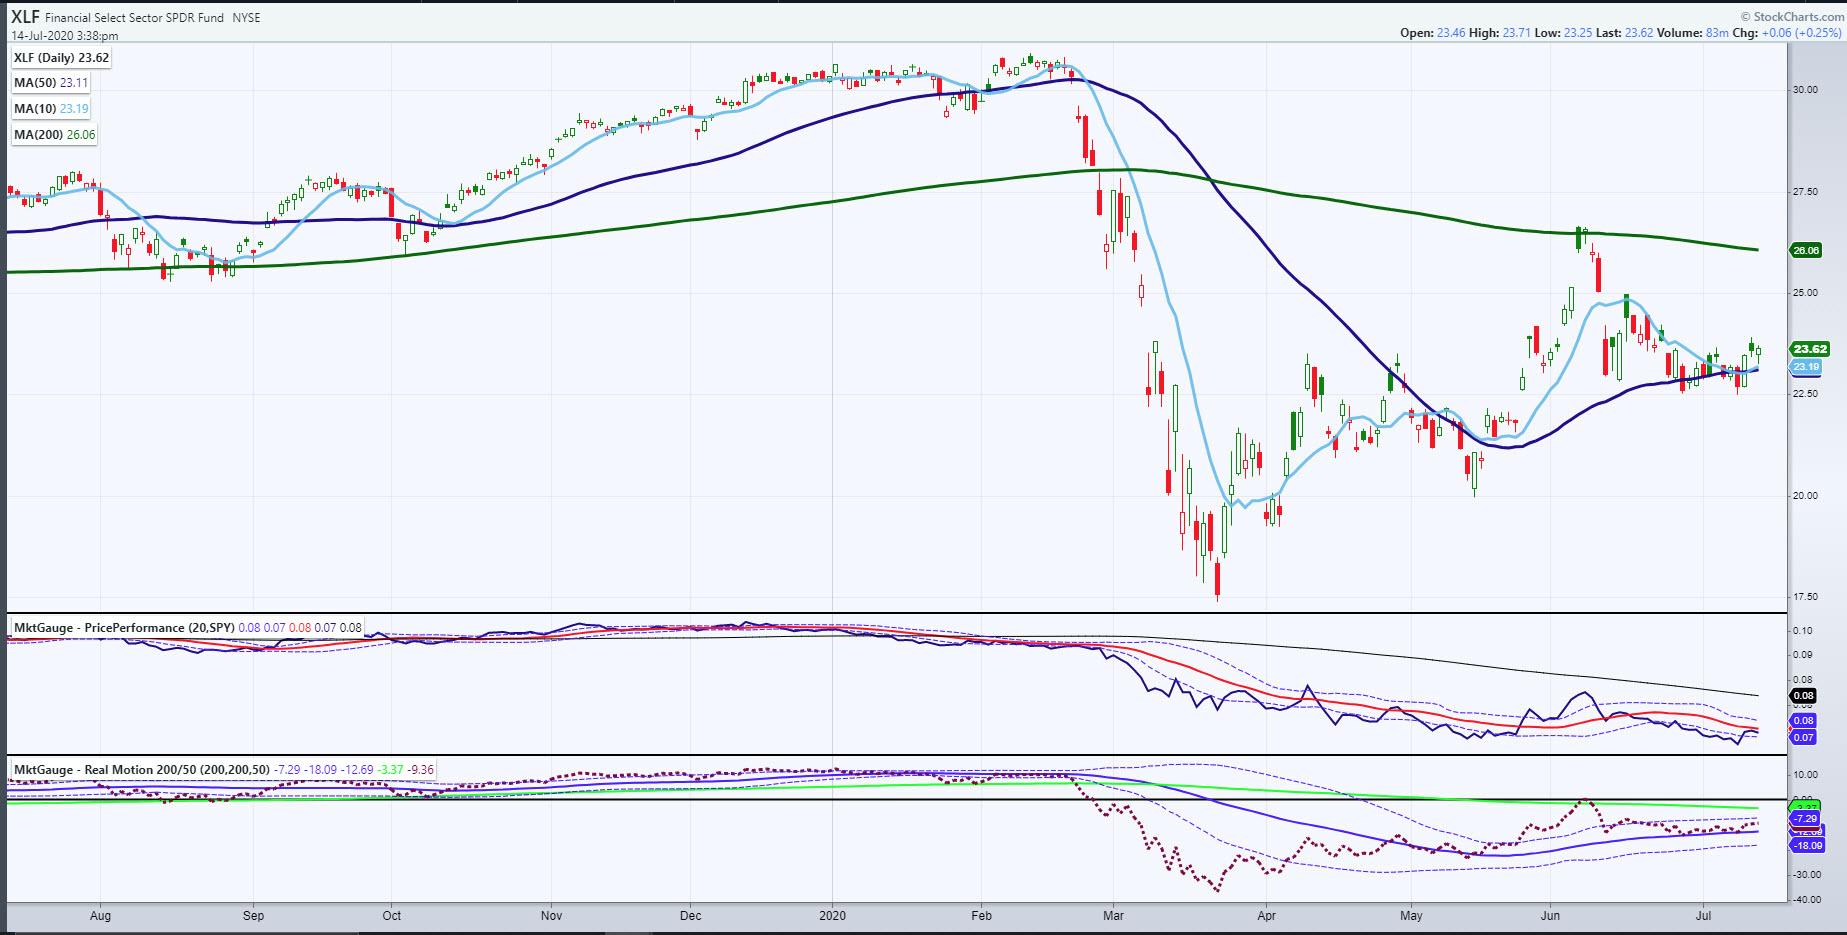
Again with the Financial Sector?
Last night, I featured junk bonds (JNK). As it has been underperforming, I wanted to give a head's up in case it failed a key support area. However, it not only held over the 101 area, it rallied to close up .97%.
With risk appetite still a thing,...
READ MORE
MEMBERS ONLY

ENERGY, MATERIALS, INDUSTRIALS, AND HEALTHCARE LEAD STOCKS HIGHER -- CATERPILLAR AND DEERE ARE XLI LEADERS -- ALIGN TECH AND UNITEDHEALTH ARE XLV LEADERS -- STOCKS CLOSE STRONG
by John Murphy,
Chief Technical Analyst, StockCharts.com
CATERPILLAR AND DEERE HAVE A STRONG DAY...With technology stocks underperforming for the second day in a row, money flowed into cheaper parts of the market today. All eleven sectors closed higher with energy, materials, industrials and healthcare in the lead. Energy is benefiting from crude oil prices over $40,...
READ MORE