MEMBERS ONLY
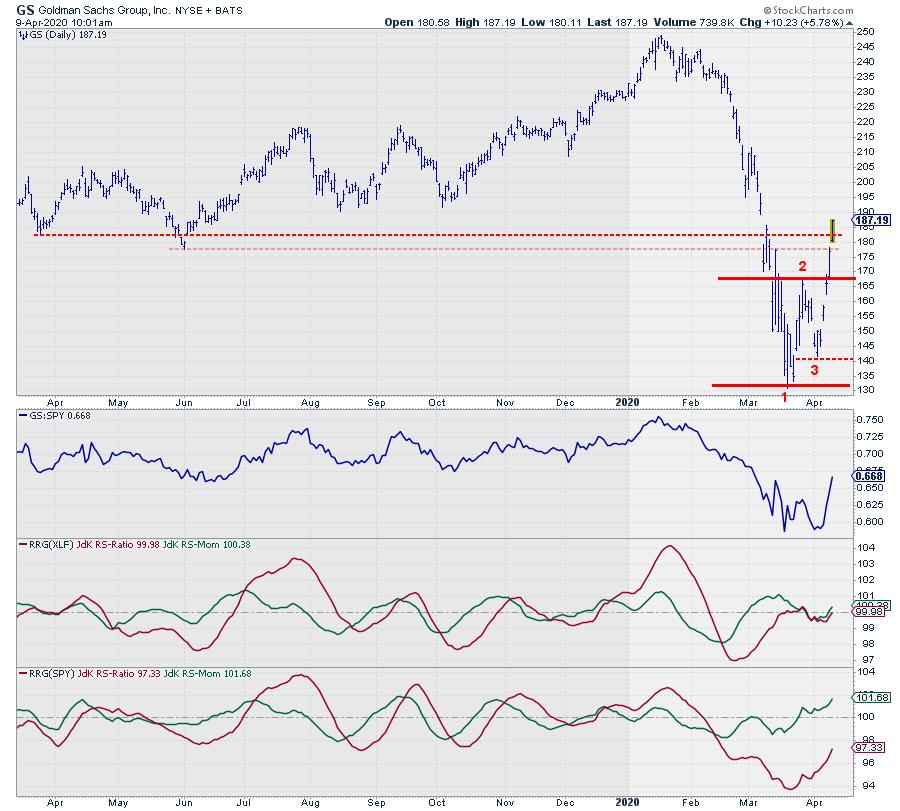
Did GS Just Come Back to Life Again?

by Julius de Kempenaer,
Senior Technical Analyst, StockCharts.com
$248.94... That was the high for GS, set on Jan 17/2020. Two months later, on Mar 19/2020, a low was reached at $130.85. The stock is almost halved... so now what?
On the (weekly) RRG for US sectors, Financials is traveling well inside the lagging quadrant...
READ MORE
MEMBERS ONLY

A Market is Only as Good as its Lowest Common Denominator
In the spirit of objectivity, we looked at the weekly chart of IWM as either a bear flag forming or, alternatively, consolidation before another rally. Then, we examined two potential cases:
* Case 1: A bear flag forming where IWM breaks down under the bear flag pennant or around 105.
* Case...
READ MORE
MEMBERS ONLY

S&P 500 2019 Q4 Earnings: Major Adjustments Coming

by Carl Swenlin,
President and Founder, DecisionPoint.com
The S&P 500 final earnings for 2019 Q4 are out, and based upon GAAP (Generally Accepted Accounting Principals) earnings, the S&P 500 is finally back into the normal value range, but is still overvalued. The following chart shows us the normal value range of the S&...
READ MORE
MEMBERS ONLY

Tuesday's Bearish Key Reversals May Have Trouble Working

by Martin Pring,
President, Pring Research
Whenever a specific technical event is repeated widely in many different stocks, it gets my attention, as it often signals a reversal in the prevailing trend. We call it the principle of commonality. Alternatively, you could think of it as the principle of strength in numbers.
Tuesday's Action...
READ MORE
MEMBERS ONLY

STOCKS GAIN MORE GROUND -- DOW AND S&P 500 MAY TEST 50% RETRACEMENT LINES -- THE QQQ IS TRYING AGAIN TO CLEAR ITS 200-DAY LINE -- ALL SECTORS ARE UP WITH REAL ESTATE, ENERGY, UTILITIES, MATERIALS, AND FINANCIALS LEADING

by John Murphy,
Chief Technical Analyst, StockCharts.com
STOCKS REGAIN UPSIDE MOMENTUM... Stocks are gaining ground today following yesterday's late selloff. Chart 1 shows the Dow Industrials gaining 3% today. Today's price gain has kept the Dow above its lower 38% Fibonnaci retracement line; and may be signalling a test of its 50% retracement...
READ MORE
MEMBERS ONLY

Bear Market: Have We Bottomed?

by Dave Landry,
Founder, Sentive Trading, LLC
In this edition of Trading Simplified, Dave continues his discussion on how to survive and prosper in a bear market, with a focus on whether we've seen the bottom. He also shows some discretionary techniques you can use to improve your performance.
This video was originally broadcast on...
READ MORE
MEMBERS ONLY
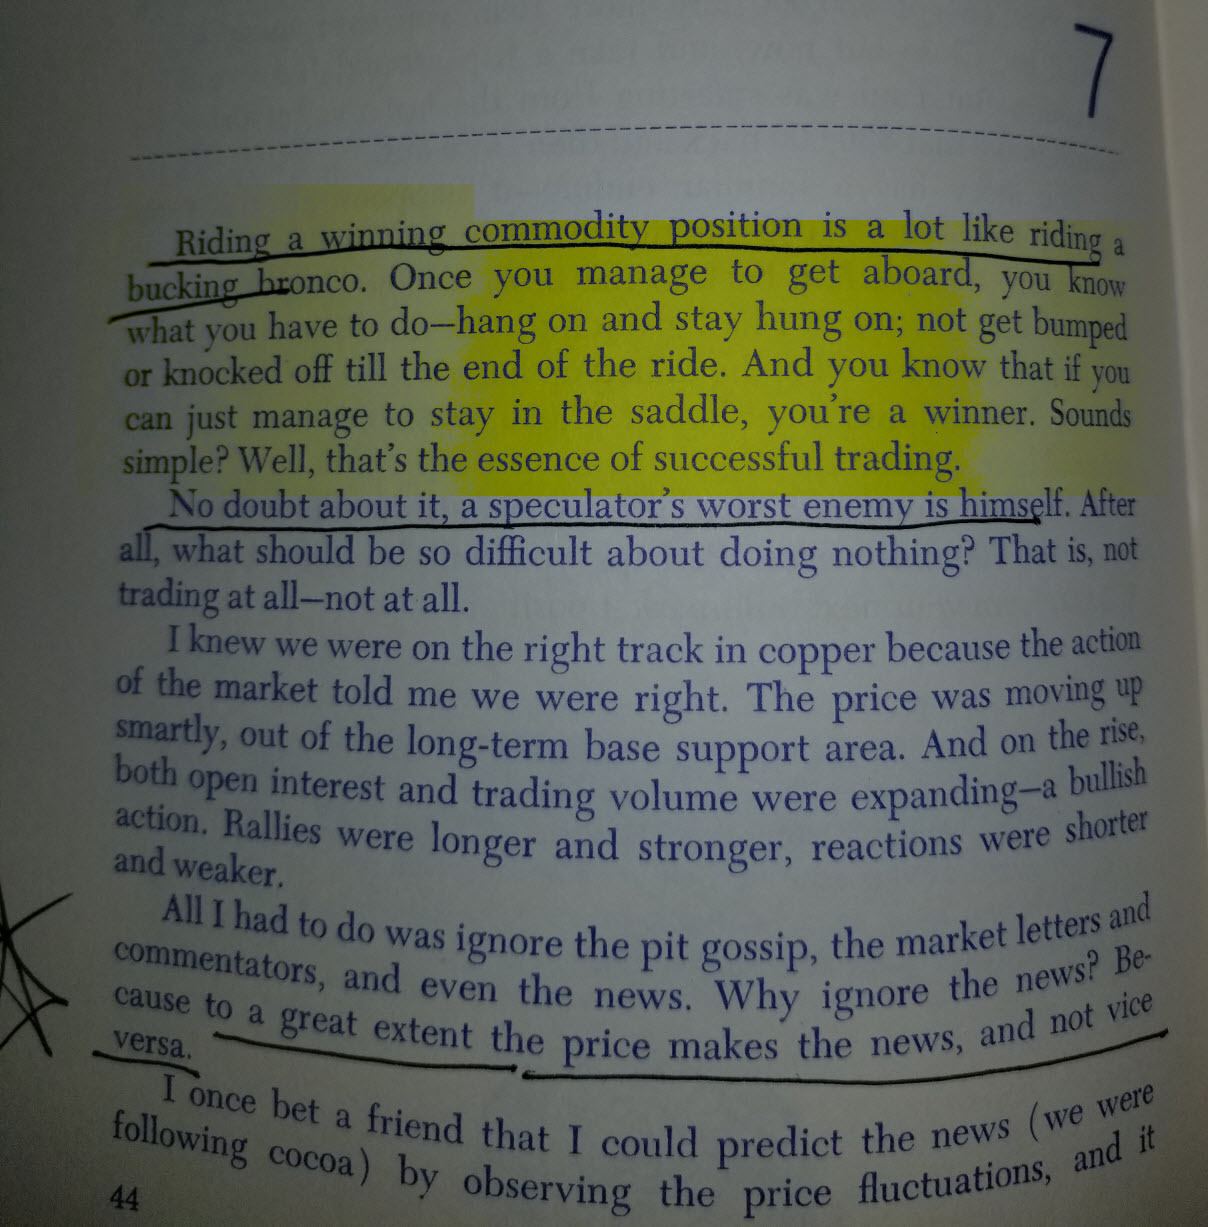
Bear Market Update: Riding a Psychotic Bronco
by Dave Landry,
Founder, Sentive Trading, LLC
Editor's Note: This article was originally written on Tuesday, April 7th, 2020.
Bill Dunn, or possibly Stanley Kroll before him (see below), equated trend following to riding a bucking bronco. I think they left out the fact that trend following on the short side is like riding a...
READ MORE
MEMBERS ONLY

Use ChartLists and RRG to Monitor your Mutual Fund Portfolio
by Julius de Kempenaer,
Senior Technical Analyst, StockCharts.com
Recently I received a message asking if Relative Rotation Graphs would be useful for tracking Mutual Funds. My answer: Of course they are!
Pricing of Mutual Funds
In essence, the prices of mutual funds are also the result of people buying and selling on financial (stock) markets. The difference between...
READ MORE
MEMBERS ONLY

TECH SPDR FALLS BACK BELOW ITS 200-DAY AVERAGE -- SO DO THE QQQ AND SEMICONDUCTOR ISHARES -- LATE STOCK SELLING MIGHT SIGNAL MORE TO COME
by John Murphy,
Chief Technical Analyst, StockCharts.com
NASDAQ 100 QQQ CLOSES BELOW 200-DAY LINE...Today's two earlier messages focused on three technology-dominated ETFs that were trying to clear their 200-day averages. All three failed that initial test by closing lower today. Chart 1 shows the Invesco QQQ Trust giving up its earlier gains and ending...
READ MORE
MEMBERS ONLY
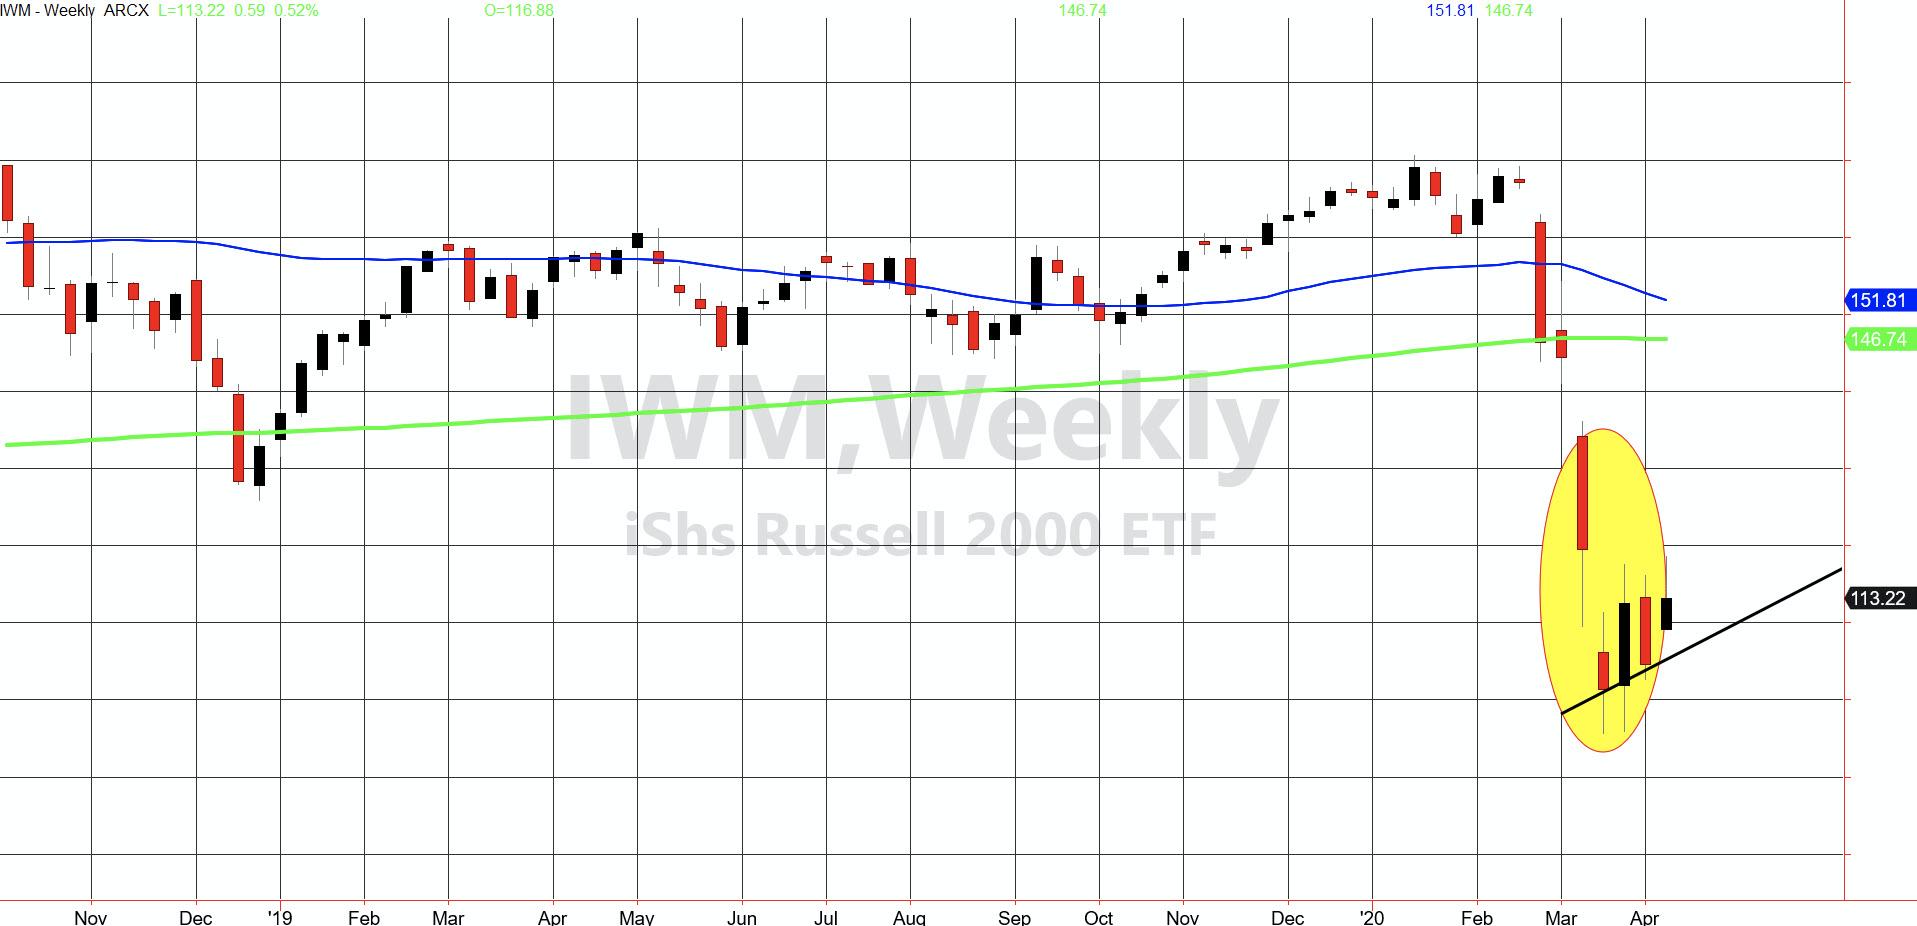
The Russell 2000's Weekly Bear Flag Setup
The Russell 2000 (IWM) weekly chart has helped us navigate the bull and bear runs for years.
While you hear so much about a V-Bottom, I see no evidence of it in this index. Significant?
Also, considering it came in having to clear the outside week trading range or move...
READ MORE
MEMBERS ONLY

Sector Spotlight: Sector Rotation, Monthly Charts using RRG and Mutual Funds
by Julius de Kempenaer,
Senior Technical Analyst, StockCharts.com
On this episode of Sector Spotlight, I take a look at sector rotation on monthly charts (since it is the first Tuesday of the month). In addition, I answer a question whether RRG can be used to monitor mutual funds.
This video was originally recorded on April 7th, 2020. Please...
READ MORE
MEMBERS ONLY

NASDAQ 100 QQQ TRADING ABOVE ITS 200-DAY LINE -- AMAZON, INTEL, AND MICROSOFT HELP LEAD IT HIGHER
by John Murphy,
Chief Technical Analyst, StockCharts.com
QQQ TRADES ABOVE 200-DAY LINE...This morning's message showed the Technology SPDR (XLK) and Semiconductor iShares (SOXX) testing their 200-day moving averages. This message focuses on the Nasdaq 100 QQQ which is also trying to clear its 200-day line. Chart 1 shows the Invesco QQQ Trust trading above...
READ MORE
MEMBERS ONLY

MAJOR STOCK INDEXES CLEAR LATE-MARCH HIGH -- ALL SECTORS ARE IN THE GREEN -- ENERGY AND MATERIALS ARE LEADING -- TECH SPDR IS TESTING ITS 200-DAY AVERAGE -- SO ARE SEMICONDUCTORS
by John Murphy,
Chief Technical Analyst, StockCharts.com
STOCK INDEXES CLEAR LATE-MARCH HIGH...The stock market is building on yesterday's strong gain to improve its short- to intermediate trend picture. The daily bars in Chart 1 show the S&P 500 rising above its late-March intra-day peak at 2641 after clearing its green 20-day average...
READ MORE
MEMBERS ONLY

DP Show: Bullish Percent Index and Q4 2019 Earnings

by Erin Swenlin,
Vice President, DecisionPoint.com
by Carl Swenlin,
President and Founder, DecisionPoint.com
In this episode of DecisionPoint, Carl and Erin look at the current market conditions and the bullish indicators that are appearing in the short- and intermediate-term timeframes. Carl points out that the Bullish Percent Index (BPI) for the S&P isn't a lagging indicator, whereas our Silver...
READ MORE
MEMBERS ONLY

Four Economic Modern Family Members Need More
Who is surprised that the two sectors of the Economic Modern Family that broke over the inside week trading ranges are Semiconductors (SMH) and Biotechnology (IBB)? Also, who is surprised that the sectors that did not break over their outside week's trading ranges are everybody else?
Like a...
READ MORE
MEMBERS ONLY

STOCKS START WEEK ON THE UPSIDE -- ALL STOCK SECTORS ARE GAINING -- BIOTECHS LEAD HEALTHCARE HIGHER -- TREASURY YIELD BOUNCES AS TREASURIES DIP -- CORPORATE BONDS ARE ACTING BETTER
by John Murphy,
Chief Technical Analyst, StockCharts.com
S&P 500 MAY BE HEADED FOR TEST OF LATE-MARCH HIGH...Global stocks are starting the week higher. The daily bars in Chart 1, for example, show the S&P 500 gapping higher this morning and clearing its green 2o-day average. The green circle shows the SPX leaving...
READ MORE
MEMBERS ONLY

This Pharma Stock May Be In For A Technical Pullback

by Milan Vaishnav,
Founder and Technical Analyst, EquityResearch.asia and ChartWizard.ae
Glenmark Pharmaceuticals Ltd (NSE) (GLENMARK.IN)
Along with underperforming the broader markets, Glenmark Pharmaceuticals has been underperforming the pharma group as well. Over the past couple of weeks, the stock has been consolidating in a 187-215 range while creating a congestion zone. Now, a few signals have appeared that point...
READ MORE
MEMBERS ONLY
Making The Bullish Case for U.S. Equities

by Tom Bowley,
Chief Market Strategist, EarningsBeats.com
Let me first say that arguing the bullish case for U.S. equities immediately puts me in the minority, which also would be my first bullish argument. When the masses believe we have nowhere to go but down, that's typically a sign that a bottom is near. Extreme...
READ MORE
MEMBERS ONLY
Top 15 Industry Groups RIGHT NOW and How To Profit From Them
by Tom Bowley,
Chief Market Strategist, EarningsBeats.com
I'm personally trading stocks in very limited circumstances, mostly because you can't trust what you see from one hour to the next. While the bigger-picture downtrend remains in play, there's a lot of rotation taking place in stocks beneath the surface. For instance, as...
READ MORE
MEMBERS ONLY

Truncated Week May See Mild Technical Pullbacks; RRGs Show Strong Relative Momentum in these Sectors
by Milan Vaishnav,
Founder and Technical Analyst, EquityResearch.asia and ChartWizard.ae
After taking a breather the week before this one, the Indian equity market resumed its downtrend again and ended this week with a net loss. With this week's decline, the NIFTY has, as of now, has declined nearly 35% on a closing basis. A week before, NIFTY had...
READ MORE
MEMBERS ONLY
Major Stock Indexes are Trying to Stabilize
by John Murphy,
Chief Technical Analyst, StockCharts.com
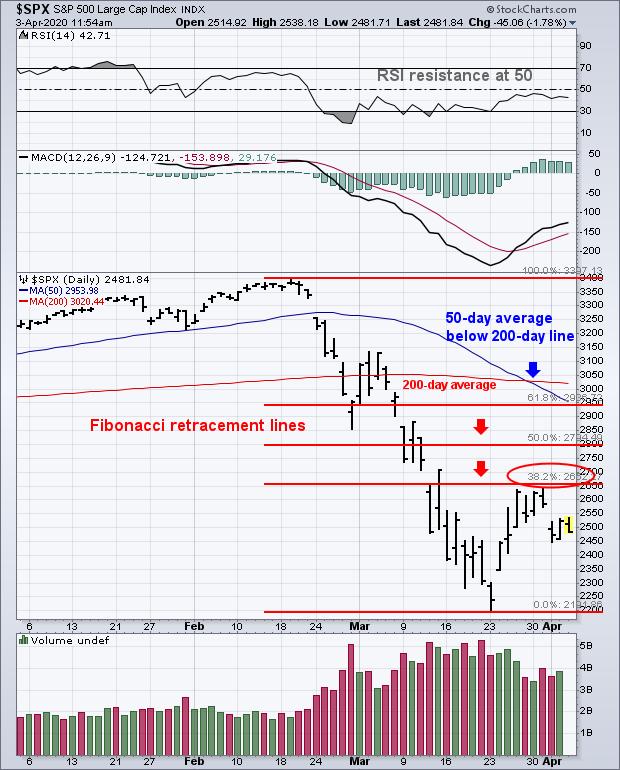
Major U.S. stock indexes continue to probe for a short-term bottom. The daily bars in Chart 1 show the S&P 500 regaining some lost ground over the last two weeks after falling to the lowest level in three years. But there's still a lot of...
READ MORE
MEMBERS ONLY

Have Oil Stocks Bottomed?

by Mary Ellen McGonagle,
President, MEM Investment Research
In this episode of StockCharts TV'sThe MEM Edge, Mary Ellen reviews the move into select areas of Oil, as well as the bullish move into Gold. She also shares winners and losers in the broader markets, talking trends that are expected to continue over the near-term while highlighting...
READ MORE
MEMBERS ONLY
Get Ready to be Shocked - To the Upside

by John Hopkins,
President and Co-founder, EarningsBeats.com
If there ever was a time to be worried about where the market could be headed, this is it. We've seen the weekly jobless claims go from a boring week-to-week reading of just over 200,000 all the way to now 6 million over the course of a...
READ MORE
MEMBERS ONLY

The Year of the Rat: Have They FED on Money Supply?
As we are a couple of months into the Year of the Metal Rat, much of what I posted back on January 19th has come true.
Raymond Lo, famous Chinese astrologer, predicted back in November 2019 that, in the Year of the Metal Rat with a water element, "There...
READ MORE
MEMBERS ONLY
DecisionPoint Short-Term Indicators Are Nailing It!
by Erin Swenlin,
Vice President, DecisionPoint.com
Today's ChartWatchers article is an updated excerpt from the DecisionPoint Alert Report for subscribers:
I pointed out to my subscribers on Thursday that, with all of the volatility, our short-term indicators seem to be more on point than usual. Below, I've included three indicator charts that...
READ MORE
MEMBERS ONLY

Jesse Says "The Only Way You Get A Real Education..."

by Gatis Roze,
Author, "Tensile Trading"
When I was a young man, there was a goofy comedy film called "The Gumball Rally" about a group of cross-country lead-footed auto racers. In an opening sequence, the character racing in his Alfa Romeo sports car jumps into the driver's seat, quickly rips the rear...
READ MORE
MEMBERS ONLY

Elevators, Oversold Bounces and Long Recoveries

by Arthur Hill,
Chief Technical Strategist, TrendInvestorPro.com
The S&P 500 went from a historic decline to a historic bounce to an above average drop. This key benchmark fell 33.9% in 23 days, surged 17.55% in three days and then dropped 5.25% the last four days. In fact, the index has experienced nine...
READ MORE
MEMBERS ONLY

MAJOR STOCK INDEXES ARE TRYING TO STABILIZE -- LONG-TERM CHARTS, HOWEVER, REMAIN A CONCERN -- WEEKLY AND MONTHY CHARTS OF THE S&P 500 SUGGEST CONTINUED STOCK MARKET RISK
by John Murphy,
Chief Technical Analyst, StockCharts.com
DAILY S&P 500 CHART CONTINUES TO STABILIZE...Major U.S. stock indexes continue to probe for a short-term bottom. The daily bars in Chart 1 show the S&P 500 regaining some lost ground over the last two weeks after falling to the lowest level in three...
READ MORE
MEMBERS ONLY

Realizing The Opportunities Ahead As A Result Of The Virus; Special Session at 10am EST
by Tom Bowley,
Chief Market Strategist, EarningsBeats.com
I've been watching in horror at some of the recent economic reports, especially the initial jobless claims, which yesterday sported a second consecutive week above 3 million. It was just a few short weeks ago that we were seeing 200,000-220,000 every week. We live in a...
READ MORE
MEMBERS ONLY

Indices and Key Sector Levels Only
Due to scheduling conflicts, tonight you are getting the levels without commentary.
Only one important note - five of the six economic modern family members are having an inside week. That means they are trading inside the range of last week.
The Russell 2000 IWM, Transportation IYT, Retail XRT, Semiconductors...
READ MORE
MEMBERS ONLY

Is It Nineteen Twenty-Nine or Nineteen Eighty-Seven? Which Sectors are Out-Perfoming?
by Martin Pring,
President, Pring Research
In my monthly Intermarket Review this month, I pointed out that, using a 6-week ROC for perspective, the DJIA dropped by 36% on March 20 -before then, there had only been two other instances where the market had fallen by a similar amount from an all-time-high. Based on the DJIA...
READ MORE
MEMBERS ONLY
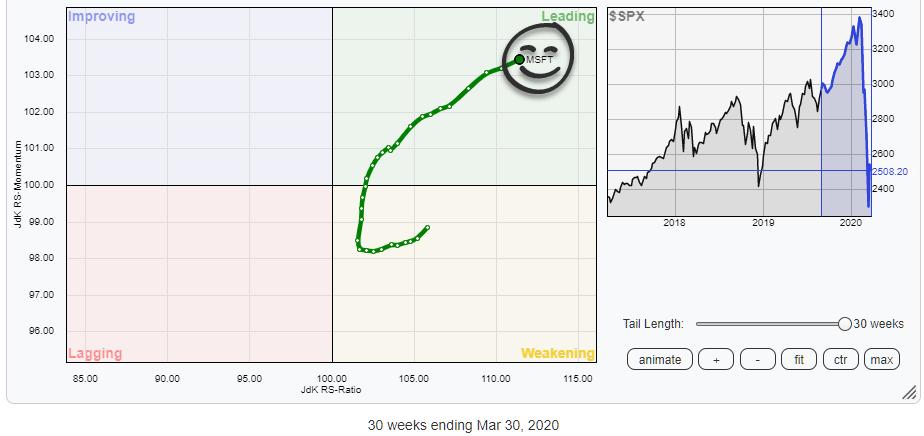
+10% in the Last 30 Weeks, Outperforming SPY by 26% and Still Moving Further Into Leading Quadrant.
by Julius de Kempenaer,
Senior Technical Analyst, StockCharts.com
Tails that rotate from the leading quadrant into weakening and then back into leading always have my attention. The reason for that is that securities that rotate along such a path are already in a relative uptrend and the rotation from leading, through weakening, back into leading ,eams that another...
READ MORE
MEMBERS ONLY

Your Money Manager is Not Prepared for This
The market has fallen over 30% from the highs. Maybe you've already called your fund or 401(k) manager and asked to liquidate your losers or the entire account. Here is what you probably heard.
"I don't recommend it."
That is typically followed by,...
READ MORE
MEMBERS ONLY
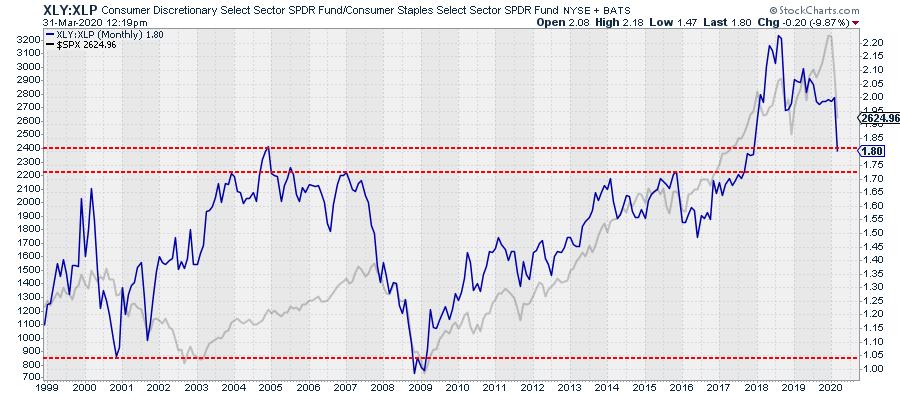
How One Stock is Holding Up an Entire Sector
by Julius de Kempenaer,
Senior Technical Analyst, StockCharts.com
The ratio between XLY:XLP, Consumer Staples vs. Consumer Discretionary, has traditionally been a pretty good gauge to get an idea about being in a risk-on or risk-off environment.
The chart above shows the XLY:XLP ratio, with the S&P 500 plotted behind it. Around the big turns,...
READ MORE
MEMBERS ONLY

Bear Market Rules Vs. Bullish Flag Formations
by Carl Swenlin,
President and Founder, DecisionPoint.com
Murphy's Law says that if something can go wrong, it will. Bear Market Rules say that even bullish chart formations are more likely to resolve bearishly, and while reviewing the sector charts this morning, I saw many examples of this. In particular, I saw a lot of broken...
READ MORE
MEMBERS ONLY

Surviving and Prospering in a Bear Market
by Dave Landry,
Founder, Sentive Trading, LLC
In this edition of Trading Simplified, Dave takes a look at where past "Mystery Charts" are now in the current market environment. Additional topics covered include why Abe Lincoln would have been a good trader, Dave's "10% line", the stock market "emotional cycle&...
READ MORE
MEMBERS ONLY

Bear Market Update: Understanding When People Buy and Sell Stocks
by Dave Landry,
Founder, Sentive Trading, LLC
One of my all-time favorite stock market quotes comes from Marian McClellan, the late mother of Tom McClellan:
"Some people buy stocks when they have money. Some people sell stocks when they need money. And, others use far more sophisticated methods."
Well said, Mrs. McClellan! Markets trade on...
READ MORE
MEMBERS ONLY

A Recent Search Study Suggests That A Paradigm Shift Favors This Company
by Tom Bowley,
Chief Market Strategist, EarningsBeats.com
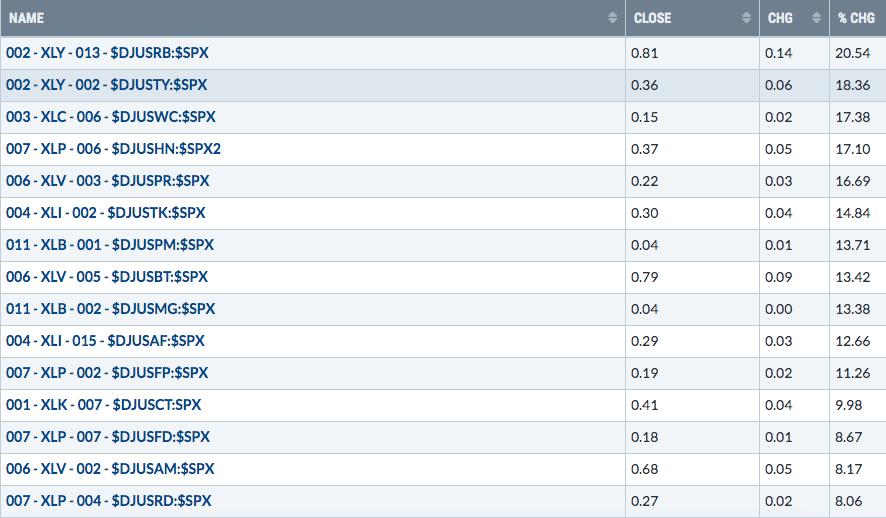
I've been spending much of my time lately ignoring the recreational products group ($DJUSRP). And for good reason. This industry ranked 75th in performance out of 104 groups over the period February 19th through March 23rd - the period in which the S&P 500 fell from...
READ MORE
MEMBERS ONLY

Three Surprise Charts Facing Huge Resistance

by David Keller,
President and Chief Strategist, Sierra Alpha Research
My weekly routine involves two important steps. First, in preparation for Friday's edition of The Final Bar, I go through a series of long-term macro charts for my Wrap the Week segment. Second, over the weekend I review the individual stock charts for all the S&P...
READ MORE
MEMBERS ONLY
Sector Spotlight: Strong Seasonality for Utilities Going Into April
by Julius de Kempenaer,
Senior Technical Analyst, StockCharts.com
On this episode of Sector Spotlight, I take a closer look at what's happening in the various Asset Classes. Afterwards, I examine the Utilities sector, as it has a strong seasonality going into April which is now backed by a strong tail/rotation on the RRG.
This video...
READ MORE
