MEMBERS ONLY

"Bull in a China Shop" Revisited, Plus Some Interesting Chinese ETFs

by Martin Pring,
President, Pring Research
* Shanghai is Outperforming the US
* Interesting Chinese Sectors
Shanghai is Outperforming the US
Back in early January, I drew your attention to the fact that the Shanghai Composite ($SSEC) had broken to the upside, which is shown in Chart 1. A week or so later, when the coronavirus reared its...
READ MORE
MEMBERS ONLY

Traits of Successful Traders and How to Acquire Them, Part 2

by Dave Landry,
Founder, Sentive Trading, LLC
In this edition of Trading Simplified, Dave walks viewers through some more of the key traits of successful traders and how viewers can acquire them. He also takes some time out to acknowledge the elephant - or is it the bear? - in the room regarding the markets.
This video...
READ MORE
MEMBERS ONLY

SHORT-TERM STOCK REBOUND CONTINUES -- S&P 500 REGAINS 200-DAY LINE -- UPSIDE RESISTANCE LEVELS TO WATCH -- VIX FALLS BACK BELOW 40 -- TREASURY BOND ISHARES LOOK OVERBOUGHT

by John Murphy,
Chief Technical Analyst, StockCharts.com
SHORT-TERM STOCK REBOUND CONTINUES... Extremely oversold readings on daily charts at the end of last week, combined with chart support near the October low, increased odds for a rebound in stocks this week. Stocks are rebounding today after yesterday's selloff. And are building on gains that started on...
READ MORE
MEMBERS ONLY

Sector Spotlight: A Look at Monthly Charts for Asset Classes and Sectors

by Julius de Kempenaer,
Senior Technical Analyst, StockCharts.com
In this edition of StockCharts TV'sSector Spotlight, I look at the monthly charts for asset classes and sectors in combination with their rotations on RRG. In addition, I also answer a question from the mailbag on using leveraged ETFs on Relative Rotation Graphs
This video was originally recorded...
READ MORE
MEMBERS ONLY

DP Show: Roller Coaster + Bear Market Rules + Sector Update

by Erin Swenlin,
Vice President, DecisionPoint.com

by Carl Swenlin,
President and Founder, DecisionPoint.com
In this episode of DecisionPoint, Carl and Erin discuss the current condition of the market with a summary of exclusive DecisionPoint indicators. The two open the show with a review of "bear market rules" and Carl explains his rationale for this being a bear market in the making....
READ MORE
MEMBERS ONLY

Random Thoughts: Where Are We Now and What to Do?
by Dave Landry,
Founder, Sentive Trading, LLC
I suppose the $64,000 question is: "Is this the beginning of the end?" I'm not convinced just yet, but we have gotten some minor and major sell signals. I've also gotten pruned out of quite a few positions. Let's explore where...
READ MORE
MEMBERS ONLY

Quantifying Retracements to Find Stocks and ETFs that Held Up Relatively Well During the Onslaught

by Arthur Hill,
Chief Technical Strategist, TrendInvestorPro.com
Looking for an indicator to find stocks and ETFs that held up the best last week? Look no further. Today I will show how to use a classic indicator to quantify last week's decline and rank names by their retracements.
In general, stocks bottomed in early October and...
READ MORE
MEMBERS ONLY

DAILY OVERSOLD READINGS COULD SUPPORT REBOUND -- BUT WEEKLY RSI NOT YET OVERSOLD -- NEITHER IS THE % SPX STOCKS BELOW 200-DAY LINE -- VIX INDEX REACHES POTENTIAL RESISTANCE AT 40
by John Murphy,
Chief Technical Analyst, StockCharts.com
VERY OVERSOLD BUT NO REBOUND YET... After this week's stock plunge, it's not surprising to see short-term momentum and sentiment indicators reach very oversold conditions. That doesn't guarantee a short-term bottom; but does increase the technical odds for one. And even if one does...
READ MORE
MEMBERS ONLY
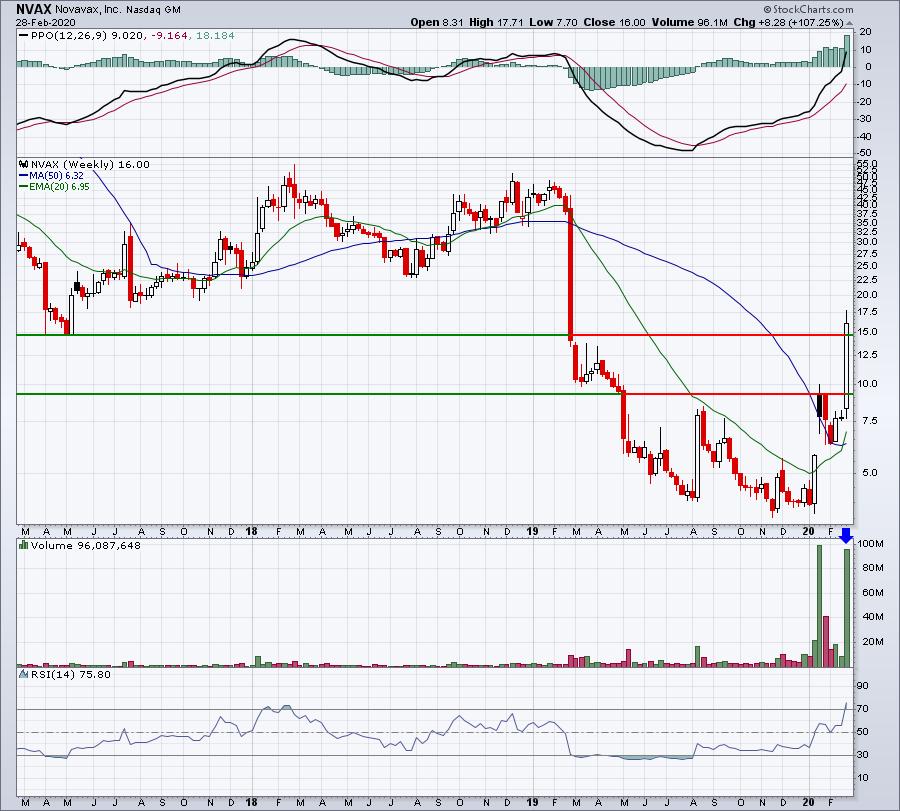
Here's The Only NASDAQ 100 Stock To Gain Ground Last Week

by Tom Bowley,
Chief Market Strategist, EarningsBeats.com
100 component stocks. 99 losers and 1 winner last week. That's how negative the breadth was for the week. I'm not surprised that a biotechnology stock ($DJUSBT) was the sole winner. While the coronavirus negatively impacted nearly all stocks last week, biotech names that offer potential...
READ MORE
MEMBERS ONLY

Week Ahead: After One of the Most Brutal Selloffs of the Decade, What Next?

by Milan Vaishnav,
Founder and Technical Analyst, EquityResearch.asia and ChartWizard.ae
The previous week saw one of the worst sell-offs of the decade when the global markets reacted with absolute panic to the spread of the coronavirus, and the Indian markets were affected as well. The global financial markets went in disarray as the world grappled with the possibility of the...
READ MORE
MEMBERS ONLY
Bottom Fishing - Three Candidates After Last Week's Sharp Selloff

by Mary Ellen McGonagle,
President, MEM Investment Research
It was a tough week for investors following last week's sharp drop in the markets, particularly as many individual stocks sold off even more than the averages. Selling was broad-based and on heavy volume, with the Dow Jones Industrial Average experiencing its biggest decline since the October 2008...
READ MORE
MEMBERS ONLY
5 Key Takeaways From Last Week's Historic Drop
by Tom Bowley,
Chief Market Strategist, EarningsBeats.com
The selling we saw this week was one for the ages. Yes, I've been extremely bullish for a long time and it's primarily because of the economic environment. There's never been a time when we've been looking at moderate growth, historically-low interest...
READ MORE
MEMBERS ONLY
Three Charts Suggesting Further Downside

by David Keller,
President and Chief Strategist, Sierra Alpha Research
Are the markets oversold? Yes.
Is it reasonable to expect that next week will see the markets recover at least a bit after this week's mayhem? Absolutely. But here are three charts suggesting that any short-term market bounce will most likely be followed by further downside for stocks....
READ MORE
MEMBERS ONLY

Three Charts That Suggest an Interim Bottom is at Hand
by Martin Pring,
President, Pring Research
It's been quite a week, but the charts are starting to look to me as if a bottom is close at hand. In order to identify one, I look at a couple of factors. First, are there any signs of a one or two bar reversal pattern? Take...
READ MORE
MEMBERS ONLY

MEM Edge TV: Is it Time to Buy After Last Week's Selloff?
by Mary Ellen McGonagle,
President, MEM Investment Research
On this episode of StockCharts TV'sThe MEM Edge, Mary Ellen reviews bright spots in the market and what to be on the lookout for next week. She also shared stocks poised to benefit longer-term from the coronavirus, as well as the best timeframe chart to use in the...
READ MORE
MEMBERS ONLY
This is My Trendline, Which One is Yours?
by Julius de Kempenaer,
Senior Technical Analyst, StockCharts.com
What a week...
Where do I start???
Let's just say that this was not a boring week for the markets...... at all!
When markets go crazy and swings get out of control, I have learned to step back and look at the bigger picture - and keep it...
READ MORE
MEMBERS ONLY

Purpose, Process and Preparation: My Week Has Been Fine, How 'Bout Yours?

by Grayson Roze,
Chief Strategist, StockCharts.com
My fiancé texted me after the close on Monday afternoon with a link to some newspaper article about the major selloff. "You were right!" she added. I chuckled and tucked the phone back in my pocket.
See, every Sunday, Hannah graciously puts up with me as I take...
READ MORE
MEMBERS ONLY

Best And Worst Performers During The Past Week's Coronavirus Market Attack
by Tom Bowley,
Chief Market Strategist, EarningsBeats.com
The selloff has been sharp, it's been fast, and it's been severe. And it may not be over. Huge spikes in the Volatility Index ($VIX) establish major market bottoms and Thursday's VIX close at 39 certainly qualifies as that. The following chart shows you...
READ MORE
MEMBERS ONLY

VIX CLOSES AT HIGHEST LEVEL IN TWO YEARS -- S&P 500 FALLS BELOW ITS 200-DAY AVERAGE --- FIVE MORE SECTORS FELL BELOW THEIR 200-DAY LINES -- THAT PUTS EIGHT SECTORS IN DOWNTRENDS
by John Murphy,
Chief Technical Analyst, StockCharts.com
VIX CLOSES AT HIGHEST LEVEL IN TWO YEARS... Stocks sold off hard again today with more 200-day moving averages being broken. The inability of stock indexes to offer any buying near those long-term support lines is a very discouraging sign. So was today's large jump in the CBOE...
READ MORE
MEMBERS ONLY
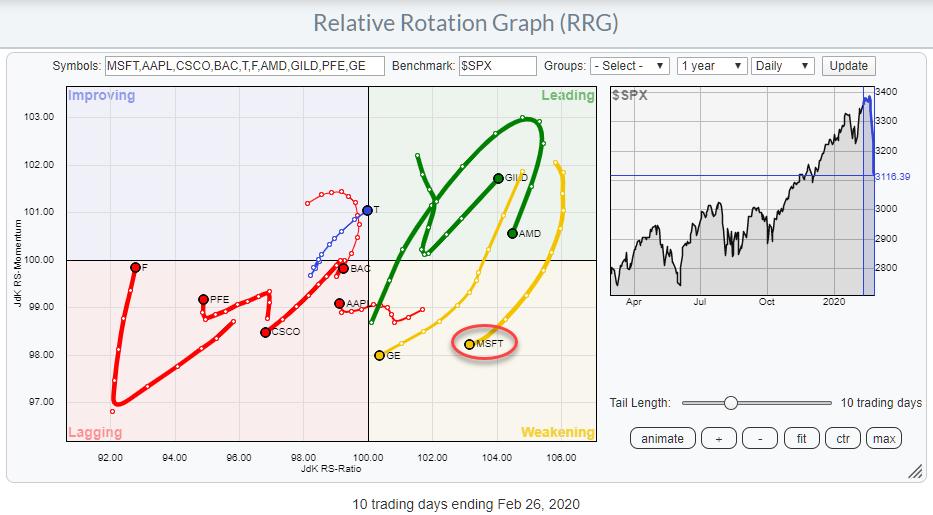
Use RRG to Get a Grip on Where the Action is - Throw in Symbol Summary to Be Prepared
by Julius de Kempenaer,
Senior Technical Analyst, StockCharts.com
Days with wild swings, as we are seeing at the moment, are either heaven or hell, depending on what kind of trader or investor you are. Those looking for action will have a field day.
But how do you easily find tradable securities? And how do you get a handle...
READ MORE
MEMBERS ONLY
What A Difference A Week Makes; Searching For A Bottom
by Tom Bowley,
Chief Market Strategist, EarningsBeats.com
One week ago, the U.S. stock market was euphoric and it had a right to be. Companies that have been able to grow earnings rapidly in a historically low interest rate environment, with rates likely to move even lower, were seeing those earnings valued at a record level. GDP...
READ MORE
MEMBERS ONLY
Curating Your Watchlist - This Stock is Poised to Outperform Once the Markets Turn Positive
by Mary Ellen McGonagle,
President, MEM Investment Research
The S&P 500 has dropped 8.2% since hitting a new high in price just six days ago, and the heavy selling has pushed many individual stocks down even more.
That may be great news for those looking to purchase high quality stocks at a discount; however, there...
READ MORE
MEMBERS ONLY

NO SIGN OF A BOTTOM YET AS EARLY BOUNCE FADES -- SELLOFF IN TRANSPORTS AND SMALL CAPS DEEPENS -- TWO SECTOR SPDRS THREATEN 200-DAY AVERAGES -- WHILE ANOTHER ONE SLIPPED BELOW ITS RED LINE -- SPX MAY BE HEADED TOWARD ITS 200-DAY LINE
by John Murphy,
Chief Technical Analyst, StockCharts.com
S&P 500 APPEARS HEADED TOWARD 200-DAY AVERAGE... An early rebound attempt faded today and the Dow and S&P 500 ended the day lower. Only the Nasdaq managed to hold onto a small gain. The Dow Industrials closed below their 200-day average for the second day in...
READ MORE
MEMBERS ONLY

Traits of Successful Traders and How to Acquire Them, Part 1
by Dave Landry,
Founder, Sentive Trading, LLC
In this edition of Trading Simplified, Dave walks viewers through some key traits of successful traders and how viewers can acquire them. These include topics like patience, negative and positive emotions and dealing with the mediocracy.
This video was originally recorded on February 26th, 2020. Click anywhere on the Trading...
READ MORE
MEMBERS ONLY

Sector Spotlight: Stock/Bond Relationship Rolling Over on RRG
by Julius de Kempenaer,
Senior Technical Analyst, StockCharts.com
In this edition of StockCharts TV'sSector Spotlight, I analyze the impact of current market movements on sector- and asset-class rotations. After the break, I answer a question from the mailbag and introduce a new pair trade idea.
This video was originally recorded on February 25th, 2020. Click anywhere...
READ MORE
MEMBERS ONLY

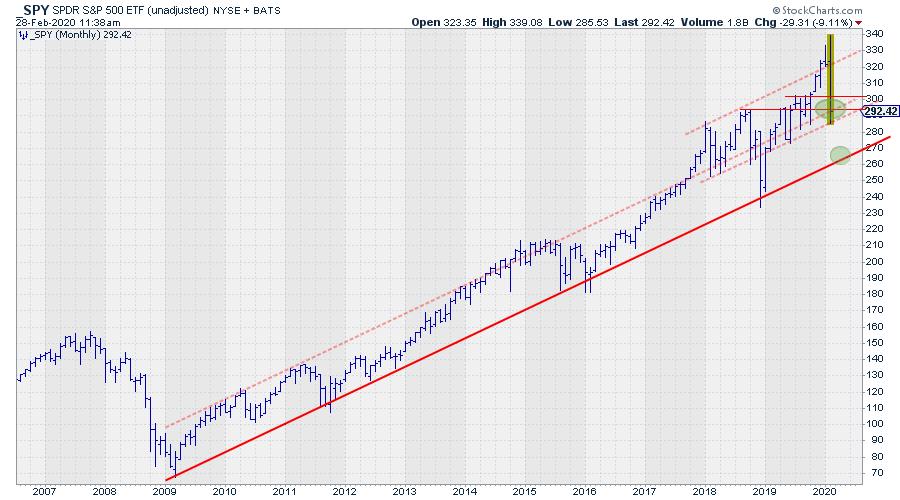
The Correction May Well Extend, But Some Green Shoots are Starting to Appear
by Martin Pring,
President, Pring Research
* Some Signs of Weakness
* On a More Bullish Note
* Mind that Gap and Volatility
Last time I wrote about the stock market was the first week in February, where I concluded that a couple of indicators were oversold, but that many others were not, so further corrective action probably lay...
READ MORE
MEMBERS ONLY

STOCK CORRECTION DEEPENS -- NASDAQ AND S&P 500 BREAK JANUARY LOWS -- DOW FALLS BELOW 200-DAY LINE -- SO DO BANKS, MATERIALS, SMALL CAPS, AND TRANSPORTS -- 10-YEAR TREASURY FALLS TO RECORD LOW
by John Murphy,
Chief Technical Analyst, StockCharts.com
MARKET ROUT CONTINUES... Stocks tumbled for the second day in a row and in heavy trading once again. And important support levels are being broken. The S&P 500 and Nasdaq fell below their January lows today and further below their 50-day averages in pretty decisive fashion. Charts 1...
READ MORE
MEMBERS ONLY

Roundup of Pair Trade Ideas from Sector Spotlight
by Julius de Kempenaer,
Senior Technical Analyst, StockCharts.com
Since November, I've had a recurring segment in each episode of Sector Spotlight on Pair Trading Ideas. Every show, I try to come up with a pair trade idea using Relative Rotation Graphs on various universes and on various timeframes.
These ideas were, and still are, practical examples...
READ MORE
MEMBERS ONLY

DP Alert: We Were Warned (Part II)
by Erin Swenlin,
Vice President, DecisionPoint.com
As I sat in the jury room today waiting for my panel to be called, I watched from my phone the crazy market action. It just figured I'd be stuck there without my giant display screen to decipher charts. Since Carl's article today was called "...
READ MORE
MEMBERS ONLY

GLOBAL STOCKS TUMBLE ON CORONAVIRUS SPREAD -- 10-YEAR YIELD FALLS TO NEARLY FOUR-YEAR LOW -- ENERGY, TECH, AND CYCLICALS LEAD THE DECLINE -- SOME SUPPORT LEVELS HAVE BEEN BROKEN -- VIX SURGES TO HIGHEST LEVEL IN A YEAR
by John Murphy,
Chief Technical Analyst, StockCharts.com
GLOBAL STOCKS PLUNGE ON CORONAVIRUS SPREAD... Recent technical warnings that global stocks were vulnerable to more selling became a harsh reality today. And in a big way. Global stocks fell the most in nearly a year. Selling started in Asia and Europe before spreading to the states. And a lot...
READ MORE
MEMBERS ONLY

We Were Warned
by Carl Swenlin,
President and Founder, DecisionPoint.com
I have often thought of using technical analysis as being somewhat like being the pilot of a paddle wheel steamer on the Mississippi River in the 1800s. He watched for eddies, roiling, churning and waves to warn of the possible dangers and help guide the boat safely to its destination....
READ MORE
MEMBERS ONLY

Market Makers Are Counting All Their Stolen Money This Weekend; The Selloff Will Be Short-Lived
by Tom Bowley,
Chief Market Strategist, EarningsBeats.com
I heard one unmistakeable sound on Thursday and Friday. It was the sound of market makers driving away in Brinks trucks, you know, the kind that transports boatloads of money. Before I delve into the thievery that took place on Wall Street last week, let me first remind you of...
READ MORE
MEMBERS ONLY

GLOBAL STOCK INDEXES LOOK VULNERABLE -- THAT INCLUDES AN OVERBOUGHT S&P 500 -- EAFE ISHARES BACKING OFF FROM 2018 HIGH -- EMERGING MARKETS LOOKING THE WEAKEST -- % S&P 500 STOCKS ABOVE 50-DAY AVERAGE WEAKENS
by John Murphy,
Chief Technical Analyst, StockCharts.com
GLOBAL STOCKS LOOK OVER-EXTENDED AND VULNERABLE... A number of recent messages have shown charts suggesting that the U.S. stock market looks overbought on the upside and vulnerable to some profit-taking. Not necessarily a major top, but a correction of some sort. Foreign stocks look even more vulnerable. And what...
READ MORE
MEMBERS ONLY

Week Ahead: Watching This Level Important; RRG Chart Show These Sectors Rotating Favorably
by Milan Vaishnav,
Founder and Technical Analyst, EquityResearch.asia and ChartWizard.ae
While trading just on the anticipated lines, the Indian equity markets continued to consolidate around critical levels throughout the previous week, ending flat with negligible loss. Just as mentioned and expected in the last weekly note, the NIFTY did not make any major headway; the upsides stayed limited and within...
READ MORE
MEMBERS ONLY
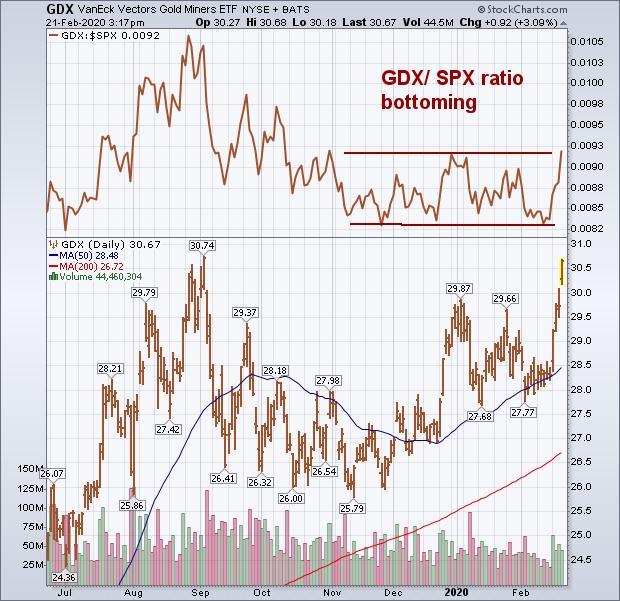
Friday's Selling Suggests that Overbought Stock Pullback has Probably Begun
by John Murphy,
Chief Technical Analyst, StockCharts.com
With gold surging again today to another seven-year high, gold miners are having an even stronger day percentage-wise. And are nearing a major upside breakout. Chart 1 shows the VanEck Gold Miners ETF (GDX) trading 3% higher today and nearing a challenge of its early September peak. A close above...
READ MORE
MEMBERS ONLY
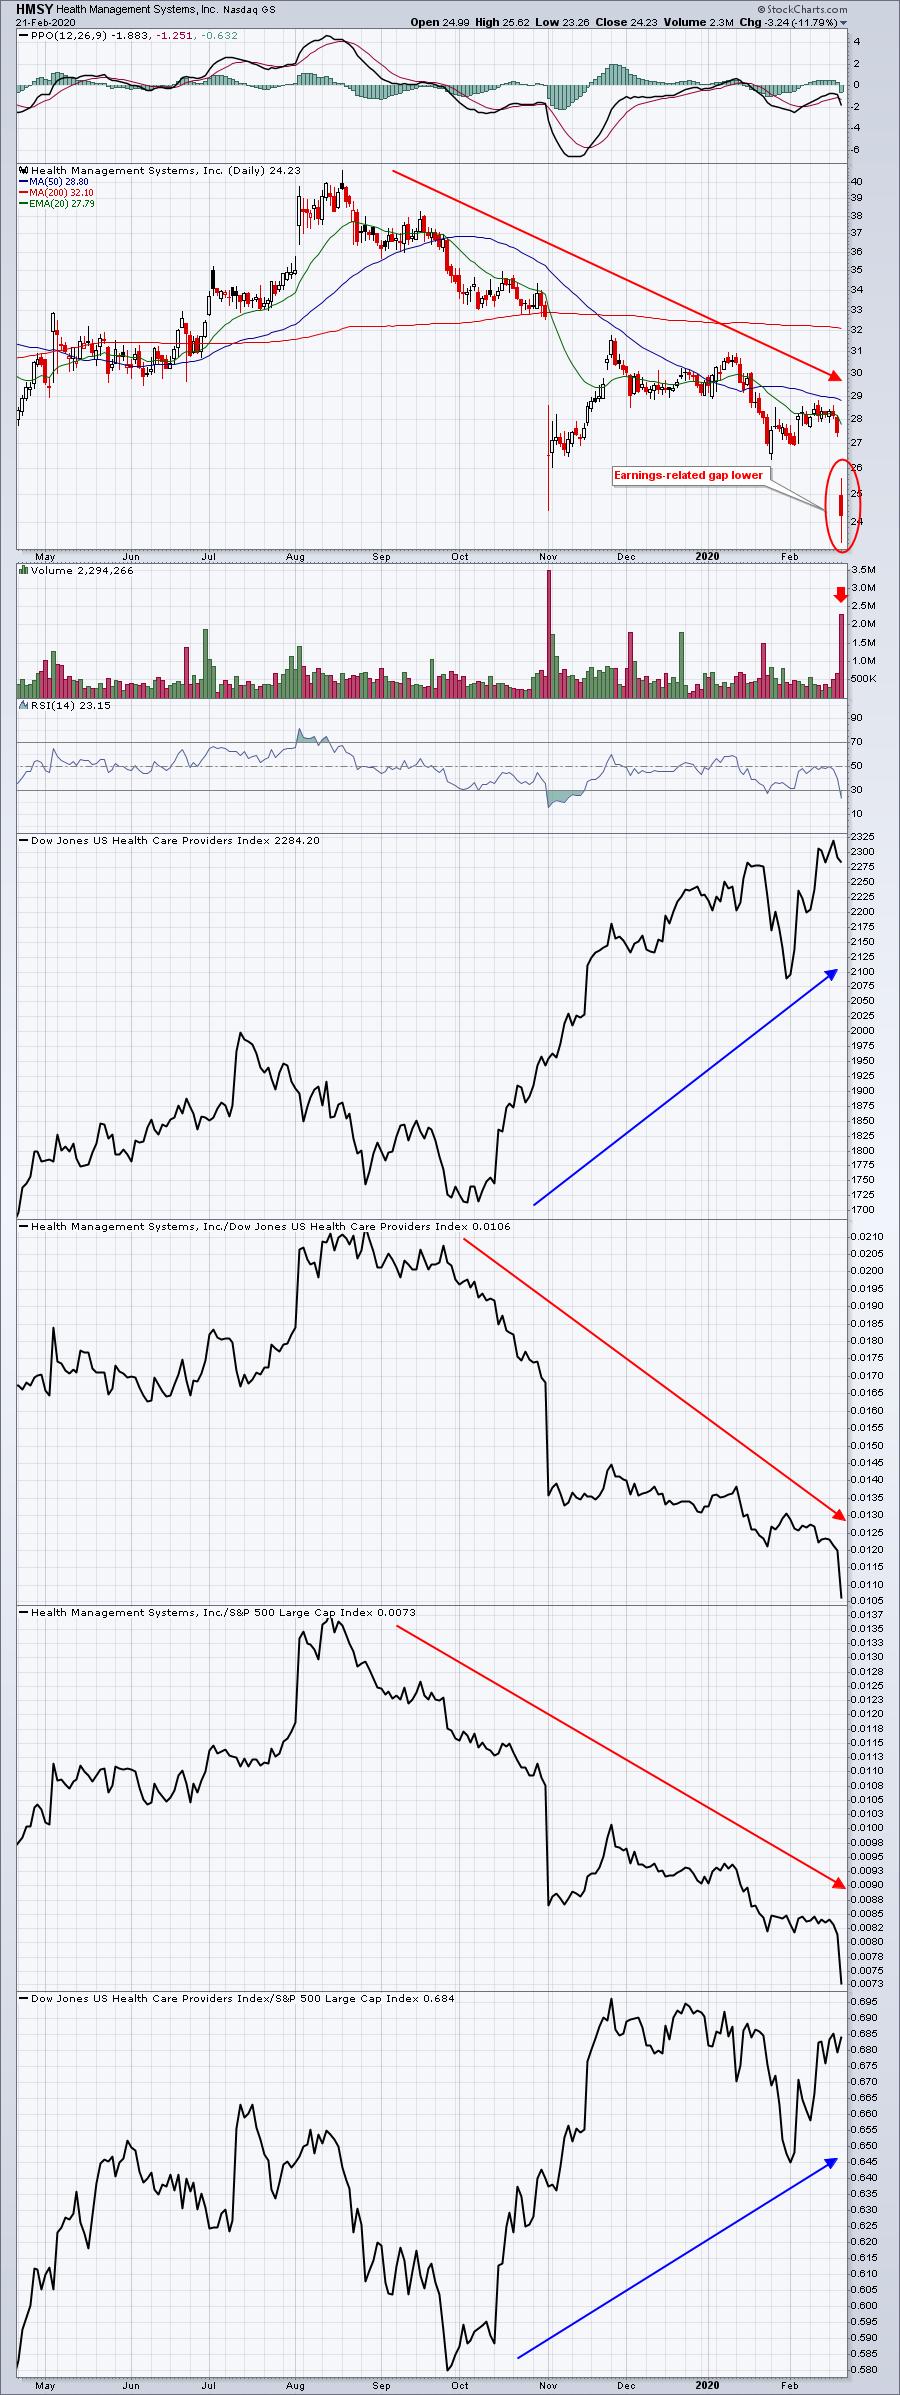
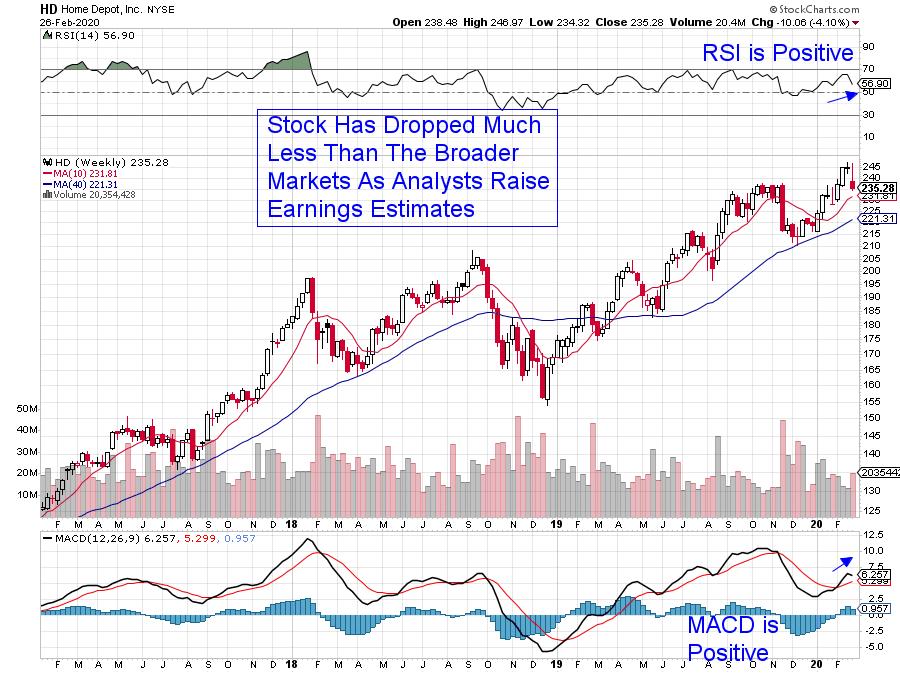
Don't Buy a Stock Like This Heading into Earnings

by John Hopkins,
President and Co-founder, EarningsBeats.com
Earnings season has come and (mostly) gone, with all of the major companies reporting Q4 numbers. The consensus is that, overall, earnings were strong, as witnessed by record levels in the market. But there were also companies that came up short that had charts showing warning signs, one of them...
READ MORE
MEMBERS ONLY

MEM Edge TV: Is it Time to Exit the Markets?
by Mary Ellen McGonagle,
President, MEM Investment Research
On this episode of StockCharts TV'sThe MEM Edge, Mary Ellen reviews current market dynamics and what to be on the lookout for going forward. She also shares pockets of strength in defensive, along with growth areas of the market that appear poised to withstand virus-related fears.
This video...
READ MORE
MEMBERS ONLY
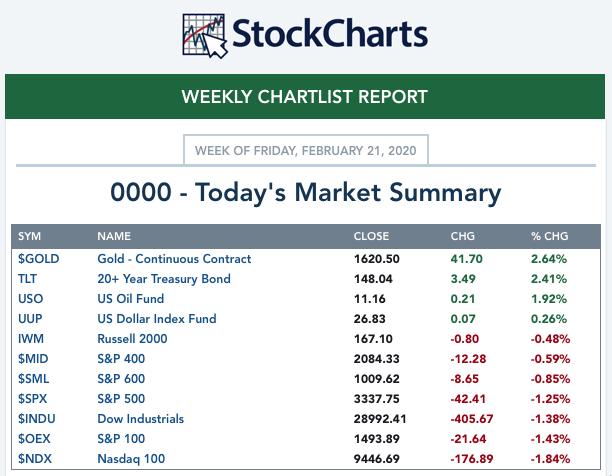
20+ Year Treasury Bond ETF (TLT) Breaks Out to New All-Time Highs
by Erin Swenlin,
Vice President, DecisionPoint.com
This week's big winners were $GOLD and TLT, though the Dollar also did fairly well. Carl will be writing about these three (as well as Oil) in this week's edition of the "DecisionPoint Weekly Wrap" on DecisionPoint.com (We would love to have you...
READ MORE
MEMBERS ONLY
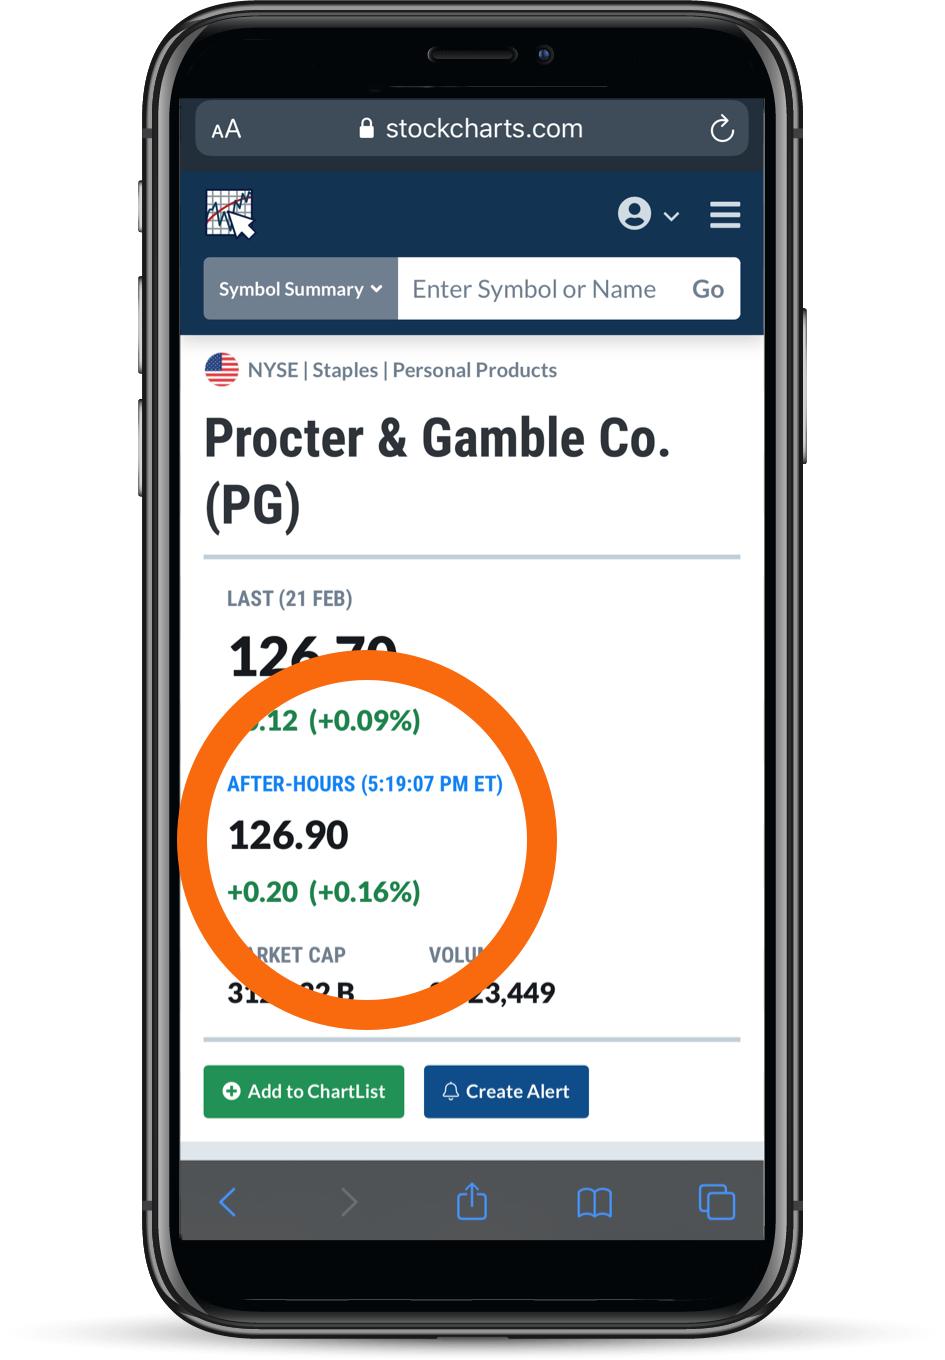
We've Gone "After Hours": Pre- And Post-Market Data, Now On "Symbol Summary"
by Grayson Roze,
Chief Strategist, StockCharts.com
Before I tell you what we've just done, I need to issue a formal apology.
To your family, your friends, your co-workers - everyone in your circle - I am sorry.
See, we‘ve now added after-hours data to the Symbol Summarypage for both the pre- and post-market...
READ MORE
MEMBERS ONLY

Bank ETF Gets a Bounce, but <BR>Falling Yields Could Spoil the Party
by Arthur Hill,
Chief Technical Strategist, TrendInvestorPro.com
After falling for over a year, the Regional Bank ETF (KRE) finally got its mojo back in the fourth quarter of 2019 and broke out to new highs. The ETF then became overextended in mid December and fell back to the 200-day SMA here in February. A potentially bullish setup...
READ MORE