MEMBERS ONLY
Yield Stocks With Growth Prospects: 3 Dow Stocks You Want To Be Aware Of

by Mary Ellen McGonagle,
President, MEM Investment Research
It was another bumpy week in the markets, as investors digested a barrage of political headlines which brought fear-induced selling to those areas most sensitive to the latest tweet. While the Tech-heavy Nasdaq was hardest hit, the Dow Jones Industrial Average held in surprisingly well last week, with several heavyweight...
READ MORE
MEMBERS ONLY
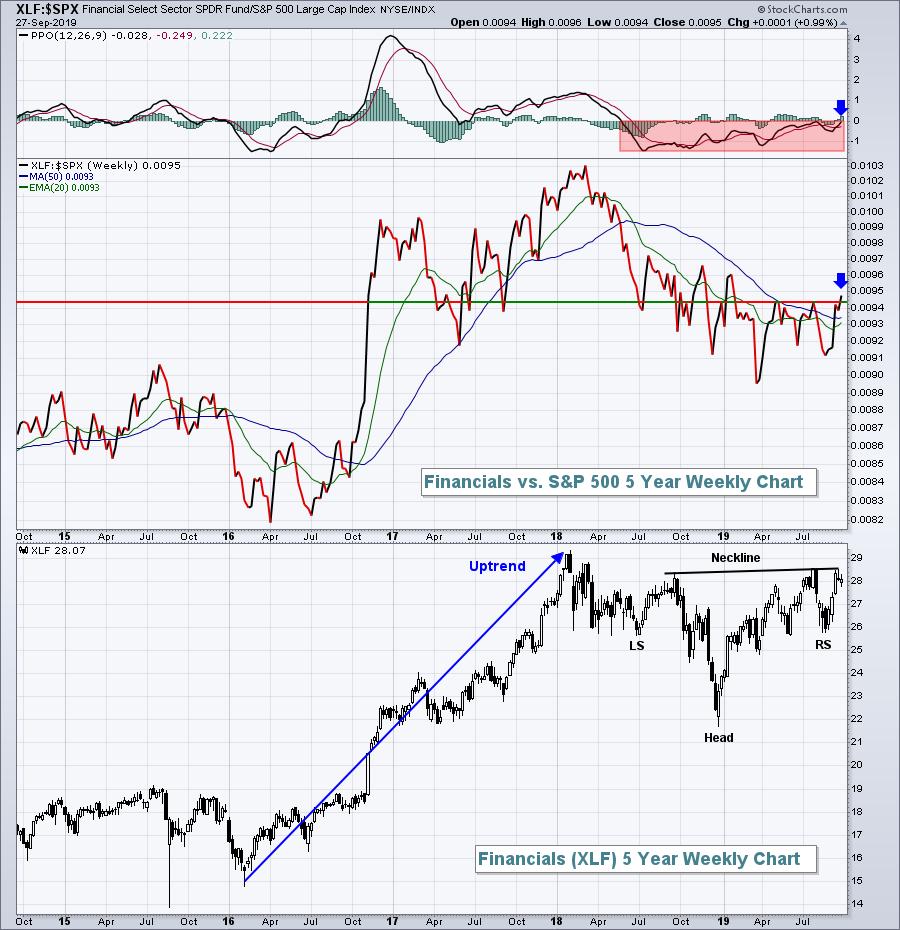
Financials Are About To Do Something They Haven't Done In Nearly 18 Months

by Tom Bowley,
Chief Market Strategist, EarningsBeats.com
Financials (XLF) had been rather dormant for nearly 18 months - at least on a relative basis to the S&P 500 - but that is all about to change. While the group is certainly beginning to flex its collective muscle, the real confirming signal would likely be a...
READ MORE
MEMBERS ONLY
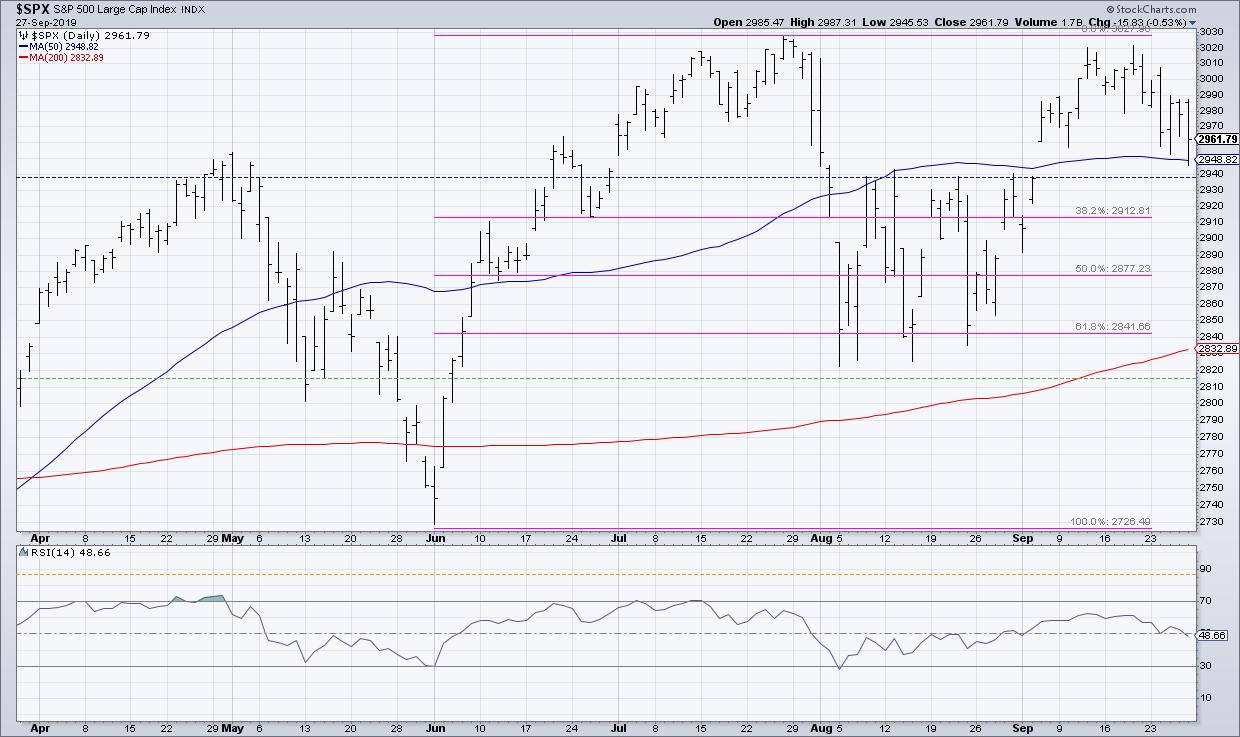
Three Reasons Why Resistance Works

by David Keller,
President and Chief Strategist, Sierra Alpha Research
Recently, a reader responded to one of my articles on the S&P 500 and asked about the value of support and resistance levels on a broad market index. He explained that support and resistance seems to make sense for individual stocks, as they're based on people&...
READ MORE
MEMBERS ONLY

DP Daily Diamonds - Real Estate Continues to Perform on Scans

by Erin Swenlin,
Vice President, DecisionPoint.com
My bullish scans continue to provide a small amount of results. Today, the Diamond Scan revealed 11 results, which is down from the 18 I had yesterday. The Diamond Dog Scan continues to produce numerous shorts. Today, there were 138, which is up from 119 yesterday. I decided I wanted...
READ MORE
MEMBERS ONLY
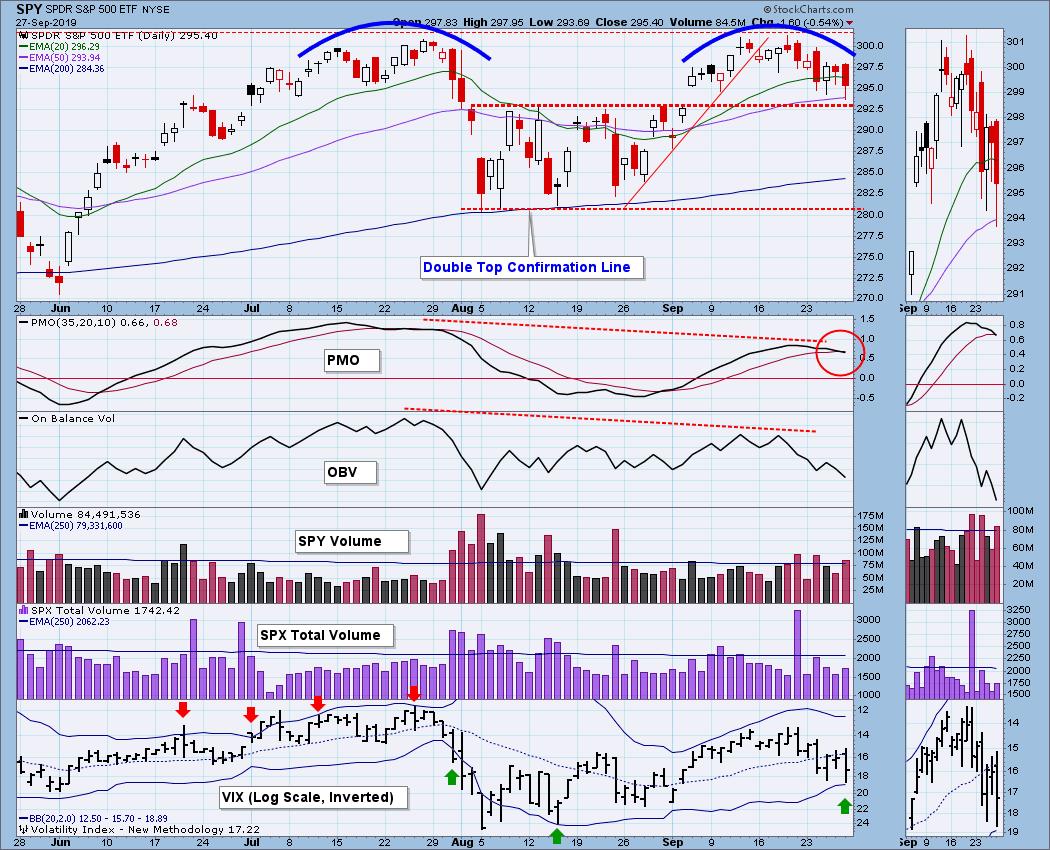
DP WEEKLY WRAP: A Test of Support Is Coming, Then Maybe Some Downside

by Carl Swenlin,
President and Founder, DecisionPoint.com
The July and September price tops are virtually identical, so I am assuming that a double top is in progress; however, it won't be a official double top until price drops below the confirmation line. That is a bit long to wait before taking appropriate action, so I...
READ MORE
MEMBERS ONLY
What's Happening with Last Week's Three Featured Charts

by Martin Pring,
President, Pring Research
Editor's Note: This article was originally published in Martin Pring's Market Roundup on Friday, September 27th at 1:25pm ET.
Last week, I wrote that the short-term technical picture looked positive, but that I was watching three charts which would confirm a significant extension to the...
READ MORE
MEMBERS ONLY

HEAVY SELLING IN COMMUNICATION AND TECHNOLOGY STOCKS PUSH NASDAQ SHARPLY LOWER -- INTERNET AND SEMICONDUCTORS LEAD THE SELLING -- SO DO CHINESE STOCKS ON THREAT OF DE-LISTING

by John Murphy,
Chief Technical Analyst, StockCharts.com
NASDAQ COMPOSITE FALLS FURTHER BELOW ITS 50-DAY LINE... Chart 1 shows the Nasdaq Composite falling sharply today and moving further below its 50-day moving average. Selling in software and semiconductors are leading the decline in the technology sector. Communication stocks are also having a bad day. Chart 2 shows the...
READ MORE
MEMBERS ONLY

Using Relative Rotation Graphs For "Overwatch" On International Stock Markets.

by Julius de Kempenaer,
Senior Technical Analyst, StockCharts.com
From time to time, you come across new or different ways to look at things or describe them. In my RRG blog from Tuesday, I introduced the concept of military overwatch tactics and compared them to Relative Rotation Graphs.
Since the public launch of Relative Rotation Graphs in 2011 on...
READ MORE
MEMBERS ONLY

Last Week, Three Charts Failed To Break To The Upside. Where Do We Go From Here?
by Martin Pring,
President, Pring Research
* What's Happening with Last Week's Three Featured Charts
* Short-Term Oscillators
* Longer-Term Indicators are Mostly Bullish
Last week, I wrote that the short-term technical picture looked positive, but that I was watching three charts which would confirm a significant extension to the bull market in the event...
READ MORE
MEMBERS ONLY

The State of the Stock Market - Concerns Versus Evidence

by Arthur Hill,
Chief Technical Strategist, TrendInvestorPro.com
This weekly commentary, featuring the S&P 500, Index Breadth Model and Sector Breadth Model, is designed to provide an unbiased view of the current stock market environment. Models, while not perfect, provide a clear process driven approach for evaluating the market. Focusing on present signals, instead of future...
READ MORE
MEMBERS ONLY
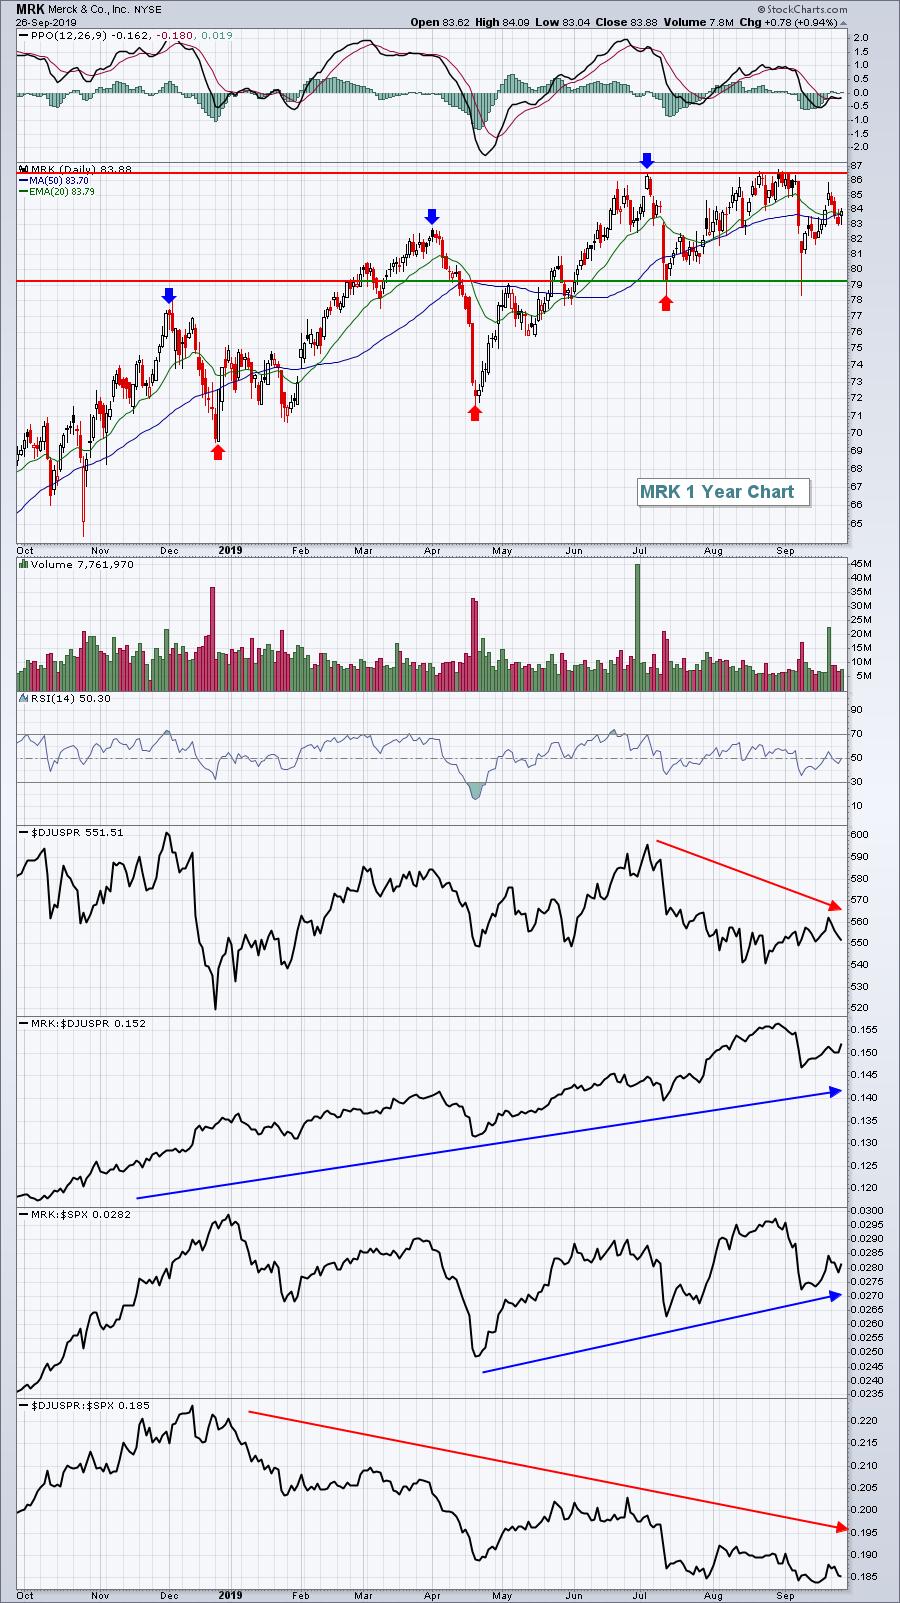
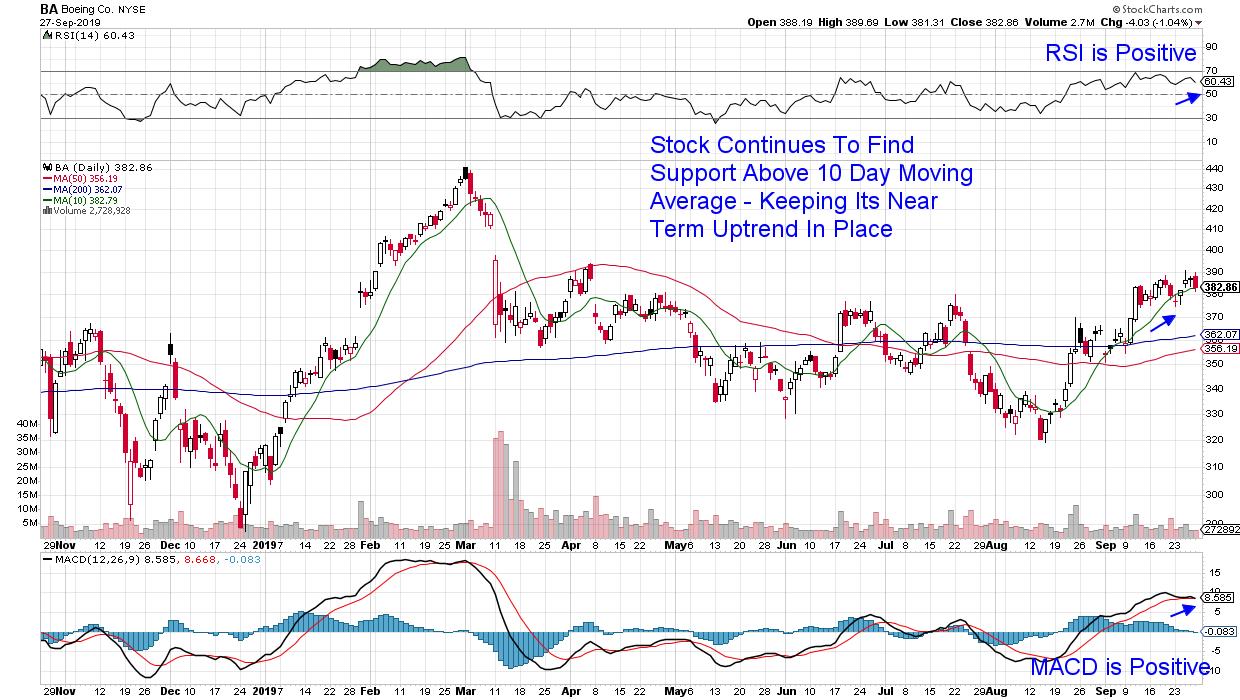
This Pharma Stands Above (Most Of) The Crowd
by Tom Bowley,
Chief Market Strategist, EarningsBeats.com
Pharmaceuticals ($DJUSPR) have definitely been an area to avoid in 2019, which is somewhat surprising when you consider how effective many defensive areas have been this year. Still, with the S&P 500 up roughly 18% year-to-date, the DJUSPR has actually fallen 2 points from 553 to 551, clearly...
READ MORE
MEMBERS ONLY
DP Daily Diamonds - Pink Line Scan Interesting Finds
by Erin Swenlin,
Vice President, DecisionPoint.com
The bullish results for my scans are thinning quite a bit. Today, the Diamond Scan produced 18 results while the Diamond Dog Scan produced 119. That's a small increase for the bulls (+8) and a slight decrease (-16) for bears. However, I got 16 results from the WealthWise...
READ MORE
MEMBERS ONLY

ETF Ranking and Grouping - Staples and Utes Leading, while Software and Biotech Looking Vulnerable
by Arthur Hill,
Chief Technical Strategist, TrendInvestorPro.com
Today's report will rank and group my core ETF universe from strong uptrends to clear downtrends. Most of these ETFs are stock ETFs, but I also include several bond-related ETFs and a few commodity ETFs in my universe.
The defensive groups continue to dominate with consumer staples, utilities...
READ MORE
MEMBERS ONLY
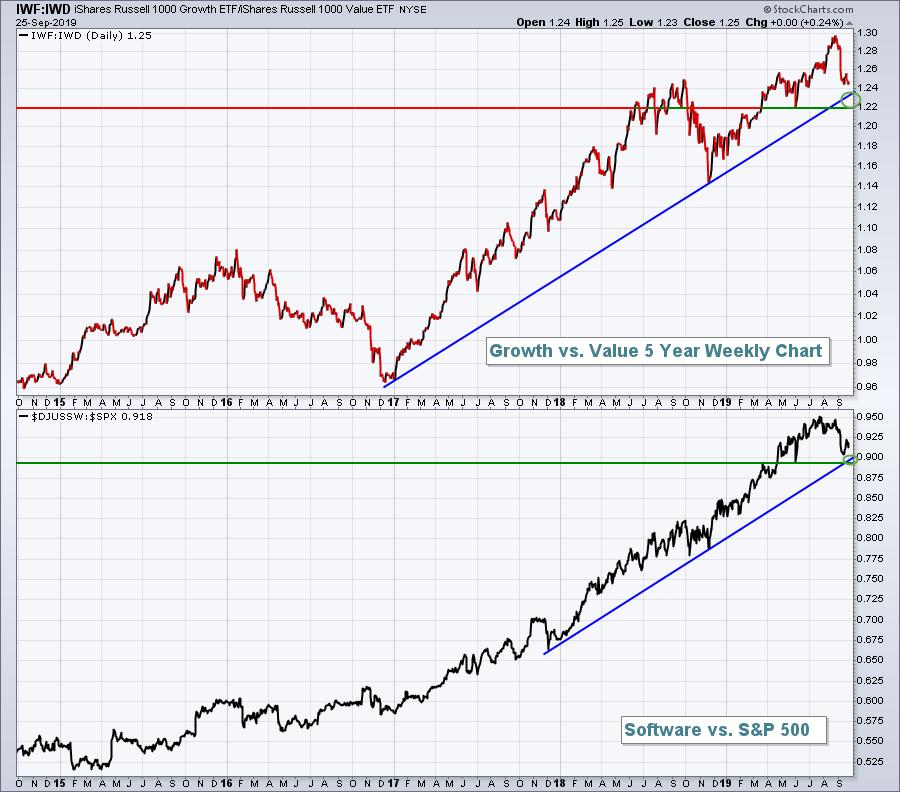
Major Reversal In Software Offers Encouraging Sign
by Tom Bowley,
Chief Market Strategist, EarningsBeats.com
I've been watching and waiting to see if software ($DJUSSW) would begin to show leadership again as we approach earnings season, which will kick off in the next few weeks. If you've owned any software stocks other than Microsoft (MSFT), then you probably know all too...
READ MORE
MEMBERS ONLY
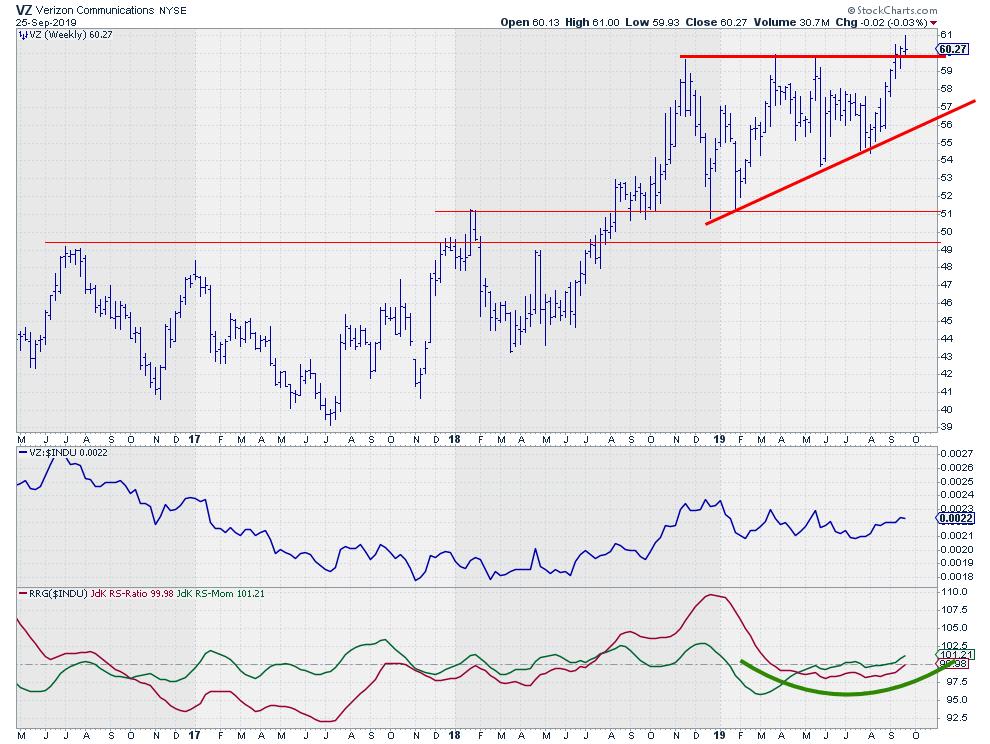
VZ Calling Home?
by Julius de Kempenaer,
Senior Technical Analyst, StockCharts.com
On the weekly Relative Rotation Graph holding the Dow 30 stocks, we can see Verizon (VZ) shooting from the improving quadrant towards leading.
The RRG below shows VZ in isolation. It is hard to see as the move went very fast, but, since mid-July, VZ has completed a rotation from...
READ MORE
MEMBERS ONLY
DP Daily Diamonds - Heavy Utilities
by Erin Swenlin,
Vice President, DecisionPoint.com
The bullish results for my scans are thinning quite a bit. Today, the Diamond Scan produced 10 results while the Diamond Dog Scan produced 135. The market is weak and, consequently, the pockets of strength tend to be in the defensive sectors. For today's piece, I have three...
READ MORE
MEMBERS ONLY

DP Alert Mid-Week - NDX New PMO SELL Signal - Gold Head & Shoulders?
by Erin Swenlin,
Vice President, DecisionPoint.com
Technology has continued to underperform the SPX, so it shouldn't surprise anyone that a Price Momentum Oscillator (PMO) SELL signal triggered on the NDX. The chart is below the Scoreboards. Gold topped today, with it now looking like a possible head-and-shoulders reversal pattern. Meanwhile, the Dollar meanders in...
READ MORE
MEMBERS ONLY

STOCKS REGAIN MOST OF YESTERDAY'S LOSSES -- MOVING AVERAGES HOLD FOR DOW AND S&P 500 -- NASDAQ REGAINS 50-DAY LINE -- SMALL CAPS AND TRANSPORTS ALSO BOUNCE OFF MOVING AVERAGE SUPPORT -- JUMP IN BOND YIELDS HELPED LIFT BANKS
by John Murphy,
Chief Technical Analyst, StockCharts.com
DOW AND SPX HOLD SUPPORT...NASDAQ REGAINS BLUE LINE...Stocks regained most of the previous day's losses. Chart 1 shows the Dow Industrials bouncing off their 20-day average. Chart 2 shows the S&P 500 holding support at its 50-day line. The Nasdaq turned in an even...
READ MORE
MEMBERS ONLY
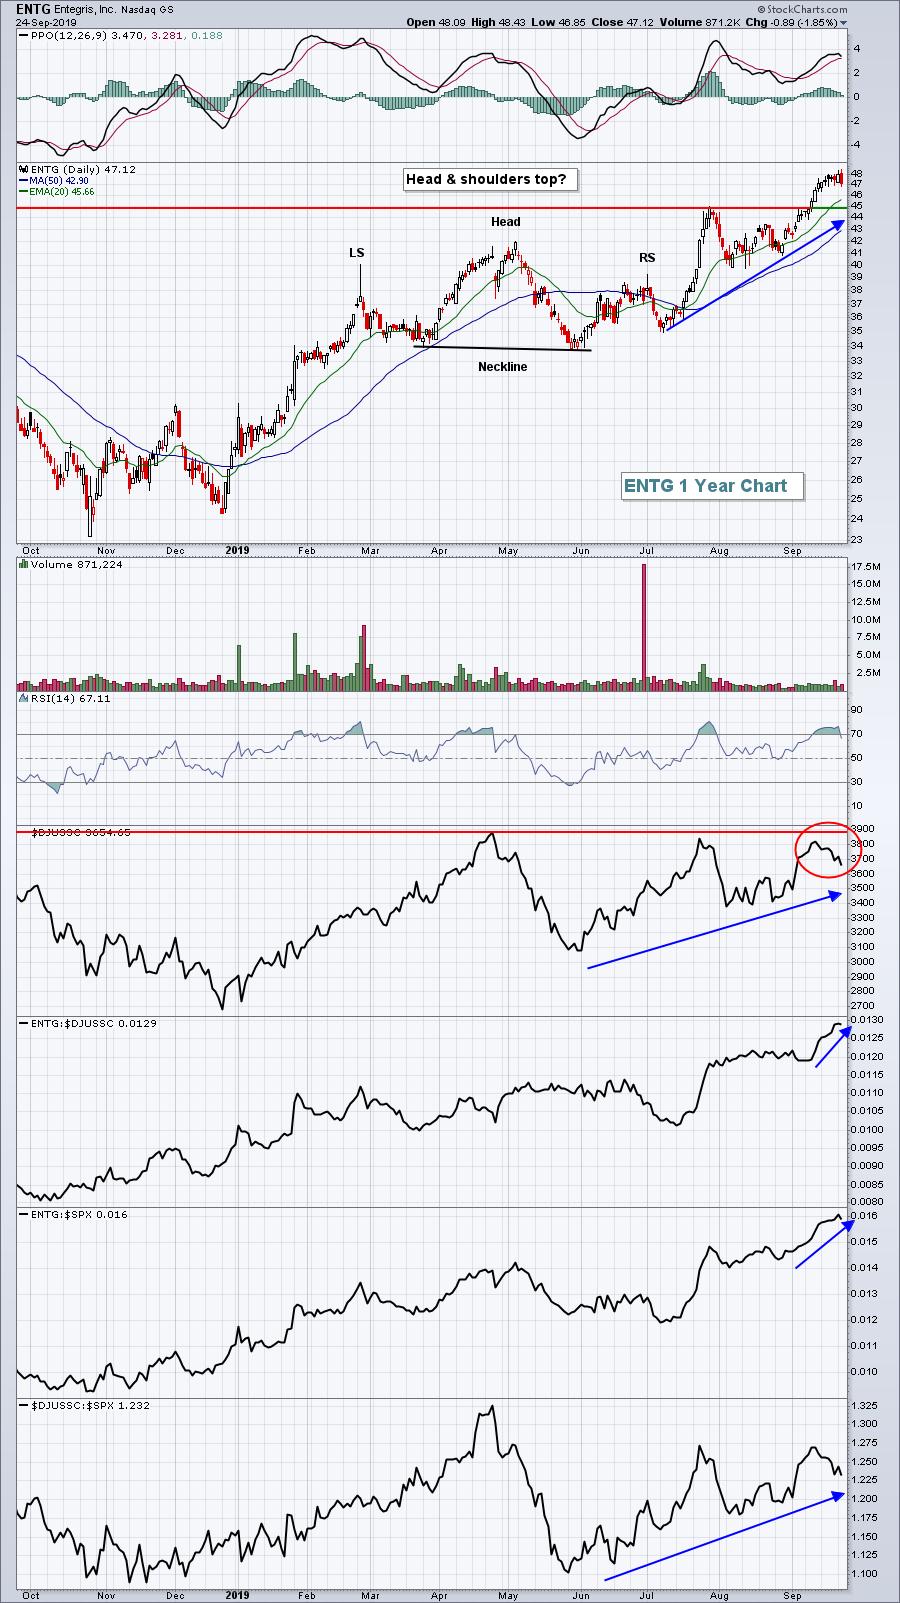
This Mid Cap Might Be The Best Semiconductor Stock
by Tom Bowley,
Chief Market Strategist, EarningsBeats.com
Semiconductors ($DJUSSC, -1.78%) had a rough session on Tuesday, but they had been on a roll since early-August, rising from 3350 to 3850, and there have been plenty of leaders to choose from. KLA Corp (KLAC), Lam Research (LRCX), Applied Materials (AMAT), and Micron Technology (MU) are certainly among...
READ MORE
MEMBERS ONLY

There May be Trouble Ahead - SPY, QQQ and IWM Update
by Arthur Hill,
Chief Technical Strategist, TrendInvestorPro.com
My headlines are often inspired by tunes, and this one is a classic going back to 1936 and Fred Astaire. No, I am not old enough to have seen it live on TV, but I've heard plenty of remakes. Even though there may be trouble ahead, I am...
READ MORE
MEMBERS ONLY
DP Daily Diamonds - Shorting Opportunities
by Erin Swenlin,
Vice President, DecisionPoint.com
When going through my Diamond scans, I realized that the bearish scan was searching on a larger domain than the bullish scan, so I adjusted it. But the bearish scan is still showing many more results. Diamond PMO Scan (bullish) versus the Diamond Dogs PMO Scan (bearish) showed an increase...
READ MORE
MEMBERS ONLY

STOCKS UNDERGO MORE SELLING -- NASDAQ CLOSES BELOW 50-DAY AVERAGE -- DROP IN BOND YIELDS PUSHES UTILITIES TO NEW RECORD WHILE BANK STOCKS WEAKEN -- WEAKEST SECTORS ARE ENERGY, COMMUNICATIONS, CONSUMER CYCLICALS, AND TECHNOLOGY
by John Murphy,
Chief Technical Analyst, StockCharts.com
STOCK INDEXES LOSE MORE GROUND...Majorstock indexes moved further away from their July peak today and some short-term chart damage was done, especially in the Nasdaq market. Chart 1 shows the Dow Jones Industrial Average losing -142 points (-0.53%) and ending right on its 20-day average (green line); its...
READ MORE
MEMBERS ONLY
3 Key Industry Groups Nearing Breakouts
by Tom Bowley,
Chief Market Strategist, EarningsBeats.com
The S&P 500 is slightly more than 1% away from setting a new all-time high close and there are several areas of the market I'm watching closely to evaluate leadership in the next leg of this bull market. I'm going to ignore renewable energy...
READ MORE
MEMBERS ONLY
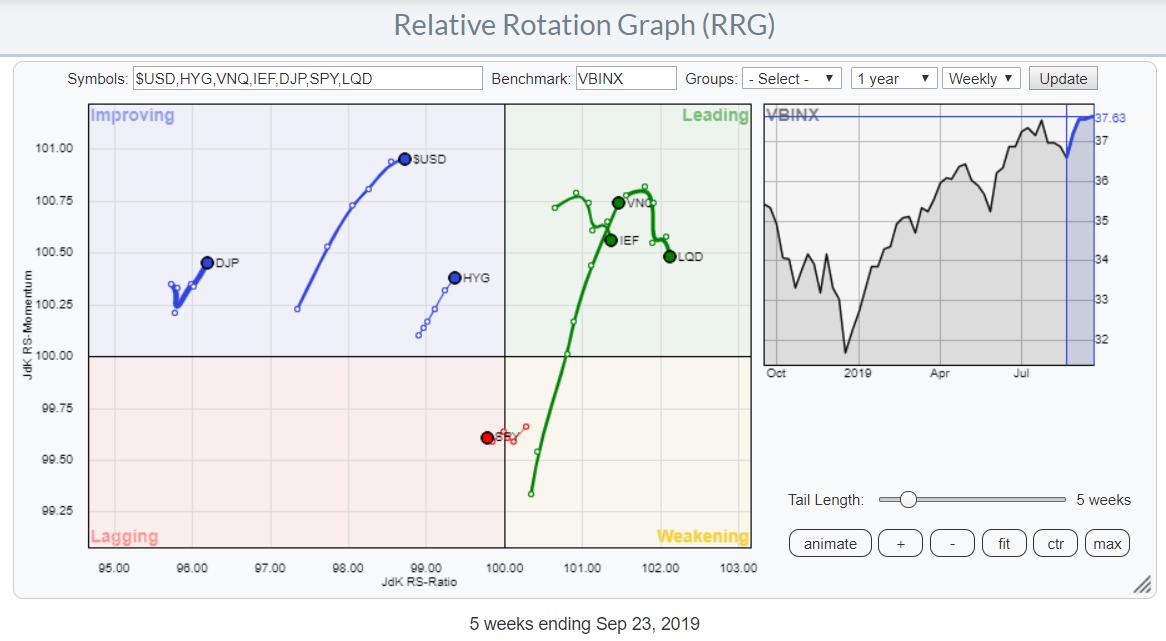
A Strong Overwatch Unit is Mission Critical
by Julius de Kempenaer,
Senior Technical Analyst, StockCharts.com
From time to time, you come across new or different ways to look at things or describe them.
Since the public launch of Relative Rotation Graphs in 2011 on Bloomberg terminals, we have been using the tag-line "RRG provides you with the BIG picture in ONE picture" as...
READ MORE
MEMBERS ONLY
DP Daily Diamonds - Mostly Defensive Plays
by Erin Swenlin,
Vice President, DecisionPoint.com
Today, I ran my Diamond PMO Scan (bullish) as well as my Diamond Dogs PMO Scan (bearish) and found they are the inverse of each other. Essentially, they shave the strong momentum performers off the top and scrape the bottom for the dogs. Today, we saw 23 bullish stocks versus...
READ MORE
MEMBERS ONLY
TREND model - Introduction

by Greg Morris,
Veteran Technical Analyst, Investor, and Author
As I have stated a number of times, I have used a rules-based trend following model to manage money since 1996. I have found this to be the best approach to investing long-term, as it has the ability to provide above-average compounded returns over time with far less volatility and...
READ MORE
MEMBERS ONLY
Uncovering The Deception On Wall Street - Webinar Recording Available
by Tom Bowley,
Chief Market Strategist, EarningsBeats.com
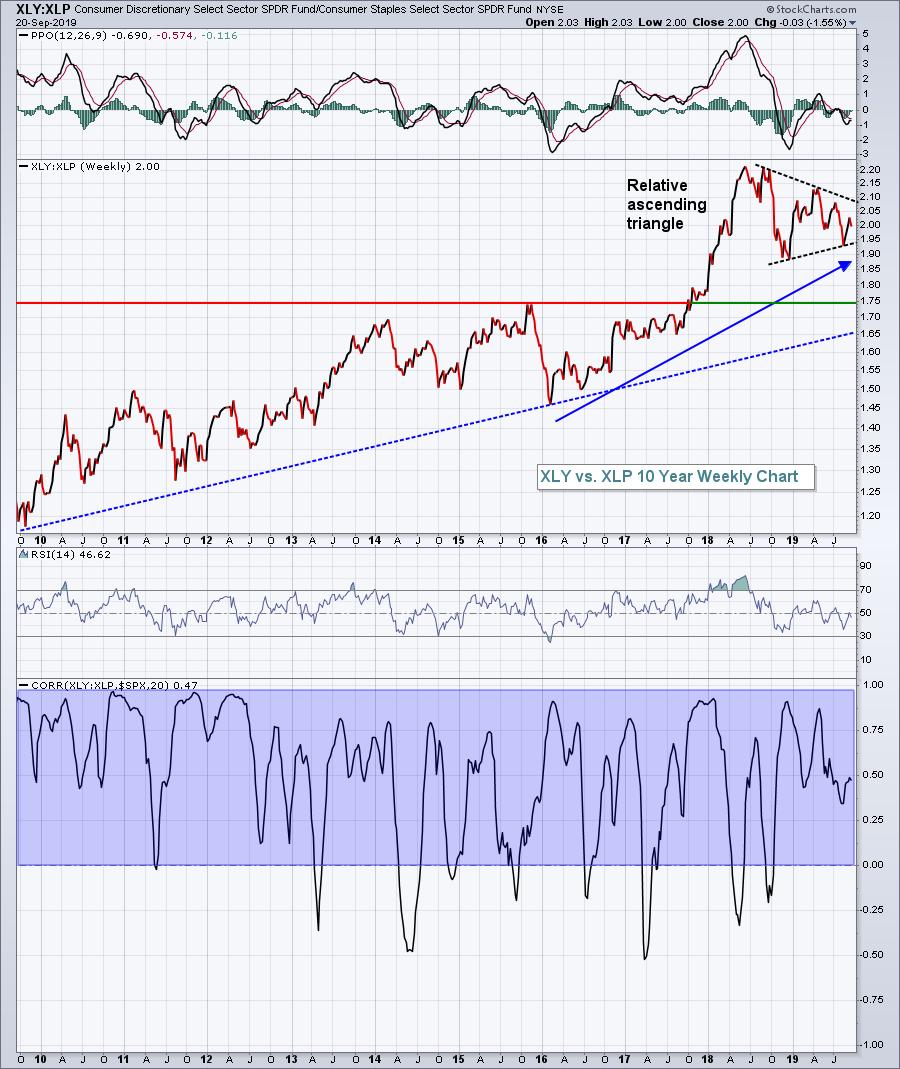
Well, I have to admit, I'm always watching this first chart. It's how consumer stocks are performing vs. one another. When consumer discretionary stocks (XLY) are outperforming consumer staples stocks (XLP) over time, I'm generally very bullish U.S. equities. Consumer spending comprises roughly...
READ MORE
MEMBERS ONLY

Meg-Oil

by Bruce Fraser,
Industry-leading "Wyckoffian"
The plot of the B-Movie ‘The Meg' is the discovery of a living prehistoric shark the Megalodon. This movie shark was so big (the actual prehistoric Meg could reach 59 feet in length) that it could swallow ‘Jaws' whole. Megalodon is similar in size to the current crude...
READ MORE
MEMBERS ONLY

STOCK INDEXES STALL NEAR SUMMER HIGH -- A LOT OF OVERHEAD RESISTANCE LEVELS ARE BEING TESTED -- TRANSPORTS AND SMALL CAPS BACK OFF ALONG WITH FINANCIALS -- SAFE HAVENS TAKE BACK THE LEAD AS BOND YIELDS DROP -- CONSUMER CYCLICALS ARE WEAKEST SECTOR
by John Murphy,
Chief Technical Analyst, StockCharts.com
STOCK INDEXES STALL NEAR JULY HIGH...Stocks ended the week with minor losses after meeting some resistance along their July high. Chart 1 shows the Dow Industrials consolidating just below their summer high, but remaining well above chart support and moving average lines. Chart 2 shows the S&P...
READ MORE
MEMBERS ONLY

Friday Wasn't Selling, It Was Manipulation
by Tom Bowley,
Chief Market Strategist, EarningsBeats.com
I've seen it so, so many times. The stock market is strong, trending higher and the bottom drops out. Ever heard of "buy on rumor, sell on news"? That was partly responsible for the end of week selling. The Fed's policy statement on Wednesday...
READ MORE
MEMBERS ONLY
A Weekly Special Note: Cooling Off Likely; Remain Selective A Vertical Rise May Make Risk-Reward Skewed

by Milan Vaishnav,
Founder and Technical Analyst, EquityResearch.asia and ChartWizard.ae
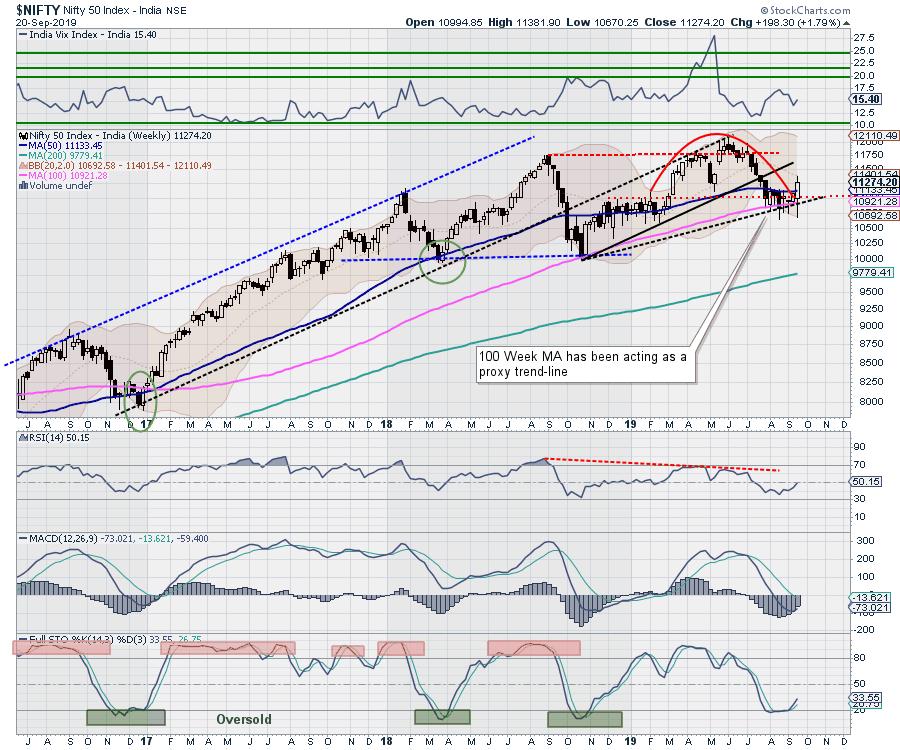
In a week that turned dramatic on the last day, the markets that were over 3% down through the week pulled into positive territory in one single session. On Friday, the headline index saw its highest-ever single-day gain, ending 5.32% higher. The pronounced shift in the trend came in...
READ MORE
MEMBERS ONLY

What to Watch Next Week in the Major Index ETFs - SPY, QQQ, IWM
by Arthur Hill,
Chief Technical Strategist, TrendInvestorPro.com
Normally I ignore resistance levels in uptrends and support levels in downtrends. Resistance levels are not that important because higher highs are expected in an uptrend. The assumption is that a trend in motion stays in motion so a break above the prior peak is considered normal. Support levels, on...
READ MORE
MEMBERS ONLY
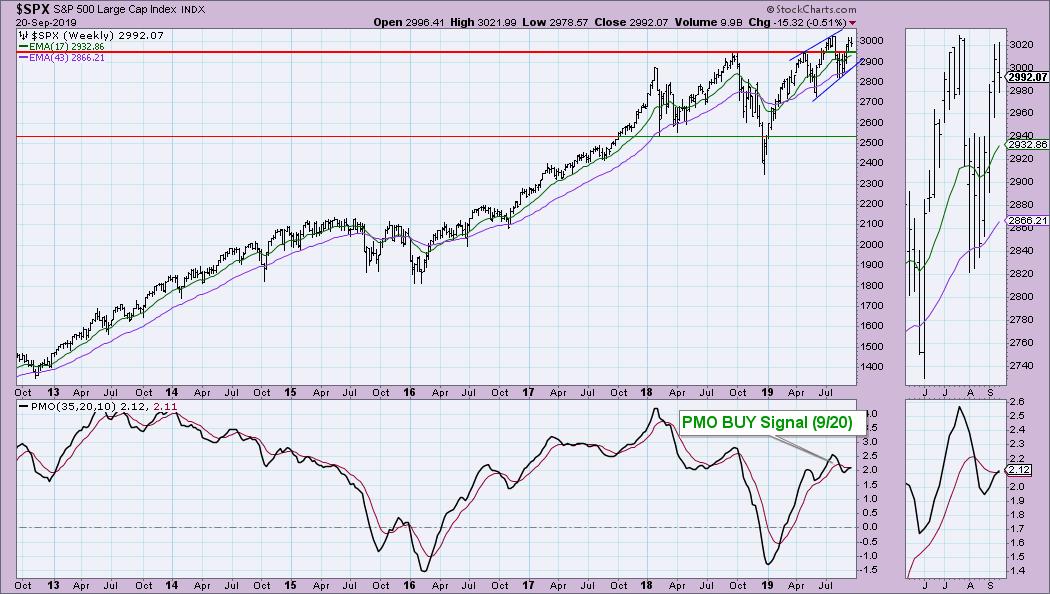
Cash Is King Right Now; Join Us TODAY For A Big Event

by John Hopkins,
President and Co-founder, EarningsBeats.com
Technically, it makes sense to lessen stock exposure any time a major price resistance level is challenged. The all-time high close on the S&P 500 is 3025.86, set on July 26, 2019. On Thursday, the S&P 500 hit 3021.99, less than 4 points from...
READ MORE
MEMBERS ONLY
DP Daily Diamonds - Market Weakness Merits "Flawed Diamonds" Shorts
by Erin Swenlin,
Vice President, DecisionPoint.com
Like yesterday, I ran my bullish PMO scan followed by the "inverse" Scan for Dogs. Yesterday, the results were 19 and 70, respectively. Today, I had only 11 bullish candidates and 111 bearish candidates. It seemed that it would be better to look at shorting opportunities. Yesterday, I...
READ MORE
MEMBERS ONLY

Enlightened, Engaged, and Impressed: A Recap of the 2019 TSAA Conference
by David Keller,
President and Chief Strategist, Sierra Alpha Research
I've been using technical analysis professionally for almost twenty years now. Though I have learned a great deal from putting the technical toolkit into action, some of my favorite learning experiences have come from attending industry conferences. Not only do you get to hear presentations from knowledgeable experts,...
READ MORE
MEMBERS ONLY
DP WEEKLY WRAP: Fading New Highs Spell Trouble
by Carl Swenlin,
President and Founder, DecisionPoint.com
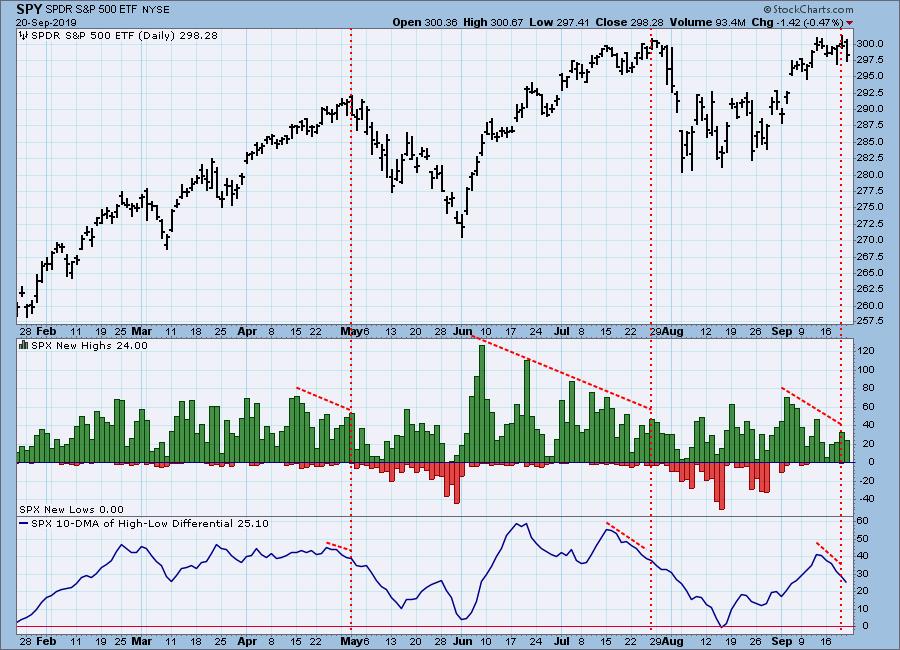
While SPY made another all-time intraday high on Thursday, the number of S&P 500 component New Highs continued to contract from the level they had reached earlier this month. This kind of activity should be taken as a warning flag, increasing our expectation of a price top. Also...
READ MORE
MEMBERS ONLY
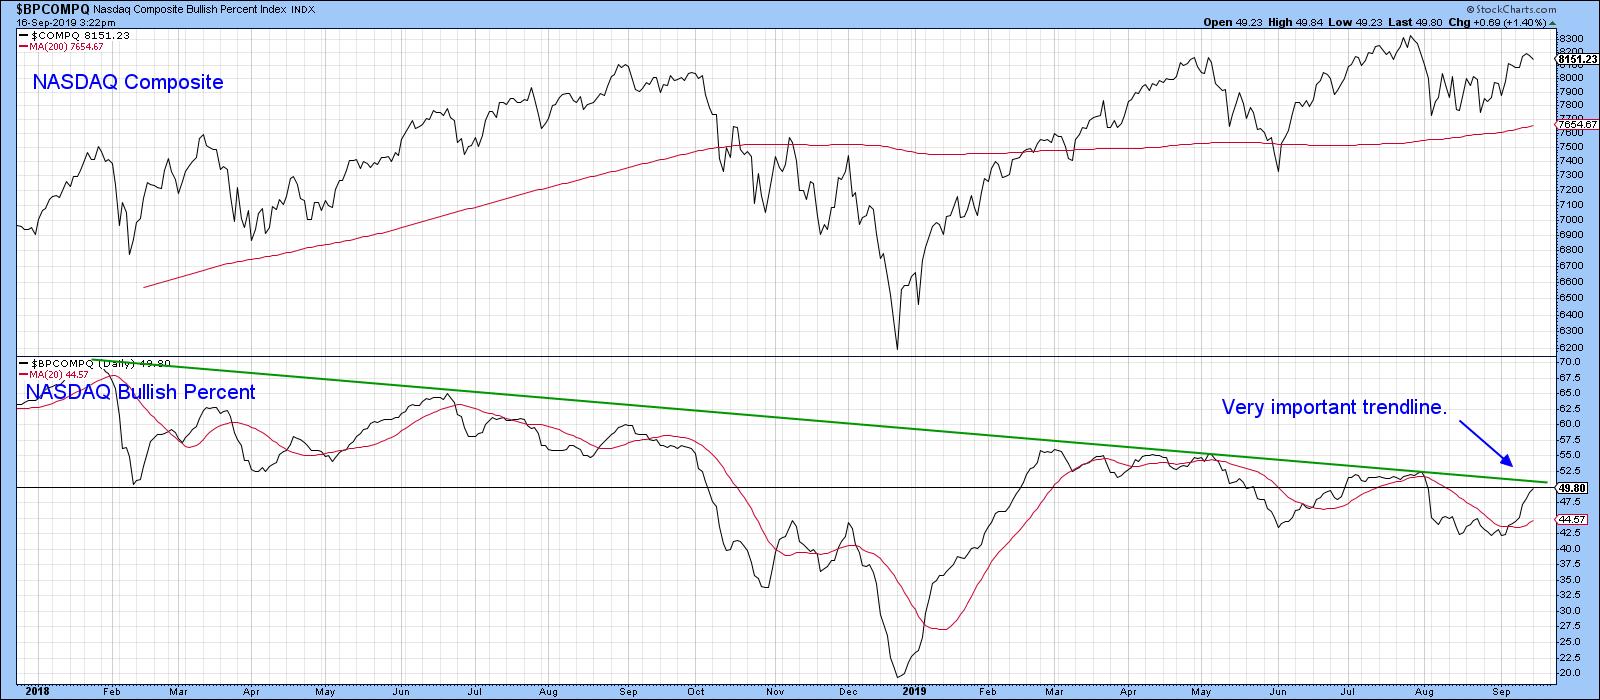
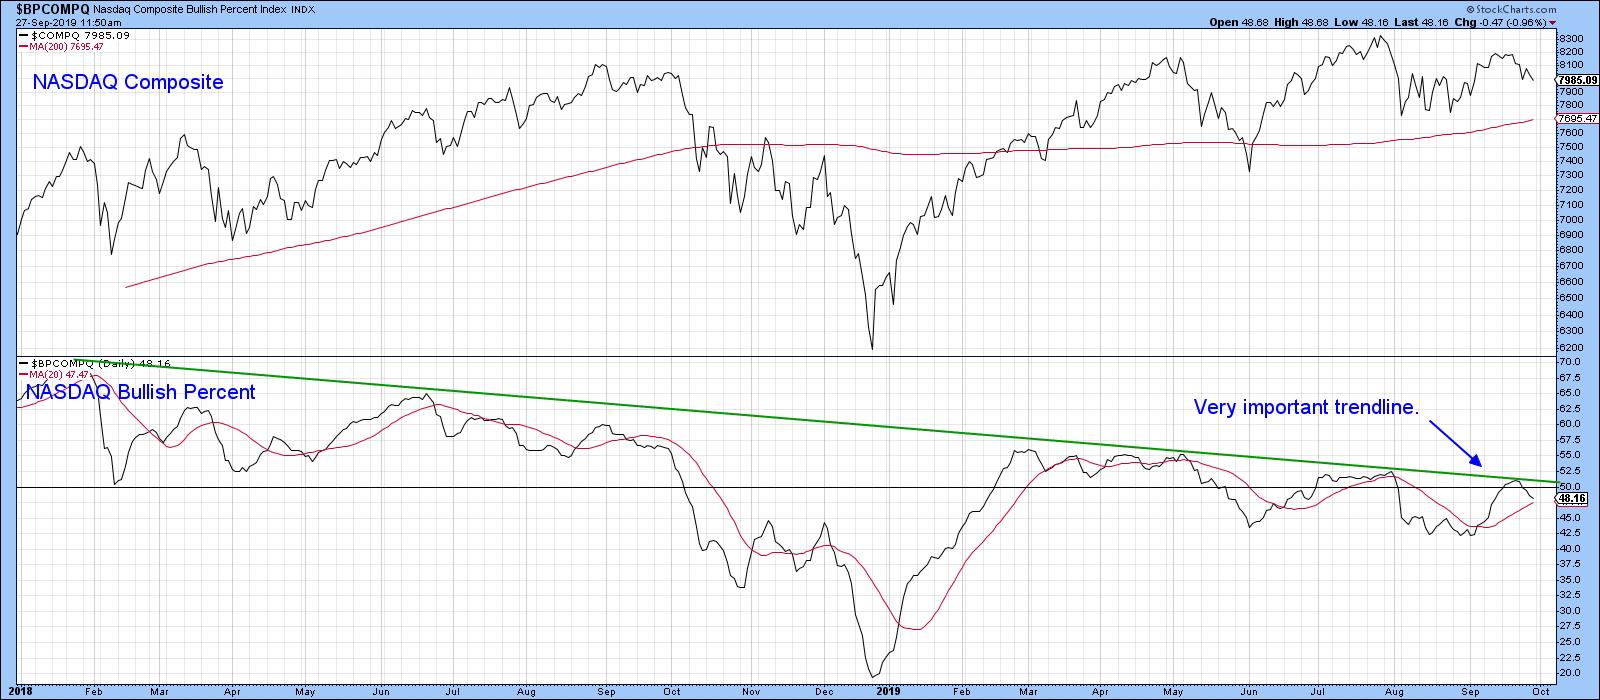
Three Charts That Could Signal a Significant Extension to the Equity Rally
by Martin Pring,
President, Pring Research
Editor's Note: This article was originally published in Martin Pring's Market Roundup on Monday, September 16th at 6:04pm ET.
First of all, Chart 4 features the NASDAQ bullish percentage. You can see how it has been gradually working its way lower since early 2018, having...
READ MORE
MEMBERS ONLY

The Crisis of Complexity: A Solution

by Gatis Roze,
Author, "Tensile Trading"
Here's an important lesson I've learned. I'll call it the "crisis of complexity". There is something about most investors that makes them have an insatiable appetite for complexity. In reality, complexity is not the hoped-for portfolio accelerator — it is instead the detonator....
READ MORE
MEMBERS ONLY
SPX and OEX Log Intermediate-Term BUY Signals, But NDX IT Momentum Moves South
by Erin Swenlin,
Vice President, DecisionPoint.com
After challenging the all-time highs, the market has continued to chop along. In spite of a lackluster few weeks, the weekly Price Momentum Oscillator (PMO) managed to cross above its signal line on both the SPX and OEX, while the Dow is just about there. The surprise to me was...
READ MORE
MEMBERS ONLY

Capturing Mean-Reversion Signals and Trend Direction with One Indicator - Facebook Example
by Arthur Hill,
Chief Technical Strategist, TrendInvestorPro.com
Mean-reversion signals provide a great way to trade in the direction of the bigger uptrend after a pullback. The trick is to identify the bigger uptrend and then capture mean-reversion setups. Mean-reversion setups materialize after a pullback within the uptrend. The strategy is based on the assumption that prices will...
READ MORE