MEMBERS ONLY

The SCTR Report: Why PLTR Stock Remains a Top Contender in a Volatile Market

by Karl Montevirgen,
The StockCharts Insider
KEY TAKEAWAYS
* PLTR stock dropped sharply in February 2025 but rebounded in April, thanks to easing trade tensions and new government contracts.
* RSI and Accumulation/Distribution Line (ADL) suggest bullish momentum, but valuations remain stretched.
* Watch the May 5 earnings report and geopolitical developments for PLTR stock's next...
READ MORE
MEMBERS ONLY

Ready To Level Up Your Options Trading?

by Tony Zhang,
Chief Strategist, OptionsPlay
Grow your trading account using proven options strategies, right from your StockCharts ChartLists, with the help of this powerful educational webinar!
In this session, Tony Zhang, Chief Strategist of OptionsPlay, will show you how to:
* Scan your ChartLists for top-performing trade setups
* Identify income-generating and directional opportunities
* Use OptionPlay'...
READ MORE
MEMBERS ONLY

Big Tech, Big Data, Big Moves: Why This Week Could Be a Market Game-Changer

by Jayanthi Gopalakrishnan,
Director of Site Content, StockCharts.com
KEY TAKEAWAYS
* The stock market is holding steady after last week's bounce, but remains hesitant.
* Big tech earnings and economic data are the focus this week.
* Sector rotation indicates that investors are shifting to defensive mode.
Speaking overall, the stock market hasn't changed course after last...
READ MORE
MEMBERS ONLY

Personalized Options Trading Strategies: Discover High-Yield Covered Calls and Spreads with the OptionsPlay Add-On
by Tony Zhang,
Chief Strategist, OptionsPlay
KEY TAKEAWAYS
* OptionsPlay now integrates with your StockCharts ChartLists.
* Focus on only the most promising setups tailored to your directional bias and risk tolerance.
* Make faster, smarter, and personalized trading decisions with the OptionsPlay Add-On.
If you've been exploring ways to take your options trading to the next...
READ MORE
MEMBERS ONLY
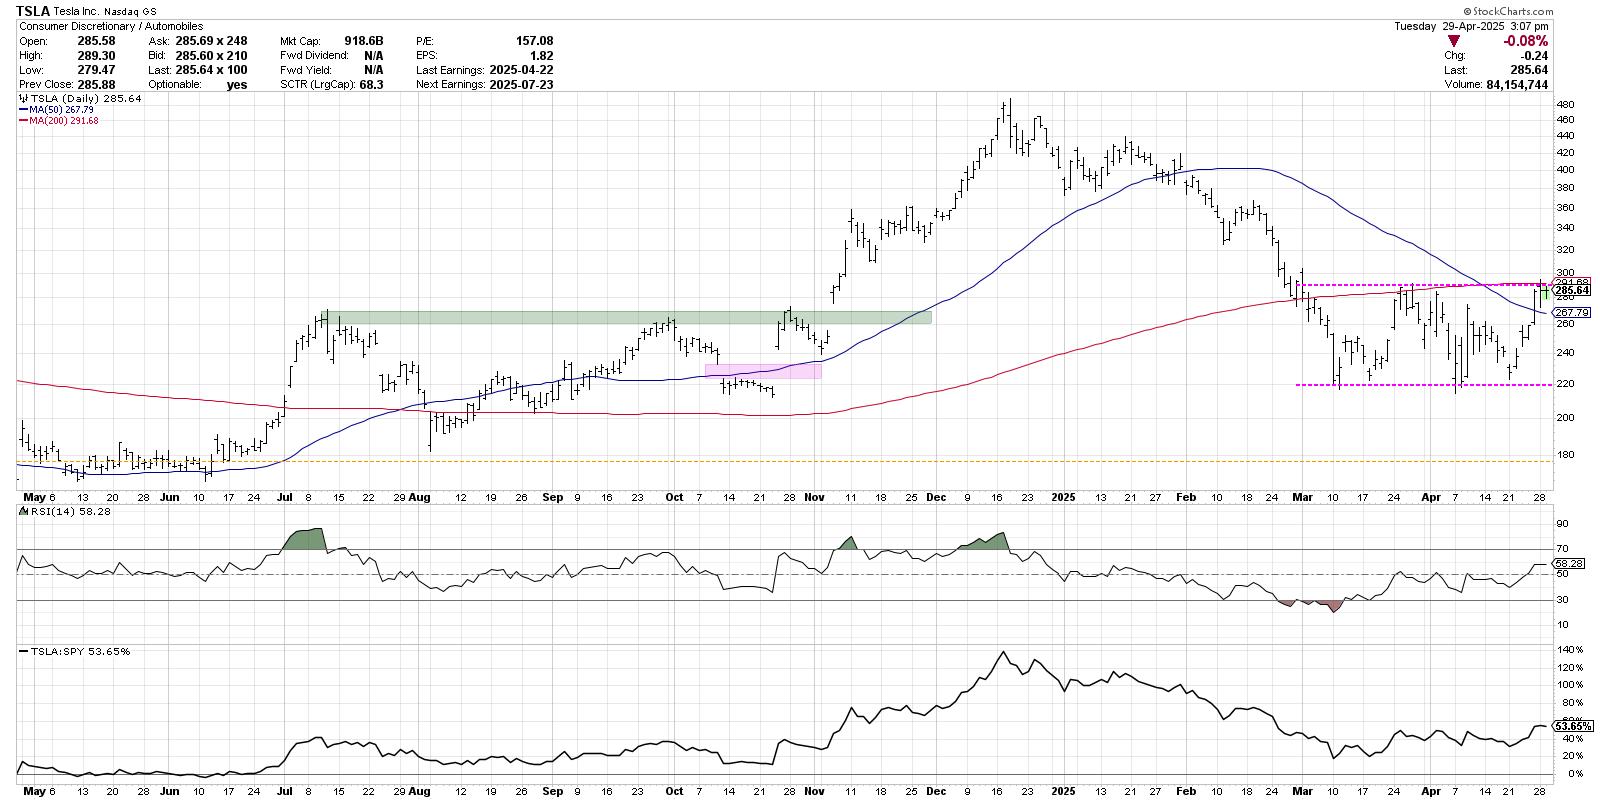
Tesla: The Breakout to Bolster the Bulls

by David Keller,
President and Chief Strategist, Sierra Alpha Research
KEY TAKEAWAYS
* An absence of strong momentum tells us to be patient and wait for a better entry point on the chart.
* Momentum indicators like RSI can help us define the trend phase and better identify when buyers are taking control.
* A breakout above $290 could indicate a new accumulation...
READ MORE
MEMBERS ONLY

Our Very Last Trading Room

by Erin Swenlin,
Vice President, DecisionPoint.com
Today, Carl and Erin made a big announcement! They are retiring at the end of June so today was the last free DecisionPoint Trading Room. It has been our pleasure educating you over the years and your participation in the trading room has been fantastic! Be sure and sign up...
READ MORE
MEMBERS ONLY

The Best Five Sectors, #17

by Julius de Kempenaer,
Senior Technical Analyst, StockCharts.com
KEY TAKEAWAYS
* Defensive sectors maintain dominance in top 5, despite strong market performance.
* Real Estate enters top 5, replacing Health Care; Consumer Staples, Utilities, and Financials remain stable in top 3 positions.
* Defensive positioning has put a dent in portfolio performance after strong week.
Real Estate and Healthcare Swapping Positions...
READ MORE
MEMBERS ONLY

Zweig Breadth Thrust Dominates the Headlines - But What about an Exit Strategy?

by Arthur Hill,
Chief Technical Strategist, TrendInvestorPro.com
KEY TAKEAWAYS
* S&P 1500 Advance-Decline Percent triggered a Zweig Breadth Thrust this week.
* These signals reflect a sudden and sharp shift in participation (net advancing percent).
* ZBT signals only cover the entry, which means chartists need to consider an exit strategy should it fail.
The Zweig Breadth Thrust...
READ MORE
MEMBERS ONLY

Week Ahead: RRG Indicates Sector Shifts; NIFTY Deals With These Crucial Levels

by Milan Vaishnav,
Founder and Technical Analyst, EquityResearch.asia and ChartWizard.ae
After a strong move the week before, the markets took on a more consolidatory look over the past five sessions. Following ranged moves, the Nifty closed the week on just a modestly positive note. From a technical standpoint, the Nifty tested a few important levels on both daily and weekly...
READ MORE
MEMBERS ONLY

Top Stock Areas After the Rally: What Smart Money Is Buying

by Mary Ellen McGonagle,
President, MEM Investment Research
In this video, after last week's sharp market rally, Mary Ellen breaks down where the markets stand now, which leading sectors are showing the most strength, and how to recognize if your stocks are entering a new uptrend. Get expert insights on market leadership, sector rotation, and key...
READ MORE
MEMBERS ONLY

Navigate Market Shifts Like a Pro: Utilize This Key Indicator Effectively
by Jayanthi Gopalakrishnan,
Director of Site Content, StockCharts.com
KEY TAKEAWAYS
* Market breadth indicators are flashing a bullish signal.
* Sector rotation is favoring risk-on investing.
* The Zweig Breadth Thrust triggered a signal, indicating a reversal from bearish to bullish conditions.
After weeks of uncertainty, the stock market finally gave us something to smile about. The major indexes just wrapped...
READ MORE
MEMBERS ONLY

S&P 500 Rises from Bearish to Neutral, But Will It Last?
by David Keller,
President and Chief Strategist, Sierra Alpha Research
KEY TAKEAWAYS
* This week's rally pushed the S&P 500 above an important trendline formed by the major highs in 2025.
* Improving market breadth indicators confirm a broad advance off the early April market low.
* Using a "stoplight" technique, we can better assess risk and...
READ MORE
MEMBERS ONLY

Two EASY Ways to Find the Strongest Stocks in Seconds

by Grayson Roze,
Chief Strategist, StockCharts.com
In this video, Grayson highlights the crucial 5,500 level on the S&P 500 using our "Tactical Timing" chart. He then demonstrates two of the easiest methods for identifying the strongest stocks within key indexes like the S&P 500, NASDAQ 100 and Dow Industrials....
READ MORE
MEMBERS ONLY

Earnings Week in Full Swing: Don't Overlook These Three Stocks

by Jay Woods,
Chief Global Strategist, Freedom Capital Markets
This week will be the biggest week of earnings season and yes, all eyes will be on the heavy-hitters: META, AMZN, MSFT, and AAPL. These names dominate headlines, and their charts are practically seared into our brains.
But let's look at some solid companies that might fly under...
READ MORE
MEMBERS ONLY

Real-Time Options Strategies on Your ChartLists? Yes, Please!
by Tony Zhang,
Chief Strategist, OptionsPlay
KEY TAKEAWAYS
* Real-time options strategy analysis is now ChartList-driven in the OptionsPlay Strategy Center.
* The OptionsPlay Strategy Center adapts to your style and puts hours of analysis at your fingertips—instantly.
If you're like most options traders, you've probably stared at your watchlist or portfolio and...
READ MORE
MEMBERS ONLY

Sentiment Signals Suggest Skepticism
by David Keller,
President and Chief Strategist, Sierra Alpha Research
KEY TAKEAWAYS
* The AAII survey demonstrates a lack of bullish optimism after the recent bounce higher.
* The NAAIM Exposure Index suggests that money managers remain skeptical of the recent advance.
* While Rydex fund flows show a rotation to defensive positions, previous bearish cycles have seen much larger rotations.
When I...
READ MORE
MEMBERS ONLY

Everything Looks Fine... Until You See This Chart
by Karl Montevirgen,
The StockCharts Insider
KEY TAKEAWAYS
* Even though the stock market outlook may appear cautiously optimistic, it helps to monitor sentiment and money flow indicators.
* The S&P 500 is below its 40-week moving average and sentiment reads bearish.
* In a headline-driven market, any signs of optimism may reflect a pause, which means...
READ MORE
MEMBERS ONLY

How to Shield Your Stocks During a Market Decline
by Jayanthi Gopalakrishnan,
Director of Site Content, StockCharts.com
KEY TAKEAWAYS
* When stock markets decline, you can protect your positions with options.
* Buying puts on stocks you own can help protect your position if the stock falls further.
* A put vertical spread is another strategy to protect your portfolio holdings.
When the stock market is turbulent, it makes sense...
READ MORE
MEMBERS ONLY

Bonds Down, But Are They Out?

by Martin Pring,
President, Pring Research
Something didn't seem to ring true a couple of weeks ago when the whole world, by which I mean from the Treasury Secretary to your favorite cable news host, seized on the recent sell-off in bonds and why they would no longer be a safe haven and therefore...
READ MORE
MEMBERS ONLY
Hidden Gems: Bullish Patterns Emerging in These Country ETFs

by Joe Rabil,
President, Rabil Stock Research
In this video, Joe highlights key technical setups in select country ETFs that are showing strength right now. He analyzes monthly and weekly MACD, ADX, and RSI trends that are signaling momentum shifts. Joe also reviews the critical level to watch on the S&P 500 (SPX), while breaking...
READ MORE
MEMBERS ONLY

$4,000 Gold? Analysts Eye New Highs on Inflation and Geopolitical Risk
by Karl Montevirgen,
The StockCharts Insider
KEY TAKEAWAYS
* The price of gold is climbing on safe-haven demand, with key support levels mapped for potential entry.
* The U.S. dollar is sliding as speculation grows over whether its weakness is part of a larger strategy.
* Bitcoin is testing resistance and could rally further if safe-haven flows accelerate....
READ MORE
MEMBERS ONLY
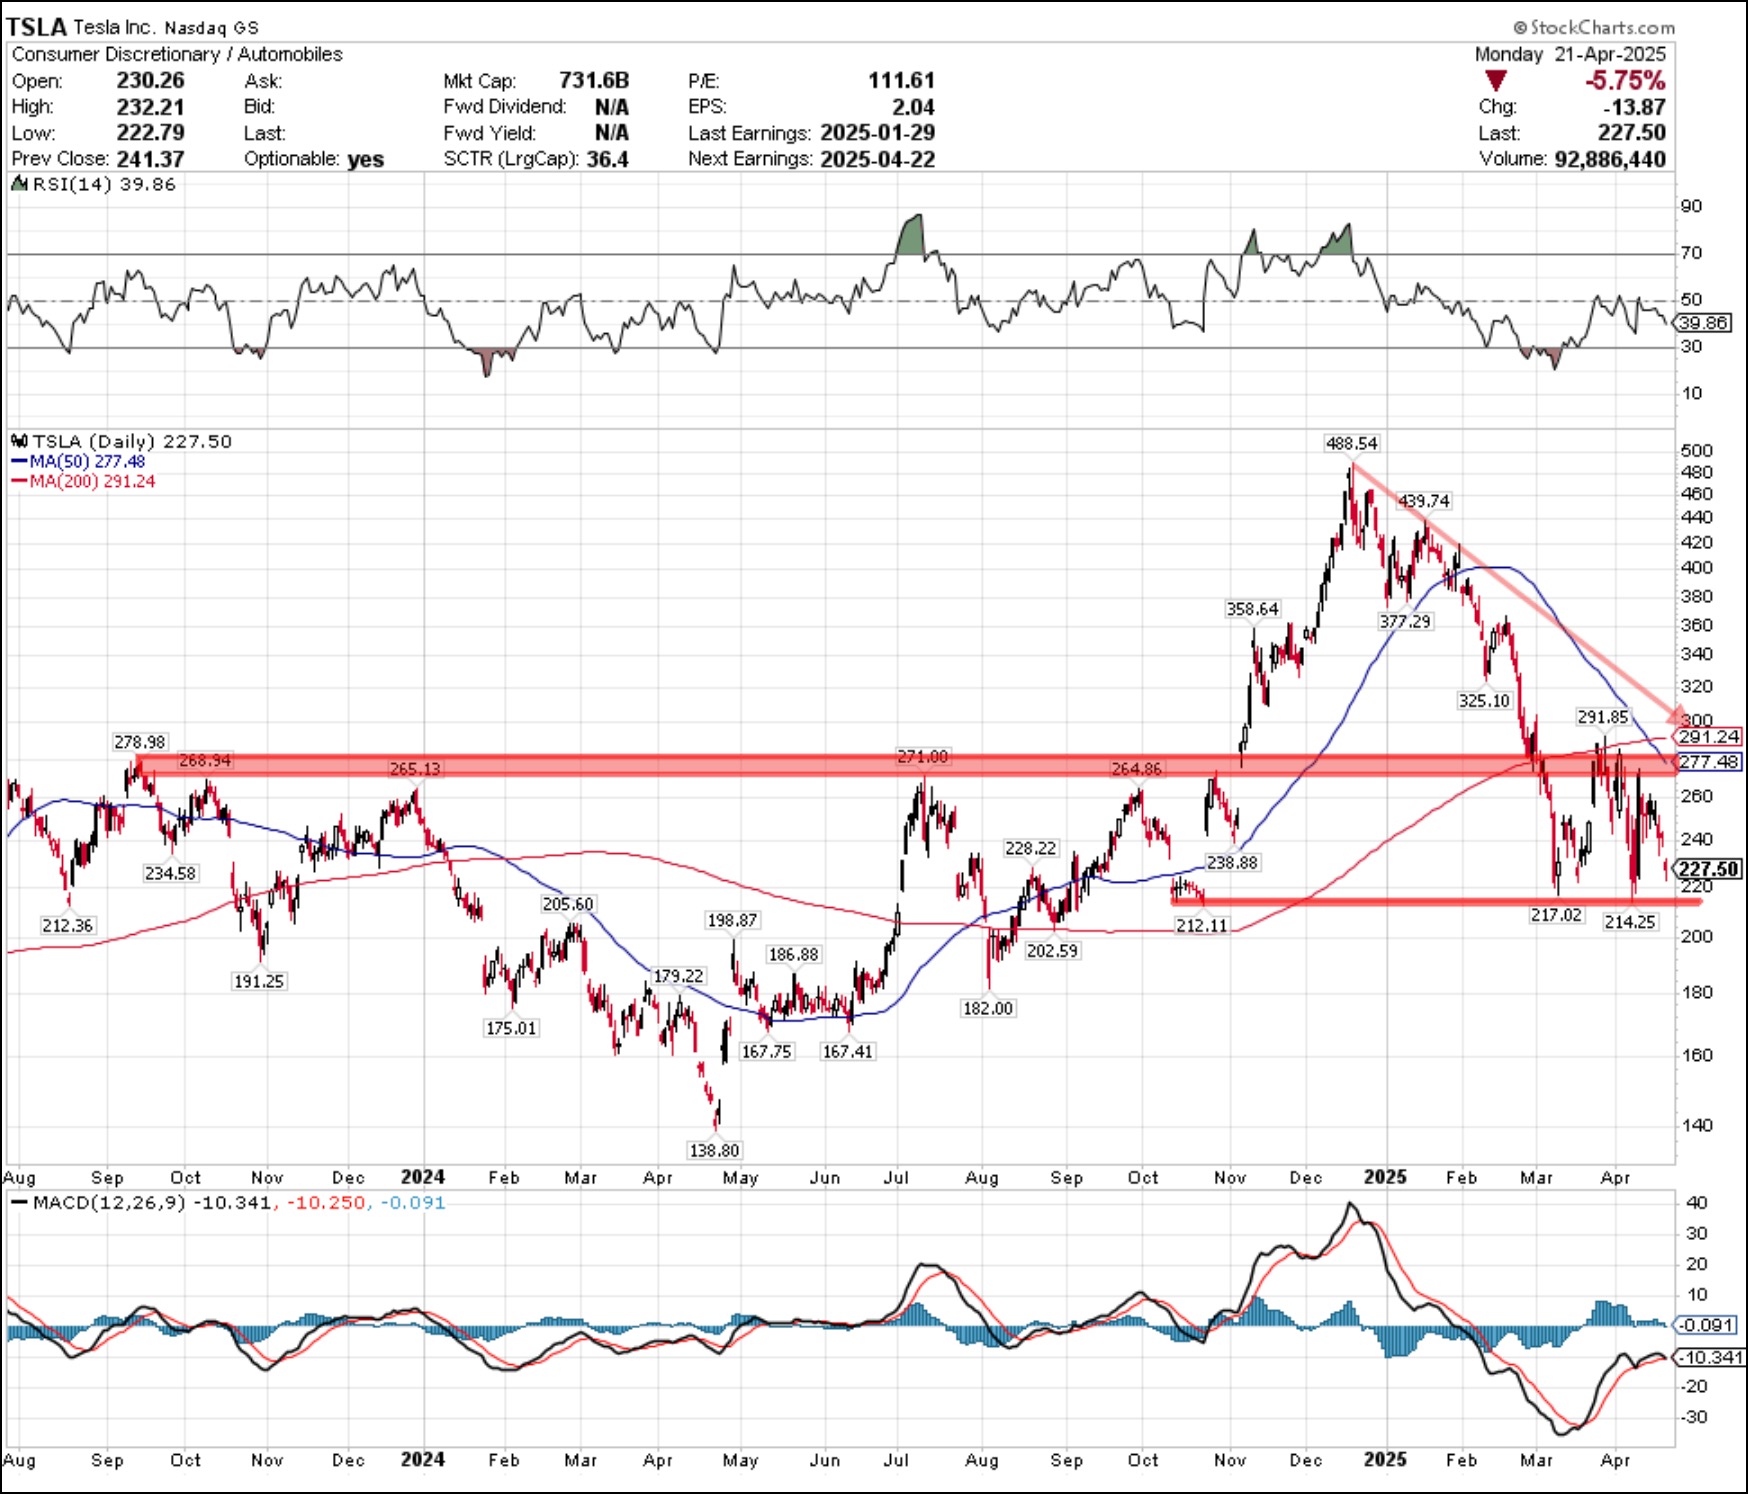
Three Stocks to Watch This Earnings Week
by Jay Woods,
Chief Global Strategist, Freedom Capital Markets
KEY TAKEAWAYS
* Tesla's daily chart displays key support levels to monitor after the company reports earnings.
* Service Now is showing signs of a bottom, which could mean a reversal depending on earnings results.
* Watch for Alphabet, Inc. shares to hit specific support levels, which could give traders favorable...
READ MORE
MEMBERS ONLY

Bearish Warning: 3 Market Sentiment Indicators You Can't Ignore
by David Keller,
President and Chief Strategist, Sierra Alpha Research
In this video, market sentiment, investor psychology, and stock market trends take center stage as David Keller, CMT, shares three powerful sentiment indicators that he tracks every week. He explains how the values are derived, what the current readings say about the market environment in April 2025, and how these...
READ MORE
MEMBERS ONLY
DP Trading Room: Long-Term Outlook for Bonds
by Erin Swenlin,
Vice President, DecisionPoint.com
The market continued to slide lower today as the bear market continues to put downside pressure on stocks in general. Bonds and Yields are at an inflection point as more buyers enter the Bond market which is driving treasury yields higher. What is the long-term outlook for Bonds? Carl gives...
READ MORE
MEMBERS ONLY
Safer Stock Picks for an Uncertain Market (High Yield + Growth)
by Mary Ellen McGonagle,
President, MEM Investment Research
In this video, as earnings season heats up, Mary Ellen reviews current stock market trends, highlighting top-performing stocks during past bear markets that are showing strength again today. She also shares a proven market timing system that's signaled every stock market bottom, helping investors stay ahead of major...
READ MORE
MEMBERS ONLY
The Best Five Sectors, #16
by Julius de Kempenaer,
Senior Technical Analyst, StockCharts.com
KEY TAKEAWAYS
* Consumer staples and utilities continue to lead sector rankings.
* Defensive sectors are showing strength in both weekly and daily RRGs.
* Health care struggling, but maintains position in top 5
* RRG portfolio slightly underperforming S&P 500 YTD, but gap narrowing.
Top 5 Remains Unchanged
The latest sector...
READ MORE
MEMBERS ONLY

Equities? Fuhgeddaboudit! Alternative Assets are Leading
by Arthur Hill,
Chief Technical Strategist, TrendInvestorPro.com
KEY TAKEAWAYS
* A simple ranking shows leadership in alterative assets and commodities.
* Stocks are not the place to be because the vast majority are below their 200-day SMAs.
* Bitcoin is holding up relatively well as it sets up with a classic corrective pattern.
Trading is all about the odds. Trade...
READ MORE
MEMBERS ONLY

Week Ahead: What Should You Do as Nifty Marches Higher Towards the Resistance Zone?
by Milan Vaishnav,
Founder and Technical Analyst, EquityResearch.asia and ChartWizard.ae
The week that went by was a short trading week with just three trading days. However, the Indian equities continued to surge higher, demonstrating resilience, and the week ended on a positive note.
During the week before last, the Nifty was able to defend the 100-week MA; last week, it...
READ MORE
MEMBERS ONLY

When in Doubt, Follow the Leadership
by David Keller,
President and Chief Strategist, Sierra Alpha Research
KEY TAKEAWAYS
* The Consumer Discretionary sector has underperformed the Consumer Staples sector since February, indicating defensive positioning for investors.
* The Relative Rotation Graphs (RRG) show a clear rotation from "things you want" to "things you need" as investors fear weakening economic conditions.
* We remain focused on...
READ MORE
MEMBERS ONLY

Stay Ahead of the Stock Market: Key Bond Market Signals Explained with Charts
by Jayanthi Gopalakrishnan,
Director of Site Content, StockCharts.com
KEY TAKEAWAYS
* The bond market has been as volatile as the equity market, as indicated by the Move Index.
* The price action in bonds will alert you to stability returning to equities.
* Investors should not rush to add positions until stability returns to the stock market.
It was another erratic...
READ MORE
MEMBERS ONLY
Breadth Maps Are A Bloodbath, BUT Has The Bounce Begun?
by Grayson Roze,
Chief Strategist, StockCharts.com
In this video, Grayson unveils StockCharts' new Market Summary ChartPack—an incredibly valuable new ChartPack packed full of pre-built charts covering breadth, sentiment, volatility data and MUCH MORE!
From there, Grayson then breaks down what he's seeing on the current Market Summary dashboard, illustrating how he'...
READ MORE
MEMBERS ONLY
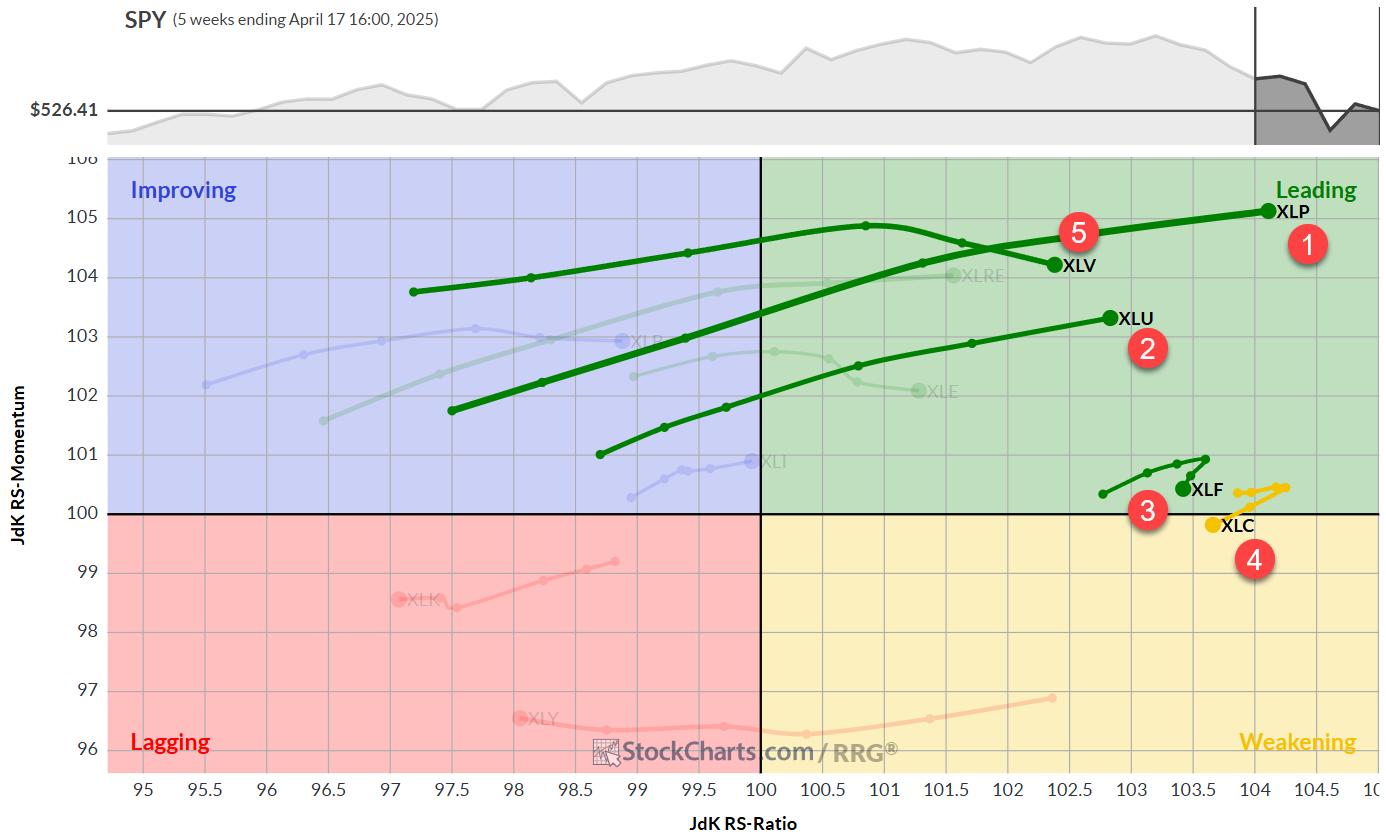
Sector Rotation Update: Value Stocks and Bonds Lead the Way!
by Julius de Kempenaer,
Senior Technical Analyst, StockCharts.com
Stocks vs. bonds? In this video, Julius breaks down the asset allocation outlook and why defensive sectors, large-cap value, and bonds may continue to outperform in this volatile market. He starts at the asset allocation level using Relative Rotation Graphs (RRGs) to analyze stocks vs bonds performance, then highlights the...
READ MORE
MEMBERS ONLY

This is the Group to Watch for the Next Bull Market Phase and Separating Noise from Reality

by Tom Bowley,
Chief Market Strategist, EarningsBeats.com
Technically, it's rather clear that we remain in a downtrend. However, not all downtrends are created equal. Some are built to last, while others can turn around quickly. Recognizing the difference is obviously quite important. What most traders/investors cannot grasp is that secular (long-term) bull markets often...
READ MORE
MEMBERS ONLY

200-Day Moving Average Confirms Bearish Phase
by David Keller,
President and Chief Strategist, Sierra Alpha Research
KEY TAKEAWAYS
* The S&P 500 currently sits about 8% below its 200-day moving average, even with a strong upswing on last week's tariff news.
* The newly updated Market Summary page on StockCharts.com allows investors to compare key market indexes to their 200-day moving averages.
* Three...
READ MORE
MEMBERS ONLY
Trade Pullbacks Like a Pro: Simple Moving Average Strategy That Works
by Joe Rabil,
President, Rabil Stock Research
Moving average strategy, trend trading, and multi-timeframe analysis are essential tools for traders. In this video, Joe demonstrates how to use two key moving averages to determine if a stock is in an uptrend, downtrend, or sideways phase. He then expands on applying this concept across multiple timeframes to gain...
READ MORE
MEMBERS ONLY

How to Time Your Trades For Faster Gains
by Tony Zhang,
Chief Strategist, OptionsPlay
When working with probabilities, you want to place trades that maximize your returns while minimizing your risks.
In this OptionsPlay members-only video, Tony Zhang walks you through the techniques professional traders use to identify optimal entry points. Explore how you can apply those same strategies in the StockCharts.com OptionsPlay...
READ MORE
MEMBERS ONLY

Secure Your Retirement Happiness: Check Your 401(k) Now!
by Jayanthi Gopalakrishnan,
Director of Site Content, StockCharts.com
KEY TAKEAWAYS
* When the stock market is erratic you should evaluate your 401(k).
* The S&P 500 is trading below its 200-day moving average.
* The general sentiment continues to be bearish.
With so many articles and videos on popular media channels advising you not to look at your...
READ MORE
MEMBERS ONLY

Is This the Confidence Trap That Could Wreck Your Retirement Portfolio?
by Karl Montevirgen,
The StockCharts Insider
KEY TAKEAWAYS
* Despite extreme market volatility, the broader market's uptrend may still be intact.
* Defensive sectors like Consumer Staples and Utilities are flashing bullish signals.
* Defensive sectors don't typically drive uptrends so, depending on your time horizon, you will need to create an appropriate strategy.
If...
READ MORE
MEMBERS ONLY

Bullish Percent Index Confirms Short-Term Rebound
by David Keller,
President and Chief Strategist, Sierra Alpha Research
KEY TAKEAWAYS
* The Bullish Percent Index for both the Nasdaq 100 and S&P 500 have made moves similar to previous swing lows.
* A long-term review of these signals yields mixed results, especially during sustained bearish market regimes.
One of my favorite market breadth indicators remained in an extreme...
READ MORE
MEMBERS ONLY

Gold is at a Record High -- Is There a Message?
by Martin Pring,
President, Pring Research
The recent rally in the gold price has not yet attracted the kind of gold fever associated with the 1980 peak. At that time, there were numerous reports of unusual action, such as customers forming huge lines to buy the stuff at Canadian banks, an event that to my knowledge...
READ MORE