MEMBERS ONLY

Old Dogs, New Tricks: Bitcoin & Gold and What's Next

by Larry Williams,
Veteran Investor and Author
Larry compares Bitcoin and gold, looking at their shared appeal; he notes caution signals for Bitcoin and similar risks for gold. He also revisits past forecasts and updates his market outlook....
READ MORE
MEMBERS ONLY

Energy Stocks Ready to Break Out? Key Setups to Watch

by Joe Rabil,
President, Rabil Stock Research
Joe highlights key setups in the energy sector, reviewing stocks such as XOM, CVX, VLO, and SU while explaining patterns like reverse divergence, zero line reversals, and low ADX conditions. He then analyzes the S&P market conditions, covering sentiment, volatility, trend, and momentum across multiple time frames, noting...
READ MORE
MEMBERS ONLY

Are the Mag 7 Rolling Over? Key Signals from Apple to Amazon

by Tom Bowley,
Chief Market Strategist, EarningsBeats.com
Tom recaps the week, then turns his attention to the Mag 7 stocks after short-term sentiment warnings appeared in the market. He reviews key charts showing bearish engulfing patterns, resistance tests, and potential pullbacks in AAPL, MSFT, NVDA, META, GOOGL, TSLA, and AMZN, noting that six of the seven...
READ MORE
MEMBERS ONLY

China Tech Breakout: Alibaba Sparks a FXI Rally Despite Powell's Warning
BABA stock is rebounding with AI-driven momentum. Learn how the stock price of Alibaba impacts FXI and what the technicals signal for traders in 2025....
READ MORE
MEMBERS ONLY

Turn Your Stock Watchlist Into Winners With This Chart Tool

by Jayanthi Gopalakrishnan,
Director of Site Content, StockCharts.com
Learn how the StockCharts Technical Rank (SCTR) score can help you spot stocks gaining momentum....
READ MORE
MEMBERS ONLY
Dave's September 2025 Stock Picks: 3 Charts That Worked… and 2 That Didn’t

by David Keller,
President and Chief Strategist, Sierra Alpha Research
Dave revisits five stocks from the September Top Ten Charts episode to see how they’ve evolved. He reviews NVDA, AXP, MSI, MRK, and the SIL, explaining which setups worked, which failed, and the lessons to carry forward. From short ideas that didn’t pan out to breakout patterns and...
READ MORE
MEMBERS ONLY

Taking Stock of the Small-Cap Record High: Here's How High IWM Could Go
The Russell 2000 ETF (IWM) logged a record weekly close, triggering a bullish breakout target of $322. Explore why small-caps may thrive with Fed rate cuts, supportive seasonality, and strong relative strength versus large caps....
READ MORE
MEMBERS ONLY

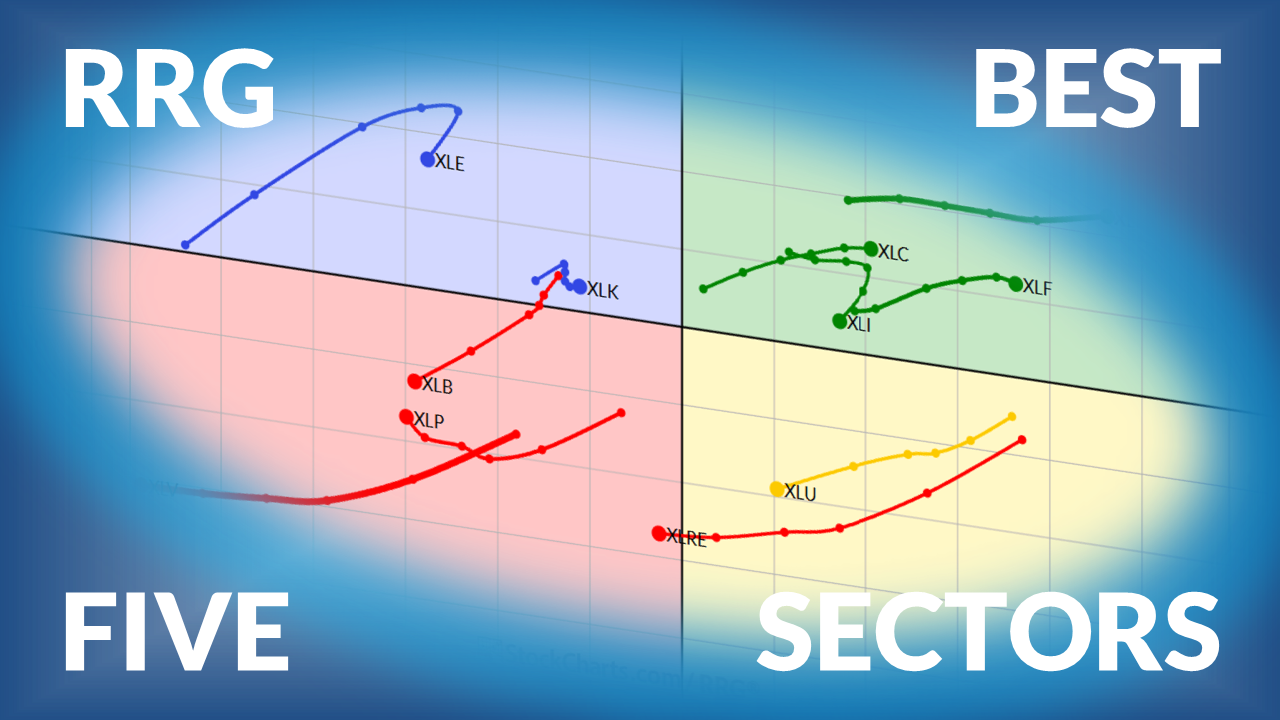
The Best Five Sectors This Week, #37

by Julius de Kempenaer,
Senior Technical Analyst, StockCharts.com
Weekly update on US sector rotation ranking based on Relative Rotation Graphs...
READ MORE
MEMBERS ONLY

Week Ahead: NIFTY Faces Resistance at These Levels; RRG Indicates Weakening Outpacing Shifts Within Sectors

by Milan Vaishnav,
Founder and Technical Analyst, EquityResearch.asia and ChartWizard.ae
The price action in the Nifty reflects a potential breakout buildup. But will it be able to break out of the resistance? Here's what you need to look for in the charts....
READ MORE
MEMBERS ONLY
Dow Theory Bearish, But Some Transports Are Thriving
by David Keller,
President and Chief Strategist, Sierra Alpha Research
Dow Theory has flashed a bearish non-confirmation signal. Dave breaks down the implications of this ominous pattern and analyzes some of the key transportation stocks that have caused this macro divergence....
READ MORE
MEMBERS ONLY

Tech & Small Caps Surge After Rate Cut – Who Leads Next?

by Mary Ellen McGonagle,
President, MEM Investment Research
In this week’s show, Mary Ellen highlights the stocks and groups showing the most promise following the Fed’s rate cut. She spotlights leadership in technology, software, and semiconductors, while also pointing out opportunities in small-cap AI names, robotics, crypto, and biotechs. Mary Ellen shares how industrials, uranium,...
READ MORE
MEMBERS ONLY
Special Offer: 2 Months FREE for New StockCharts Members
by Jayanthi Gopalakrishnan,
Director of Site Content, StockCharts.com
Another week, another record-setting close in the major indexes. With the S&P 500 ($SPX) up over 13% so far this year, investors are seeing gains far beyond what CDs or money markets can deliver.
The stock market may seem to be a complex and risky beast, but...
READ MORE
MEMBERS ONLY

StockCharts Insider: The SCTR Fast Track to Buy-the-Dips & Breakouts

by Karl Montevirgen,
The StockCharts Insider
Before We Dive In…
How do you turn a quick morning scan into a market edge? With SCTR Reports. In this article, we’ll cover how SCTRs rank stocks, how to scan them fast, and how to spot leaders, laggards, and turnarounds in minutes. This is your quick-start guide...
READ MORE
MEMBERS ONLY

Sector Rotation Points to Large-Cap Growth Stocks
by Julius de Kempenaer,
Senior Technical Analyst, StockCharts.com
Julius takes a look at the current sector rotation, in combination with growth-value and size rotation. Combining these Relative Rotation Graphs shows strength concentrating in large-cap growth and the Tech, Discretionary, and Communication Services sectors. From this vantage point, we can see continued strength for the S&...
READ MORE
MEMBERS ONLY

Fed Day Signals: Noise or the Start of Something Bigger?
by Jayanthi Gopalakrishnan,
Director of Site Content, StockCharts.com
The Fed delivered a rate cut and markets wobbled. Discover how stocks, bonds, and the dollar reacted and what investors should watch next. ...
READ MORE
MEMBERS ONLY

Wednesday May Have Been Turnaround Day for Some Markets

by Martin Pring,
President, Pring Research
Following the Fed's rate cut, the price action in several markets indicated a short-term reversal. Martin suggests monitoring these charts and their technical signals in the coming weeks....
READ MORE
MEMBERS ONLY

10 Stocks Poised To Run After Fed Cuts Rates
by Tom Bowley,
Chief Market Strategist, EarningsBeats.com
Join Tom Bowley, EarningsBeats.com's Chief Market Strategist, as he recaps last week's action, especially Wednesday's action after the Federal Reserve finally decided to continues its 2024 rate-cutting campaign. Tom dives into what areas of the stock market were working after the decision...
READ MORE
MEMBERS ONLY
Simple Yet Powerful RSI Pullback Signal
by Joe Rabil,
President, Rabil Stock Research
In this video, Joe shows viewers how to use a deep pullback in RSI as a buying opportunity. He uses two different settings for RSI in order to identify when a stock is a getting a great setup during an uptrend, and presents several examples on weekly and daily charts....
READ MORE
MEMBERS ONLY

Offense Still Crushing Defense
by David Keller,
President and Chief Strategist, Sierra Alpha Research
While technology stocks have stalled out over the last six weeks, other growth sectors have stepped into a leadership role. Here are the charts Dave uses regularly to track leadership themes, and identify when new sectors are improving in relative strength terms....
READ MORE
MEMBERS ONLY

September’s Final Stretch: Why Stocks Face Their Trickiest Days Ahead
Late September is historically tough for stocks. Mike explores why the S&P 500, Materials (XLB), and low-volatility put options could define the weeks ahead....
READ MORE
MEMBERS ONLY
Pre-FOMC Setup: S&P 500 Calm Before the Fed

by Frank Cappelleri,
Founder & President, CappThesis, LLC
Frank Cappelleri analyzes the S&P 500’s unusual calm ahead of the Fed, highlighting trend signals, failed bearish patterns, and key GoNoGo charts....
READ MORE
MEMBERS ONLY

These Asset Relationships Could Be About to Signal Some Important Changes Ahead
by Martin Pring,
President, Pring Research
Martin explains how analyzing inter-asset relationships can give important insights into the market -- and what those relationships are telling us right now....
READ MORE
MEMBERS ONLY

Will the Fed “Go Big”? Real Estate Stocks Quiet Amid Major Macro Shifts
The Fed is set to cut rates again as Treasury yields slide and stocks rally. But why are real estate stocks still lagging? And could a breakout above a key resistance level shape the 2026 cycle?...
READ MORE
MEMBERS ONLY

Comparing Growth vs. Value on RRGs Across Time
by Julius de Kempenaer,
Senior Technical Analyst, StockCharts.com
Growth and Value segments are widely used in the investment world, as investors shift from one to another based on market conditions and risk-appetite. Julius shows how to use Relative Rotation Graphs to help monitor these shifts....
READ MORE
MEMBERS ONLY

Visionary Leadership and Strong Fundamentals as Drivers of a Winning Stock
by Mary Ellen McGonagle,
President, MEM Investment Research
Mary Ellen looks back at winning stocks whose histories have been impacted by forward-thinking leadership and innovation....
READ MORE
MEMBERS ONLY
Make Every Chart Look Like Your Chart—With One Click
by Jayanthi Gopalakrishnan,
Director of Site Content, StockCharts.com
Have you ever wished you could change any chart you open to appear just the way you want – in just a single click? With StyleButtons, you can do just that.
Setting it up
When you’re logged in to your StockCharts account and using SharpCharts, look at the upper-left...
READ MORE
MEMBERS ONLY

AI Stocks Pop...These Areas Not!
by Mary Ellen McGonagle,
President, MEM Investment Research
In this week’s video, Mary Ellen breaks down what drove AI-related stocks higher, while also revealing non-tech names that are poised to benefit. She highlights specific Crypto ETFs that are in a bullish positions, plus discusses the move into Gold and other metals.
This video originally premiered...
READ MORE
MEMBERS ONLY

RSI Overbought? Why That Could Signal Big Gains Ahead
by David Keller,
President and Chief Strategist, Sierra Alpha Research
Join Dave as he explains how traders often get into trouble by thinking of “overbought” stocks as being bearish setups. While an RSI over 70 can often lead to short-term pullbacks, Dave explains that they can also signal the strength of a long-term uptrend phase. He uses Motorola...
READ MORE
MEMBERS ONLY
AI Stocks Setting Up For A Tumble?
by Tom Bowley,
Chief Market Strategist, EarningsBeats.com
Join Tom as he recaps the stock market action of the past week! Tom breaks down the current technical outlook on the major indices, before highlighting key sector rotation using RRG charts. He then dives into large AI stocks like ORCL, NVDA, MSFT, META, PLTR, and others, followed by a...
READ MORE
MEMBERS ONLY

Bonds Still Underperforming, Best Sectors for Hunting, IWM Starts to Leads SPY, Healthcare and Biogen Perk Up

by Arthur Hill,
Chief Technical Strategist, TrendInvestorPro.com
TLT broke out, but is still underperforming SPY; meanwhile, IWM has begun outperforming SPY. Arthur explains how to find the ideal "hunting grounds" for sectors....
READ MORE
MEMBERS ONLY

6,555 Target Hit!
by Frank Cappelleri,
Founder & President, CappThesis, LLC
Despite skepticism, the S&P reached Frank's upside target of 6,555. Frank breaks down how we got here and what it means for ongoing market patterns....
READ MORE
MEMBERS ONLY
Is the SPX Exhausted?
by Joe Rabil,
President, Rabil Stock Research
This week, Joe breaks down the importance of focusing on Price and using indicators as supporting tools. He shows how the daily SPX chart has continued to make higher highs and higher lows, explaining that, as the ADX shows weakness, we need price to confirm this signal. Joe then covers...
READ MORE
MEMBERS ONLY

Where Has Industrials Leadership Gone? A Sector Drill Down
With Industrials now in consolidation mode, Mike highlights underperforming single-stock culprits and explains why the groundwork is in place for a late-year rally....
READ MORE
MEMBERS ONLY

The CPI is Coming Out Wednesday: Here is Something to Be Aware of
by Martin Pring,
President, Pring Research
As August CPI data looms, Martin looks at the chart and analyzes whether an upside reversal could be in the cards....
READ MORE
MEMBERS ONLY

NVIDIA Under Pressure: Eyeing a Near-Term Bearish Options Strategy
Mike spotlights a bearish NVDA options setup using StockCharts' OptionsPlay Strategy Center, and explains what could stir fresh volatility....
READ MORE
MEMBERS ONLY
The Best Five Sectors This Week, #35
by Julius de Kempenaer,
Senior Technical Analyst, StockCharts.com
Julius de Kempenaer presents his weekly update on the top five sectors on the leaderboard, and the movement under the surface....
READ MORE