MEMBERS ONLY

Stocks Yield. Bonds Don't

by Bruce Fraser,
Industry-leading "Wyckoffian"
A characteristic of this economic cycle has been the disappearance of yield. Yield has been like a glacier melting ever downward and eventually disappearing into the yawning gap it created. In this brave new world of minimalistic interest rates how does an investor create income? Negative interest rates infect most...
READ MORE
MEMBERS ONLY
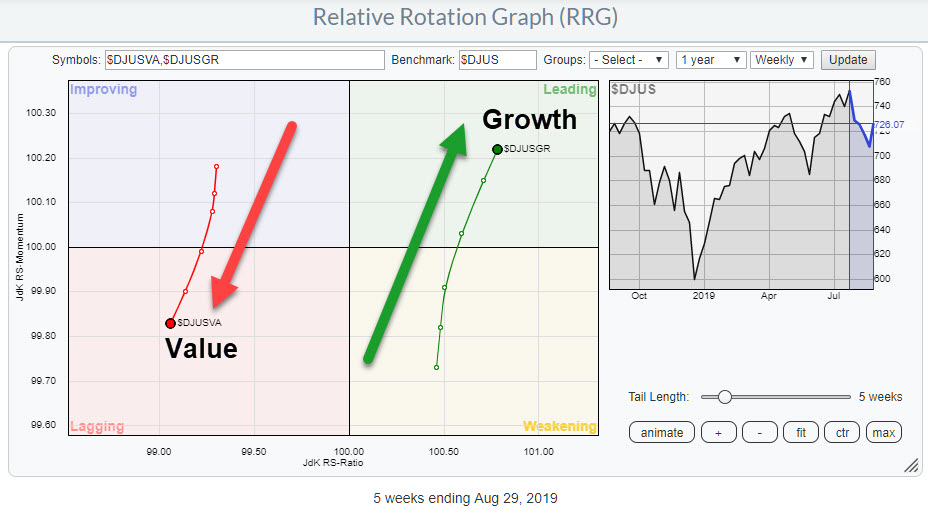
Growth vs. Value Rotation is Sending a Very Clear Message on RRG

by Julius de Kempenaer,
Senior Technical Analyst, StockCharts.com
One of the Relative Rotation Graphs that I like to keep an eye on in order to get a handle on the general market condition (for stocks) is the chart above, which shows the rotation of Value versus Growth stocks using the Dow Jones US Index as the benchmark. The...
READ MORE
MEMBERS ONLY
China Blinks First, U.S. Equities Rally

by Tom Bowley,
Chief Market Strategist, EarningsBeats.com
Market Recap for Thursday, August 29, 2019
Well, thank you China. On Thursday morning, China pledged a calmer approach to the trade war and indicated they would not retaliate for the latest tariffs imposed by the U.S. At least not now. Temporarily, that appeased traders who used the opportunity...
READ MORE
MEMBERS ONLY

State of the Stock Market - Big Sectors Hold Strong

by Arthur Hill,
Chief Technical Strategist, TrendInvestorPro.com
The broader market may not seem bullish right now, but there is clearly a bull market somewhere within stocks. In particular, the S&P 500 and Nasdaq 100 are currently within five percent of all time highs, which were hit just five weeks ago. Moreover, they held well above...
READ MORE
MEMBERS ONLY

It is Time for a Change

by Greg Morris,
Veteran Technical Analyst, Investor, and Author
I have written 194 articles in my Dancing with the Trend blog on StockCharts.com in the past 4+ years. My intent was to educate about how markets work, offer full support of technical analysis, and tell real stories about being a money manager for the past 20+ years. I...
READ MORE
MEMBERS ONLY

STOCKS CONTINUE TO STRENGTHEN AS SUPPORT LEVELS HOLD -- THE DOW SURVIVES TEST OF 200-DAY AVERAGE -- AS DO SEVERAL SECTOR SPDRS -- TRANSPORTATION REBOUND HELPS LIFT XLI -- SMALL CAP REBOUND IS ALSO HELPING SUPPORT RALLY

by John Murphy,
Chief Technical Analyst, StockCharts.com
THE DOW HOLDS ITS RED LINE...A lot of underlying support levels have held this week, and stocks are now approaching overhead resistance.Tuesday's message showed the Dow Industrials testing its 200-day moving average for the third time since the start of August. Sometimes the third time is...
READ MORE
MEMBERS ONLY
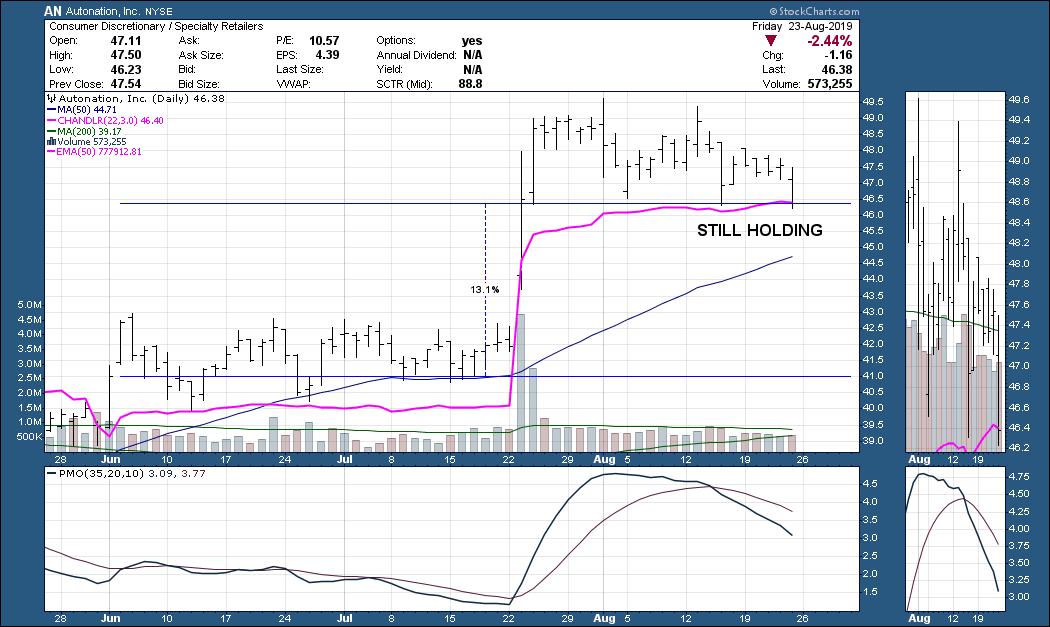
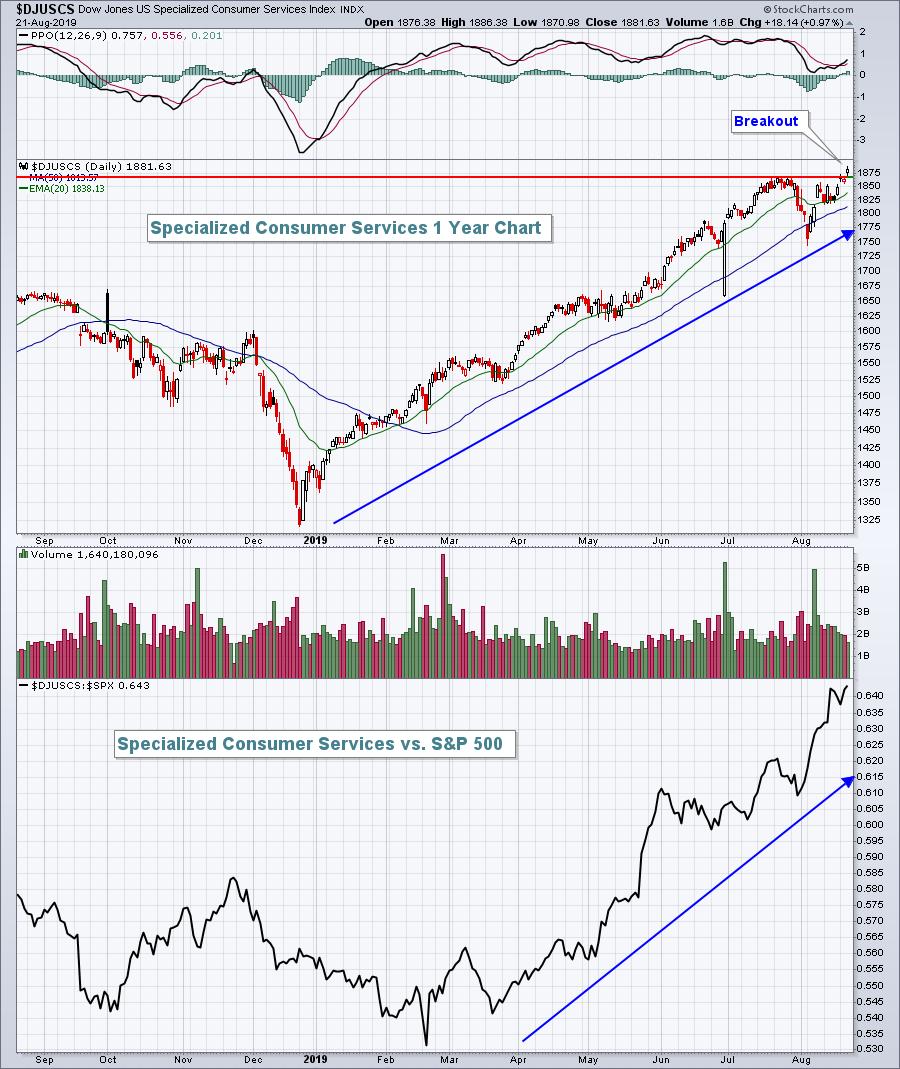
A (pair) Trade Idea in Consumer Discretionary
by Julius de Kempenaer,
Senior Technical Analyst, StockCharts.com
Looking at the daily Relative Rotation Graph for US sectors, we can see that Consumer Discretionary is inside the improving quadrant and about to cross over into leading at a strong RRG-Heading. For the near-term, this makes XLY a sector to keep an eye on.
In order to look for...
READ MORE
MEMBERS ONLY

Ranking and Categorizing Dozens of Key ETFs into Five Chart Groups
by Arthur Hill,
Chief Technical Strategist, TrendInvestorPro.com
Today I am breaking my ETF chart list into five groups and showing these groups in order of performance, strongest to weakest.
After analyzing and comparing these price charts, five clear groups emerged. First, there are ETFs with very strong uptrends that look very extended. Second, there are ETFs with...
READ MORE
MEMBERS ONLY
Consumer Strength Is Real, PLUS A Personal Announcement
by Tom Bowley,
Chief Market Strategist, EarningsBeats.com
Market Recap for Wednesday, August 28, 2019
10 of 11 sectors advanced in a broad-based rally on Wednesday that carried the Dow Jones higher by 1%. The small cap Russell 2000, a major laggard in 2019, rose 1.15% in a rare day of outperformance. Energy (XLE, +1.43%), consumer...
READ MORE
MEMBERS ONLY

DP Mid-Week Alert: Volatility Still a Problem

by Erin Swenlin,
Vice President, DecisionPoint.com
The DecisionPoint Scoreboards are still very bearish; in spite of a recovery this week so far (1.43% higher for the SPX), the charts aren't favorable. I've analyzed volatility, breadth and our indicators and was only able to find one note of positivity. At this point,...
READ MORE
MEMBERS ONLY

WEAKER GROUPS ARE TESTING IMPORTANT SUPPORT LEVELS -- THAT INCLUDES SMALL CAPS AND TRANSPORTS WHICH ARE TESTING THEIR SPRING LOWS -- AND FINANCIALS -- HOW THEY HANDLE THAT TEST OF SUPPORT COULD EFFECT MARKET DIRECTION
by John Murphy,
Chief Technical Analyst, StockCharts.com
SMALLER STOCKS TEST IMPORTANT SUPPORT LEVEL...Yesterday's message showed the Dow Industrials and a handful of sector SPDRS testing potential support at their 200-day moving averages. Today's message will show three stock groups that are testing even more important support along their spring lows. Starting with...
READ MORE
MEMBERS ONLY
Volatility And Treasury Yields: The Two Beasts Of Burden
by Tom Bowley,
Chief Market Strategist, EarningsBeats.com
Market Recap for Tuesday, August 27, 2019
U.S. equities were strong out of the gate on Tuesday, but had little follow-through as sellers re-emerged. Early gains on our major indices quickly vanished and these key indices were left trying to minimize losses into the close. There were no significant...
READ MORE
MEMBERS ONLY

When The Crowd Screams Recession, Technicians Should Prepare For A Bull Market

by Martin Pring,
President, Pring Research
* Support Holds in an Oversold Market
* Most Sectors Still Experiencing Rising Peaks and Troughs
Last week, I pointed out that the stock market faced a challenge at its recent lows. This was because I saw that a breach of the solid red trend lines in Charts 1 and 2 would...
READ MORE
MEMBERS ONLY

A LOT OF 200-DAY MOVING AVERAGES ARE BEING TESTED -- STARTING WITH THE DOW -- AND SOME SECTOR SPDRS -- AND EAFE ISHARES
by John Murphy,
Chief Technical Analyst, StockCharts.com
STARTING WITH THE DOW...Chart 1 shows the Dow Industrials finding support at its 200-day moving average for the third time this month. That's an encouraging sign. In addition, its daily MACD lines are close to turning positive (lower box); while its 14-day RSI line (top box) is...
READ MORE
MEMBERS ONLY
Here's The Driving Force Behind My Bullishness
by Tom Bowley,
Chief Market Strategist, EarningsBeats.com
Market Recap for Monday, August 26, 2019
All eleven sectors advanced on Monday as U.S. equities staged a rally following Friday's selloff. It wasn't overly impressive in my view as most of the gains came at the opening bell. There wasn't much follow...
READ MORE
MEMBERS ONLY
An "All-American" Pocket Of Strength In An Otherwise Tough Market.

by Mary Ellen McGonagle,
President, MEM Investment Research
There's nothing quite like a warm pumpkin spice latte (or a cold brew with a bucket of wings) to help ward off the anxiety of investing in the current markets. With August shaping up to be the most volatile month of the year, I'm gonna wager...
READ MORE
MEMBERS ONLY
A Stable Stock in an Unstable Market
by Arthur Hill,
Chief Technical Strategist, TrendInvestorPro.com
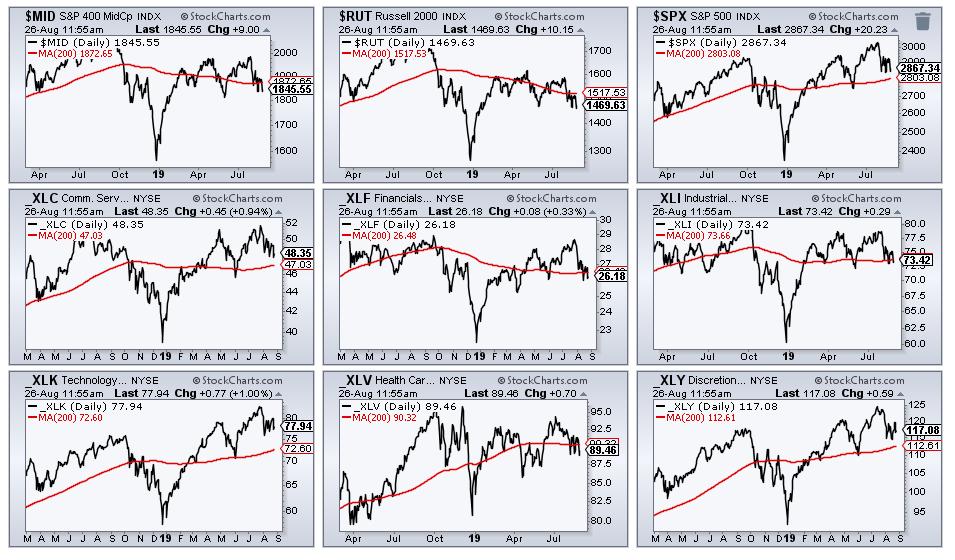
The pickings are getting slim as the broader market destabilizes. The S&P 500 and Nasdaq 100 remain above their 200-day SMAs, but the S&P Mid-Cap 400 and Russell 2000 are below these key moving averages. The Consumer Discretionary SPDR (_XLY), Communication Services SPDR (_XLC) and Consumer...
READ MORE
MEMBERS ONLY

What do you want from me?
by Julius de Kempenaer,
Senior Technical Analyst, StockCharts.com
Rumour has it that a new show will be launching soon on StockCharts TV. The focus for this weekly 30-minute adventure will be on sectors, with yours truly as the host/presenter for this program (so you can count on a healthy dose of RRG-related content).
Don't worry,...
READ MORE
MEMBERS ONLY
Trade War Escalates, Key Price Support Revisited
by Tom Bowley,
Chief Market Strategist, EarningsBeats.com
Market Recap for Friday, August 23, 2019
Friday was another trade war disaster. It's almost as if we're getting numb to it. Dow Jones down 600. Ho-hum. Technically, there wasn't even a short-term violation as the S&P 500 simply moved back down...
READ MORE
MEMBERS ONLY

SPY and QQQ Hit the Canvas - Again
by Arthur Hill,
Chief Technical Strategist, TrendInvestorPro.com
Stocks were hit hard in early August with SPY and QQQ falling six to seven percent in six days. These declines started from new highs in late July, which is when these prizefighters were at peak performance. The sharpness of the declines is like a prizefighter getting blindsided and knocked...
READ MORE
MEMBERS ONLY
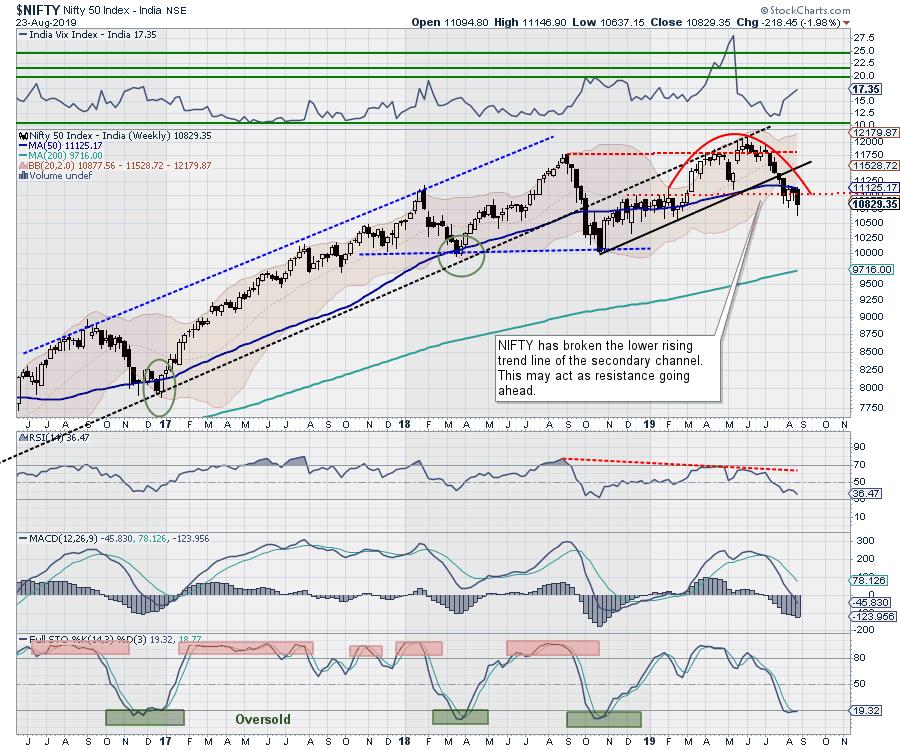
Week Ahead: Intermittent Pullbacks Likely; Broader Structure Continues To Remain Tentative

by Milan Vaishnav,
Founder and Technical Analyst, EquityResearch.asia and ChartWizard.ae
The past week generally went along the anticipated lines. The broader structure of the markets continued to be weak; it faced severe volatility during the past trading days and faced heavy selling pressure at higher levels. After a thoroughly volatile week, the headline index ended with a net loss of...
READ MORE
MEMBERS ONLY
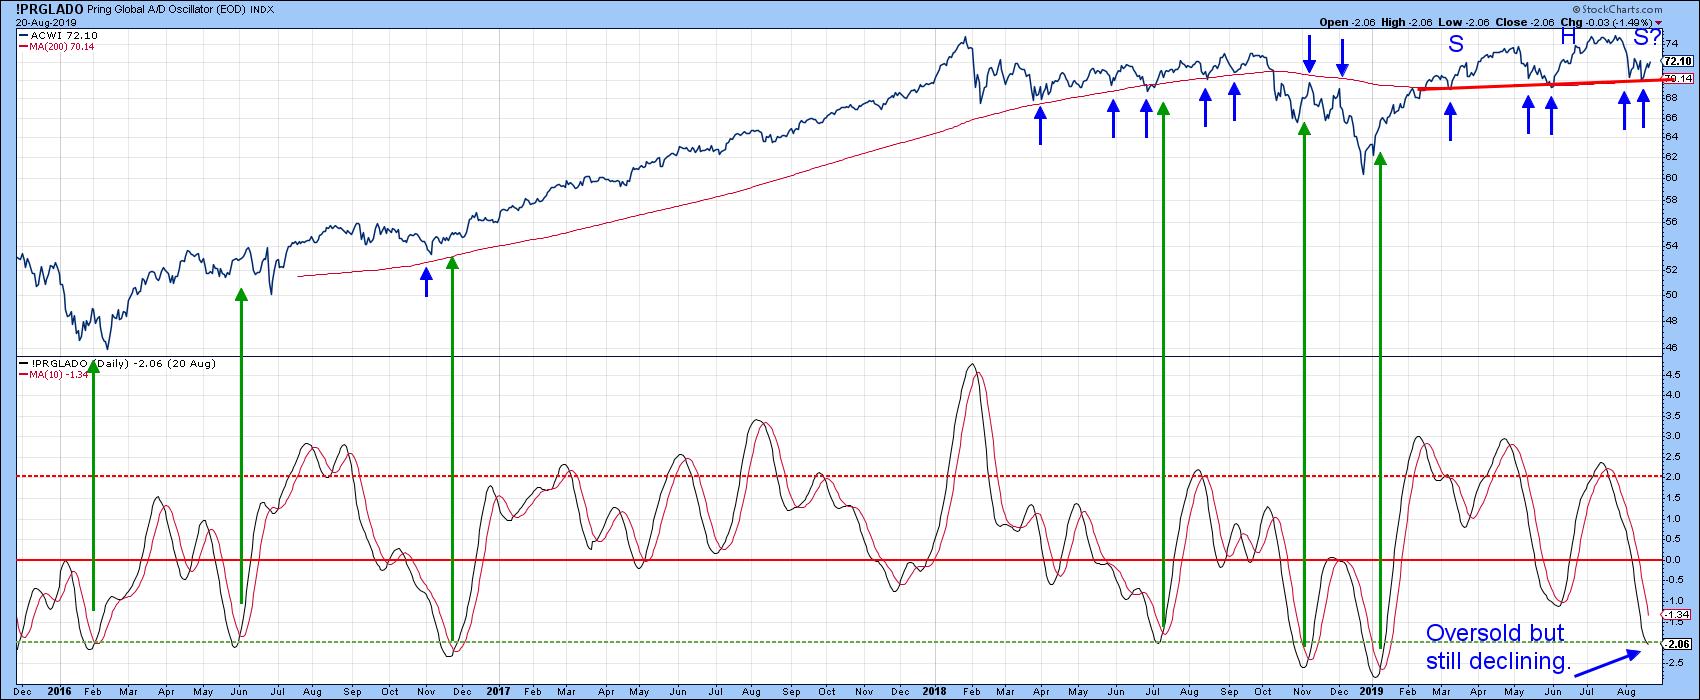
Trick or Treat for Global Equities?
by Martin Pring,
President, Pring Research
Editor's Note: This article was originally published in Martin Pring's Market Roundup on Wednesday, August 21st at 9:36pm ET.
During my many decades in this business, I have never heard of a recession so well-advertised as the one we are witnessing currently. It's...
READ MORE
MEMBERS ONLY
Introducing "WealthWise Women" and the Pink Line
by Erin Swenlin,
Vice President, DecisionPoint.com
Last week, Mary Ellen McGonagle and I had the pleasure of speaking at The Money Show as part of the "Women on Wealth" panel, where we discussed how we can bring women to the "investment table" through education, engagement and empowerment. The presentation was unexpectedly powerful...
READ MORE
MEMBERS ONLY
Here's to the Future!

by John Hopkins,
President and Co-founder, EarningsBeats.com
Recently, Tom Bowley announced to the StockChartscommunity that he will soon bereturning to his "roots"atEarningsBeats.com. When Tom first approached me with the idea, I let out a big "Woohoo!". In all seriousness, it was a joyful day for me, as Tom and I go...
READ MORE
MEMBERS ONLY
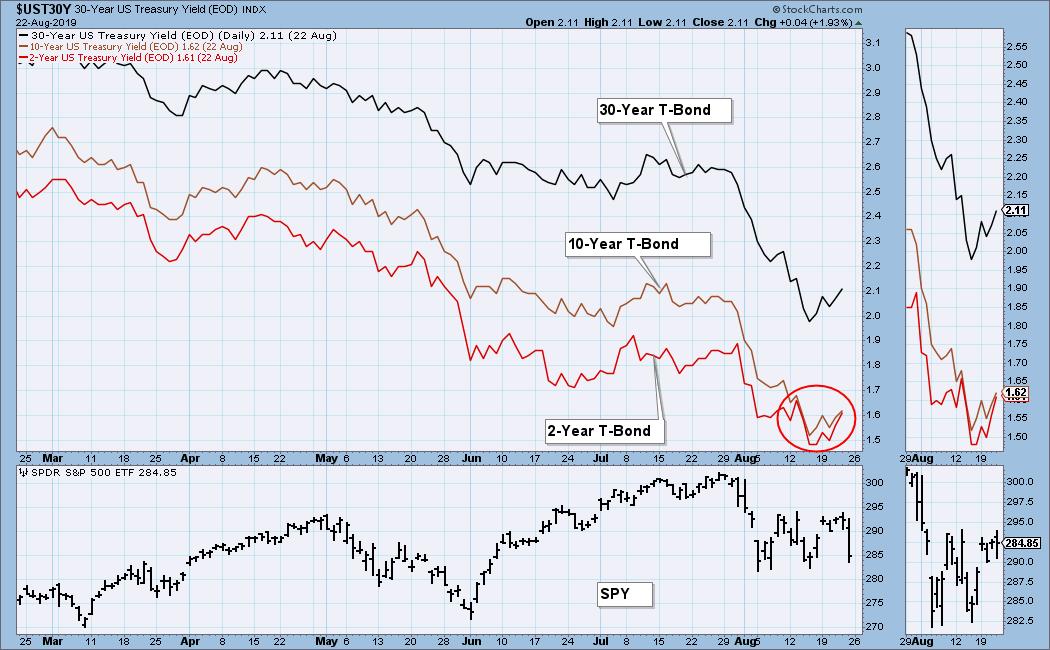
DP WEEKLY WRAP: Inversion Aversion; Failed Double Bottom

by Carl Swenlin,
President and Founder, DecisionPoint.com
The oft-referenced "yield curve" refers to the relationship between the yield of the 10-Year T-Bond and the 2-Year T-Bond. Logically, the longer-term instrument should have the higher yield, but this week the 2-Year yield popped slightly above the 10-Year yield on a few occasions intraday. As could be...
READ MORE
MEMBERS ONLY

Investing With Metaphors: These Three Are Giants!

by Gatis Roze,
Author, "Tensile Trading"
A personal secret: investing with metaphors has always enlightened and disciplined me, helping me grow as an individual investor. One of the most fertile areas for applying this axiom has been car collecting since, much like investing, it's never black and white. The reality is that both are...
READ MORE
MEMBERS ONLY

Bonds, Gold, the PPO and Extreme Conditions
by Arthur Hill,
Chief Technical Strategist, TrendInvestorPro.com
The 20+ YR T-Bond ETF (TLT) and Gold SPDR (GLD) are on a tear, but they are getting stretched by one key metric and could be ripe for a corrective period.
There are numerous ways to measure overbought (extended) conditions. Indicators like RSI (above 70) and the Stochastic Oscillator (above...
READ MORE
MEMBERS ONLY
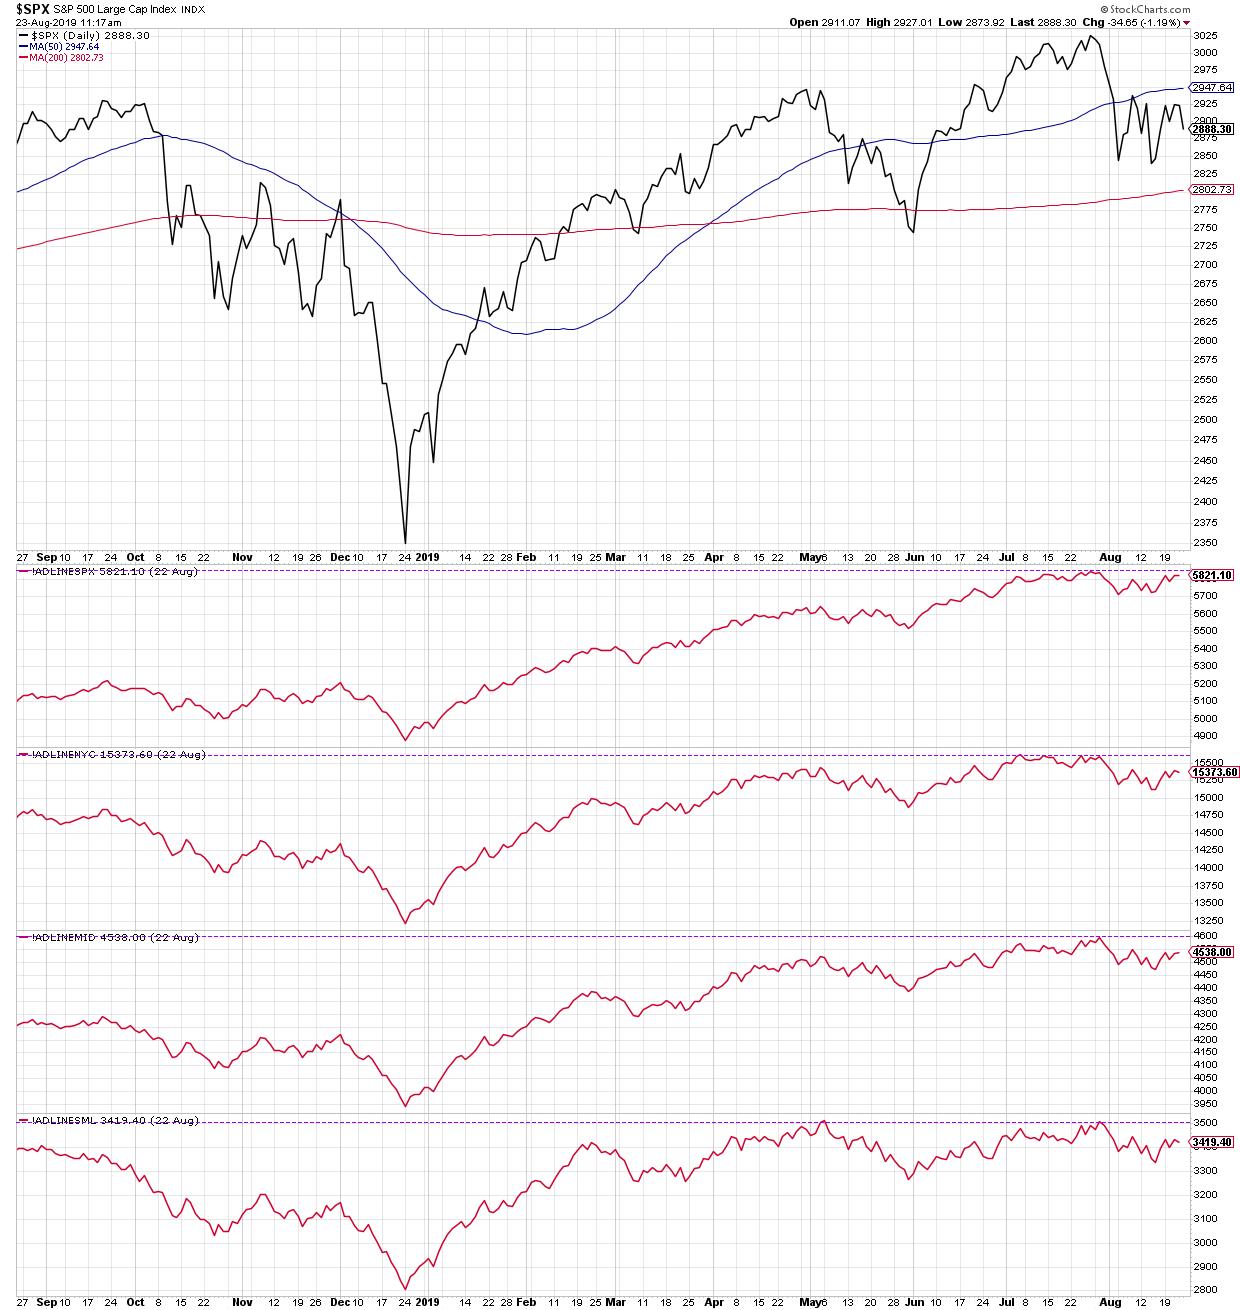
The One Chart: Banking on Breadth

by David Keller,
President and Chief Strategist, Sierra Alpha Research
Any time I have a chance to interview other market strategists, I like to ask them about their One Chart. That is, "What's the one chart that you think is the best tell on the markets right now."
To rephrase, if you could only have one...
READ MORE
MEMBERS ONLY

State of the Stock Market - Meet Mr. Split
by Arthur Hill,
Chief Technical Strategist, TrendInvestorPro.com
The performance for the S&P 500, S&P Mid-Cap 400 and S&P Small-Cap 600 over the last 3, 6, 9 and 12 months pretty much says it all. The S&P 500 is positive on all four timeframes, the S&P Small-Cap 600...
READ MORE
MEMBERS ONLY
Summing Up The Transportation Group And Its Impact
by Tom Bowley,
Chief Market Strategist, EarningsBeats.com
Market Recap for Thursday, August 22, 2019
U.S. equities began Thursday on mostly a positive note, but reservations from Fed officials and a manufacturing report that showed weakness weighed on sentiment as stocks gave back earlier gains, finishing mixed. The Dow Jones was able to end the session in...
READ MORE
MEMBERS ONLY

Technology Could Hold the Key Going Forward
by Arthur Hill,
Chief Technical Strategist, TrendInvestorPro.com
As noted in a separate commentary, the State of the Stock Market is shaky. The Technology sector is holding up, but we are seeing weakness within Finance, Consumer Discretionary, Industrials and Communication Services. The Technology sector is the biggest sector in the S&P 500 SPDR (22%) and EW...
READ MORE
MEMBERS ONLY
Target And Lowes Deliver The Goods; Equities Surge
by Tom Bowley,
Chief Market Strategist, EarningsBeats.com
Market Recap for Wednesday, August 21, 2019
It was a big day for broadline retail ($DJUSRB, +1.91%) and home improvement ($DJUSHI, +3.68%) as strong earnings from Target (TGT, +20.43%) and Lowes Companies (LOW, +10.35%), respectively, sent both groups higher, along with the overall market. All of...
READ MORE
MEMBERS ONLY
Here Is a Leading Stock In The Semiconductor Group
by Julius de Kempenaer,
Senior Technical Analyst, StockCharts.com
Yesterday, I wrote about the Technology sector in my RRG Charts blog, where I discussed how the semiconductor stocks as a group showed relative strength against XLK. For this DITC article, I want to work off that subset of stocks in the technology space.
The Relative Rotation Graph above shows...
READ MORE
MEMBERS ONLY

If It's Trick Or Treat In The Equity Market, I'll Take The Treat
by Martin Pring,
President, Pring Research
* Trick or Treat for Global Equities?
* Several Reliable US Short-Term Indicators Turning Bullish
During my many decades in this business, I have never heard of a recession so well-advertised as the one we are witnessing currently. It's a fact that financial market events that are widely expected rarely...
READ MORE
MEMBERS ONLY
DP Mid-Week Alert: Dow Loses IT PMO Buy - Indicators Moving Bullish
by Erin Swenlin,
Vice President, DecisionPoint.com
The market continues to churn and consolidate sideways this week. The good news is that our indicators are starting to perk up. As of last Friday, the Dow generated a new IT Price Momentum Oscillator (PMO) SELL signal. Basically, the weekly PMO dropped below its signal on Friday. Amazingly, the...
READ MORE
MEMBERS ONLY
Tuesday's Weak Close Has Very Little Impact On Market Outlook
by Tom Bowley,
Chief Market Strategist, EarningsBeats.com
Market Recap for Tuesday, August 20, 2019
It was another day of consolidation for U.S. equities. That's not a bad thing. Let's establish a base, allowing the weak hands to get out before the next push higher. If we break those recent lows, we'...
READ MORE
MEMBERS ONLY
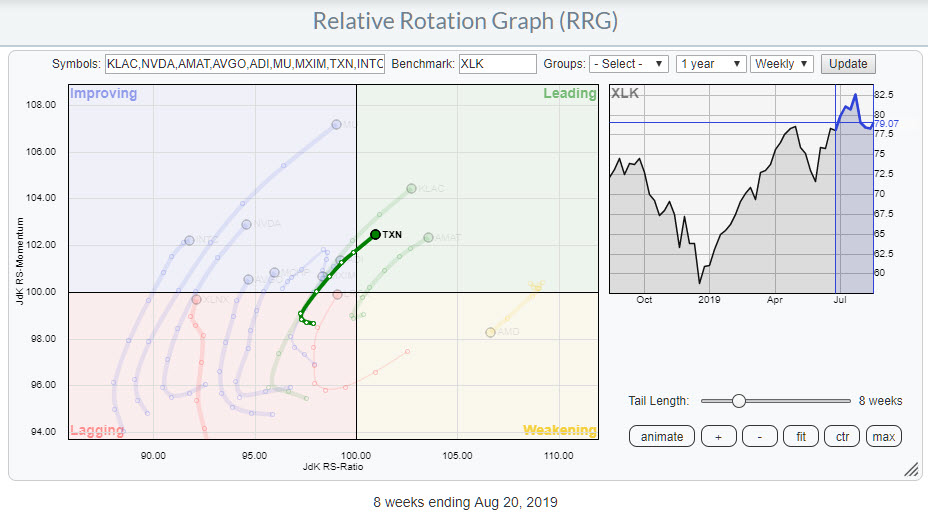
Strong Rotation for Technology Sector With a Positive RRG-Heading on Semiconductors
by Julius de Kempenaer,
Senior Technical Analyst, StockCharts.com
On the weekly Relative Rotation Graph, the Technology sector is currently inside the weakening quadrant, but is moving almost vertically up towards the leading quadrant. That is to say, it's moving back to the leading quadrant, as it already completed a strong rotation through that leading quadrant from...
READ MORE
MEMBERS ONLY
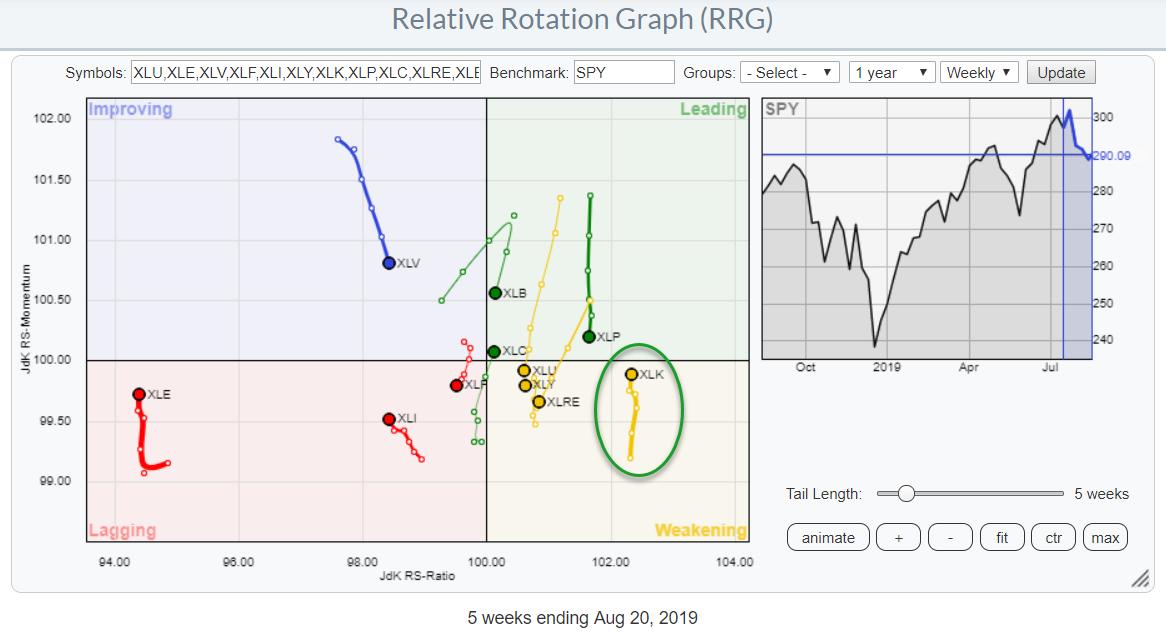
Mirror, Mirror on the Wall, What's the Strongest Industry Group ETF of All?
by Arthur Hill,
Chief Technical Strategist, TrendInvestorPro.com
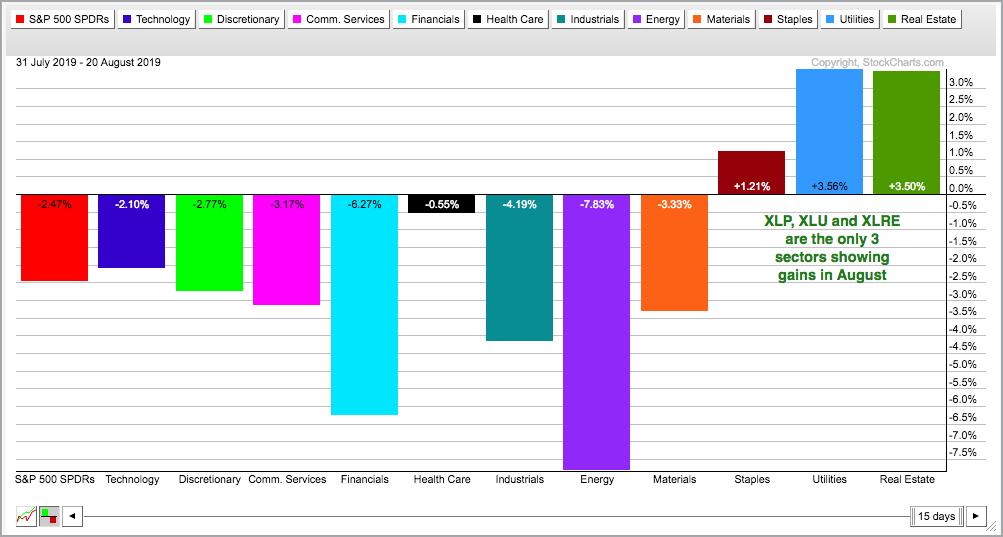
Taking a top-down approach to the stock market, we can break down the major indexes into sectors, the sectors into industry groups and the industry groups into individual stocks. There are eleven sector SPDRs and three clear leaders. The Utilities SPDR (XLU) and Real Estate SPDR (XLRE) hit new highs...
READ MORE
MEMBERS ONLY
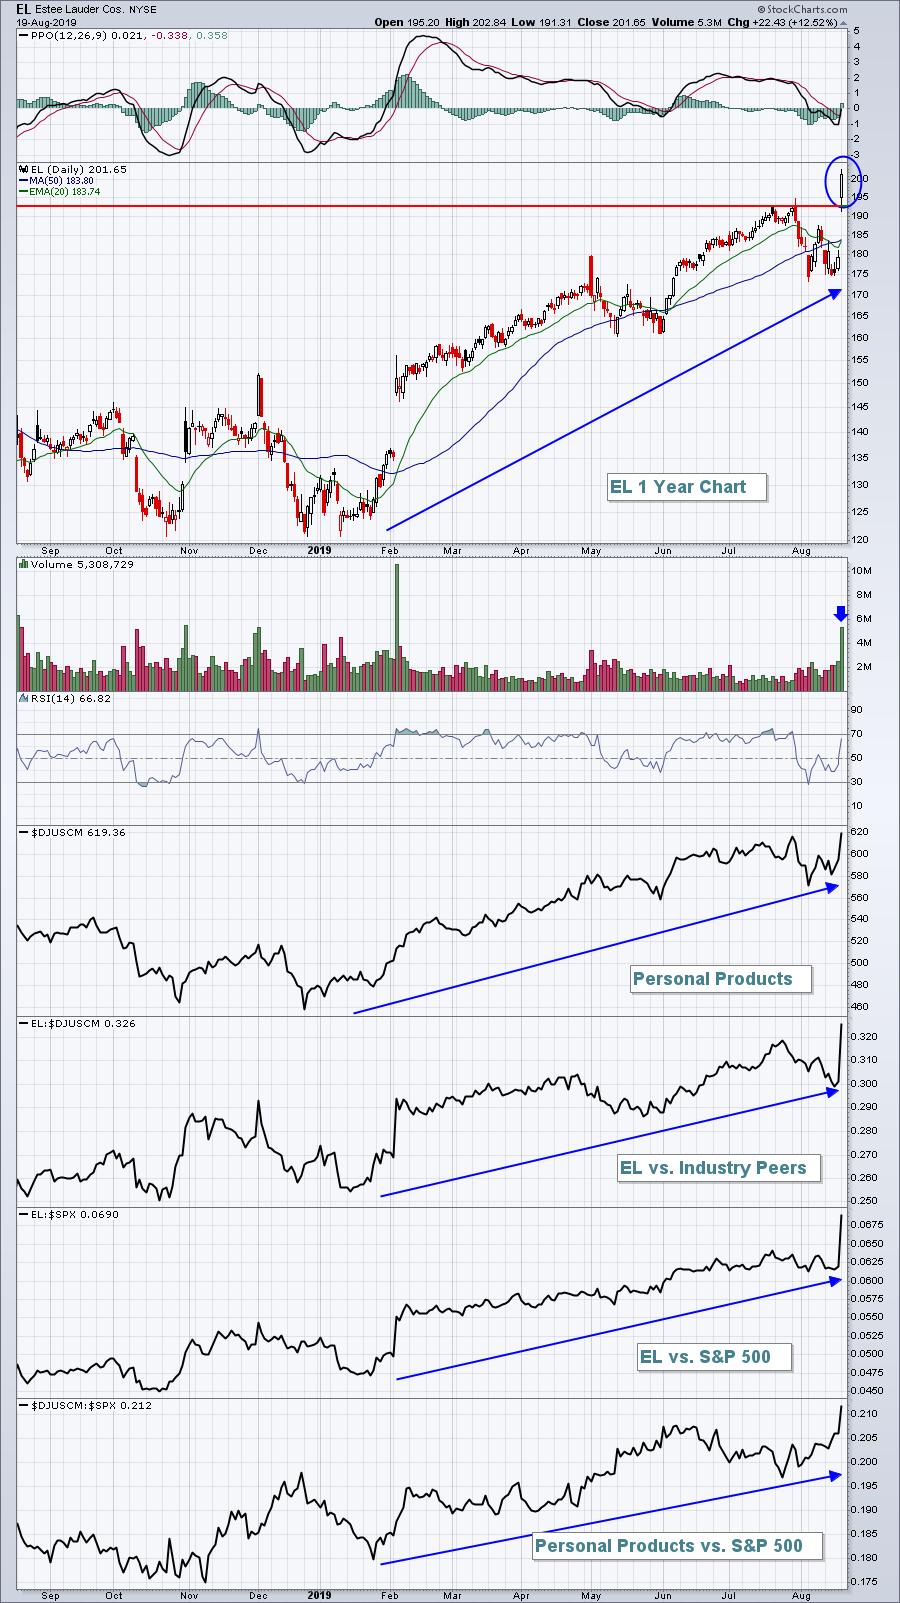
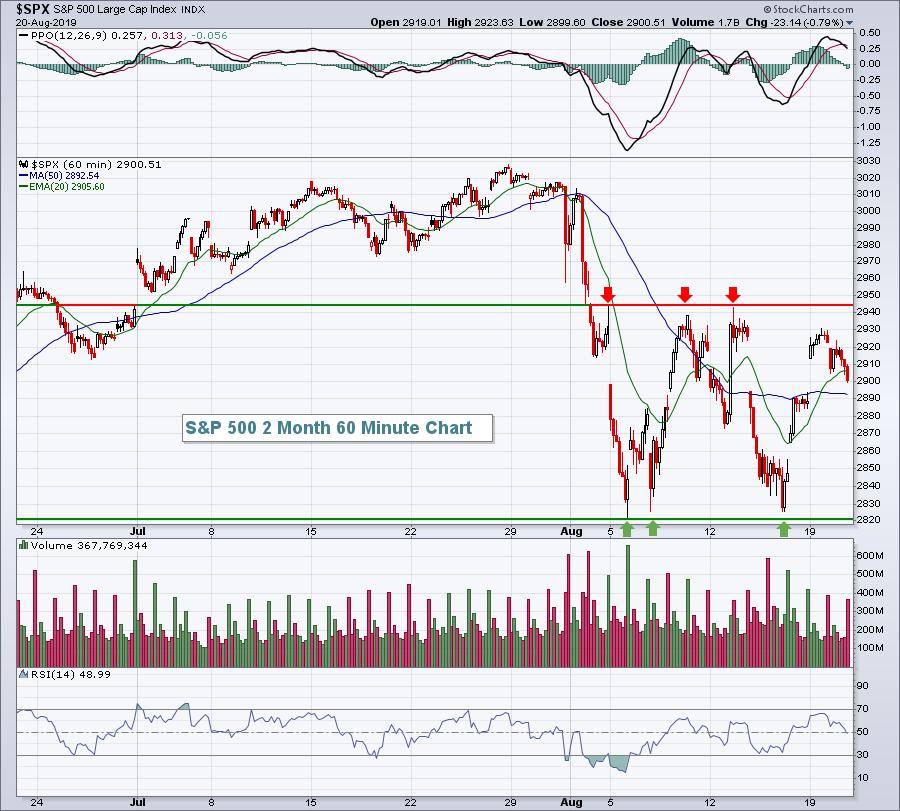
A Birds-Eye View Of The S&P 500 Weekly Chart; The Bulls Are In Charge
by Tom Bowley,
Chief Market Strategist, EarningsBeats.com
Market Recap for Monday, August 19, 2019
The S&P 500 rallied for a third consecutive day, this time rising 1.21% and closing back above its 20 day EMA for the first time in August. The other major indices also rallied, including leadership from the NASDAQ and Russell...
READ MORE
MEMBERS ONLY
Measuring Risk On/Off with Stocks, Treasuries, Junk Bonds, Low Volatility and High Beta
by Arthur Hill,
Chief Technical Strategist, TrendInvestorPro.com
Volatility is clearly on the uptick with the S&P 500 SPDR (SPY) moving more than 1% nine times since July 31st. This follows a period from early June to late July when the 1-day Rate-of-Change exceeded 1% just once, and the market moved steadily higher. Ah, the good...
READ MORE