MEMBERS ONLY

STOCKS BUILD ON YESTERDAY'S UPSIDE INTRA-DAY REVERSAL -- THE DOW CONTINUES REBOUND OFF 200-DAY AVERAGE -- SO DO INDUSTRIALS AND FINANCIALS -- BANKS BOUNCE OFF SUPPORT -- SO DO SMALL CAPS AND TRANSPORTS -- VIX FALLS BACK BELOW 20 LEVEL

by John Murphy,
Chief Technical Analyst, StockCharts.com
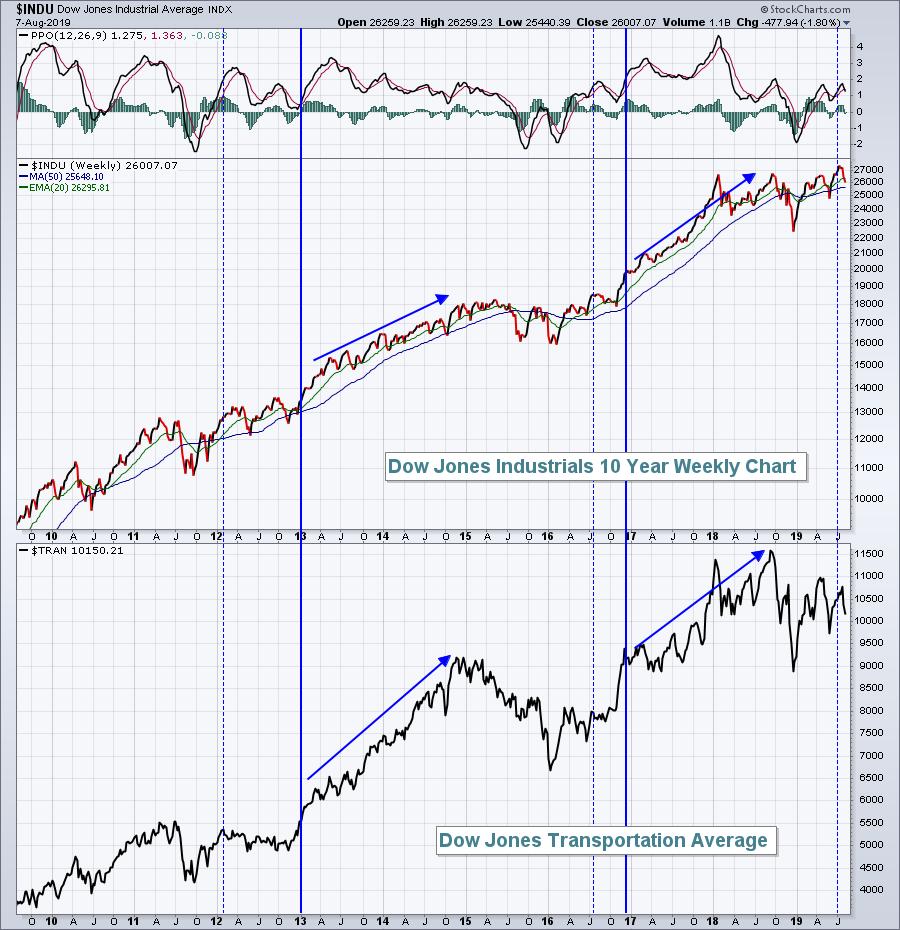
STOCK INDEXES CONTINUE REBOUND...Yesterday's impressive intra-day rebound in stocks is continuing into today's trading.Chart 1 shows the Dow Industrials surviving a test of its 200-day moving average yesterday; and building on that today. That's an encouraging sign. But it still needs to...
READ MORE
MEMBERS ONLY

DP Mid-Week Alert: Possible Silver Lining on the Short-Term Horizon

by Erin Swenlin,
Vice President, DecisionPoint.com
It's been a difficult week for the markets since the last publication of the Mid-Week Alert and the knife is falling fast. However, I'm putting my hands out there right now to catch it based on signs of life on our short-term indicators. The market is...
READ MORE
MEMBERS ONLY
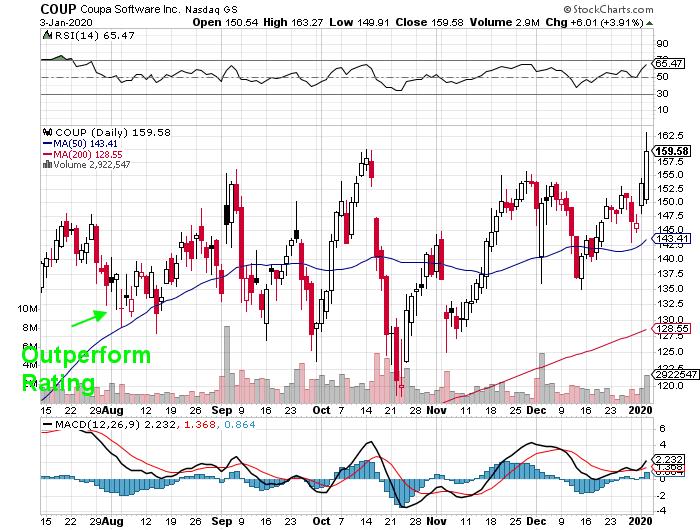
This Is How To Pick Relative Strength Stocks To Improve Your Performance

by Tom Bowley,
Chief Market Strategist, EarningsBeats.com
Market Recap for Wednesday, August 7, 2019
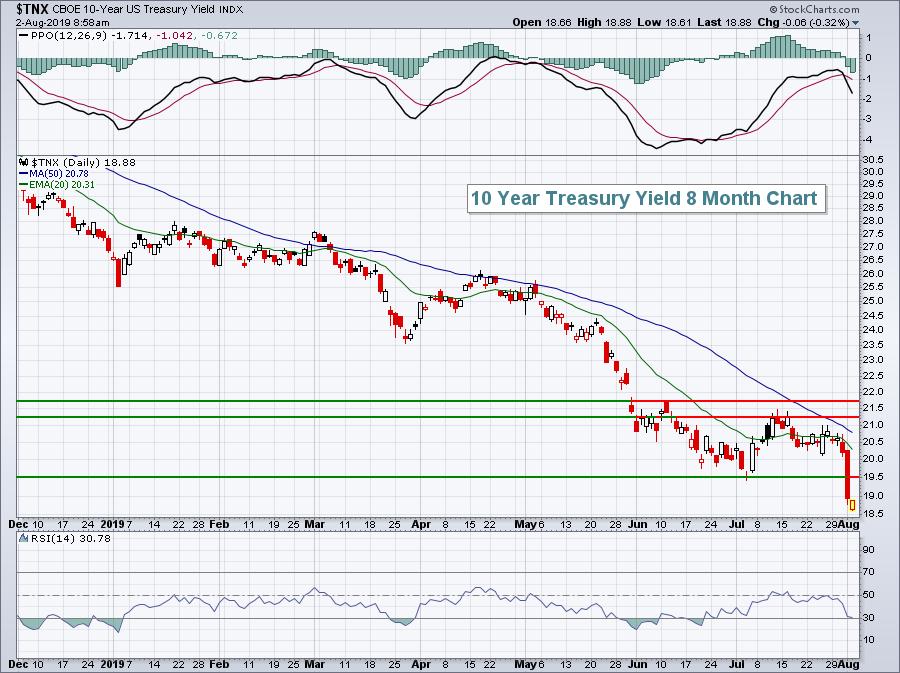
It appeared as though we were heading for another big down day as our major indices opened down 2% or thereabouts. There was a huge rush into treasuries with the 10 year treasury yield ($TNX) dropping to an almost unfathomable 1.59% shortly...
READ MORE
MEMBERS ONLY
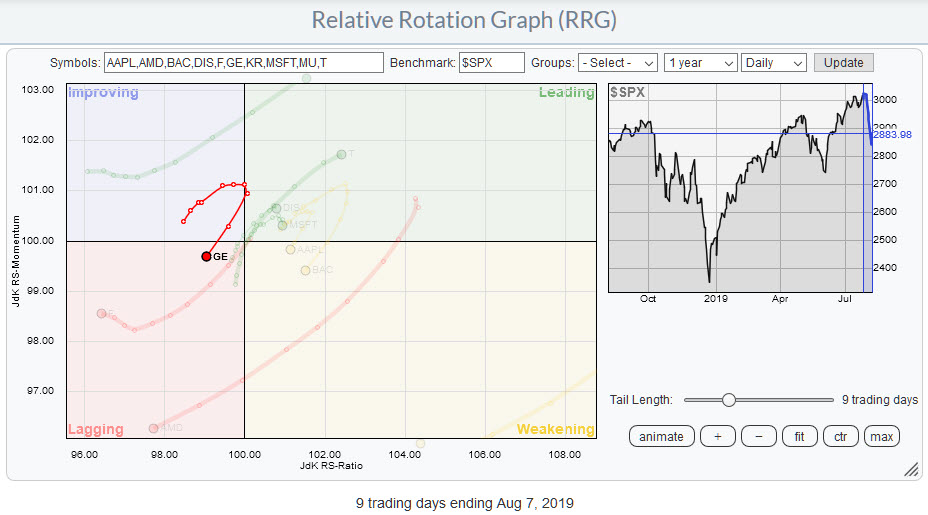
GE is Doing It Again!

by Julius de Kempenaer,
Senior Technical Analyst, StockCharts.com
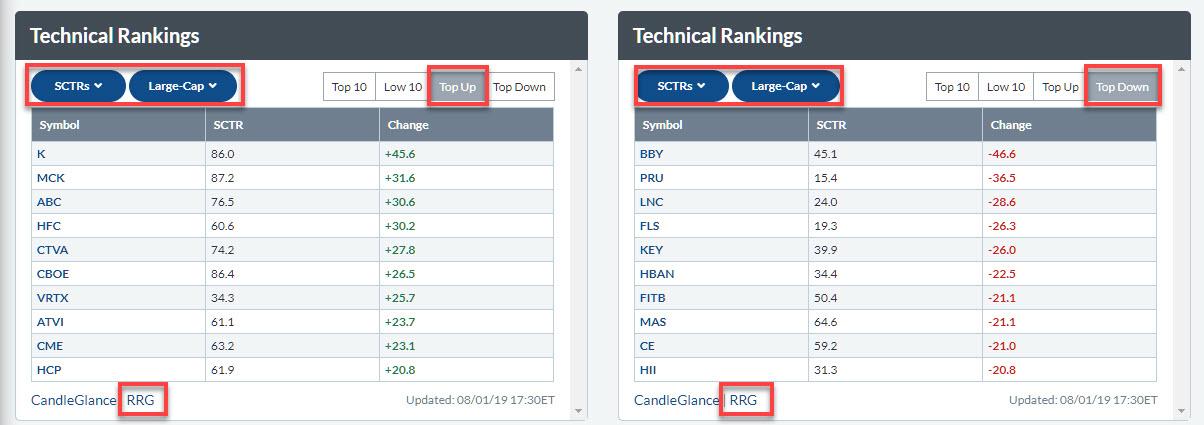
A good way for you to check what has been driving a particular market is to go to the "Market Movers" widget on your dashboard and select the universe that you are interested in.
To the right, I have printed the table showing the top 10 most active...
READ MORE
MEMBERS ONLY

Seven Lucky Indicators Starting To Look Bullish

by Martin Pring,
President, Pring Research
* Three Short-Term Oscillators Positioned for a Rally
* Two Psychological Indicators Looking Bullish
* Just When You Thought Bonds Would Go Up Forever
Usually, it takes a long time for some of the indicators to reach what we might call "deep fear" levels, points from which important rallies can be...
READ MORE
MEMBERS ONLY

DOW INDUSTRIALS TEST THEIR 200-DAY LINE -- BANKS FALL BELOW THEIR RED LINE BUT ARE TESTING SUPPORT -- SMALL CAPS AND TRANSPORTS DO THE SAME -- VIX INDEX IS TESTING ITS MAY HIGH
by John Murphy,
Chief Technical Analyst, StockCharts.com
DOW TESTS 200-DAY AVERAGE...Chart 1 shows the Dow Industrials testing their 200-day moving average (red line). The 14-day RSI line has dipped below 30 signalling a short-term oversold condition. That's the first important test of support for the Dow.
BANKS HAVE A BAD DAY...Falling bond yields...
READ MORE
MEMBERS ONLY

STOCKS DROP EVEN FURTHER AS BOND YIELDS PLUNGE -- THREE MORE CENTRAL BANKS LOWER RATES -- MONEY CONTINUES TO FLOW INTO SAFE HAVEN GOLD AND JAPANESE YEN -- U.S. STOCKS LOOK MORE VULNERABLE -- 200-DAY MOVING AVERAGES ARE BEING THREATENED
by John Murphy,
Chief Technical Analyst, StockCharts.com
S&P 500 STILL LOOKS VULNERABLE...U.S. stocks are under pressure again today. Another plunge in global bond yields is undermining confidence in the global economy. Three more foreign central banks lowered rates today in New Zealand, India, and Thailand. That's feeding the "race to...
READ MORE
MEMBERS ONLY

Lockheed Martin Holds the Line

by Arthur Hill,
Chief Technical Strategist, TrendInvestorPro.com
Stocks were hit hard in August with the S&P 500 SPDR (SPY) moving below its 50-day line and mid July lows. Stocks and ETFs that did not break their 50-day lines and held above their mid July lows are showing relative "chart" strength. Lockheed Martin (LMT)...
READ MORE
MEMBERS ONLY
The S&P 500 Must Clear These 3 Levels
by Tom Bowley,
Chief Market Strategist, EarningsBeats.com
Market Recap for Tuesday, August 6, 2019
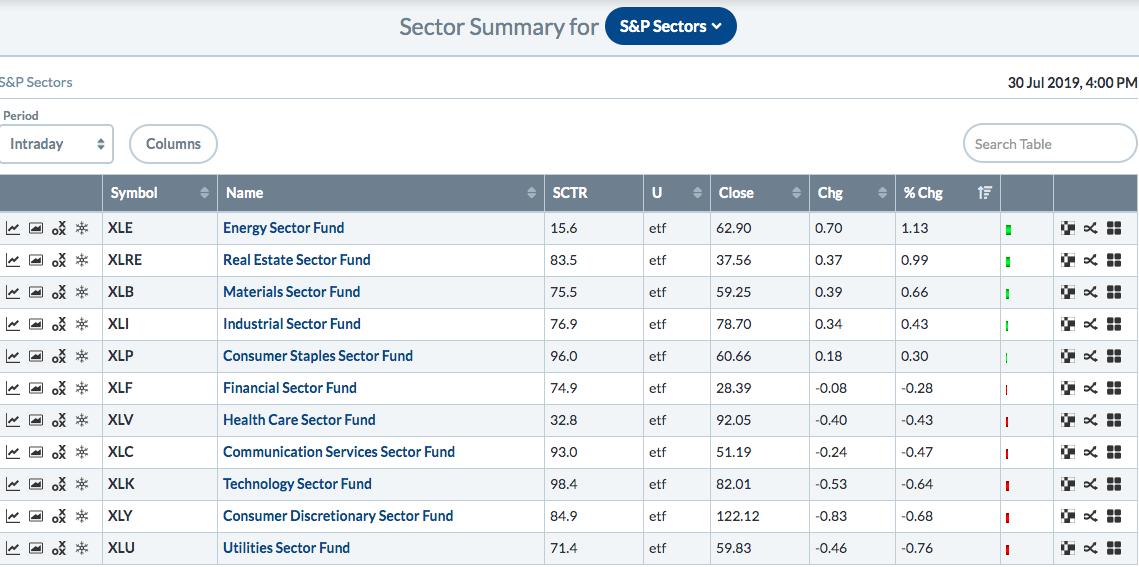
Ok, let's start with the good news. Our major indices all finished higher on Tuesday, rebounding from their worst day of 2019. Every sector except energy (XLE, -0.12%) finished the day higher and our 5 aggressive sectors were the 5...
READ MORE
MEMBERS ONLY
This is My Trendline, Which One is Yours?
by Julius de Kempenaer,
Senior Technical Analyst, StockCharts.com
Never a dull moment when it comes to the markets. Just when you thought you had it all figured out, Mr. Market throws us another curve-ball that we all have to deal with.
The last few days have been pretty hectic, given a 200-point drop in the S&P...
READ MORE
MEMBERS ONLY

STOCK MARKET NEEDS BROADER SECTOR PARTICIPATION -- SIX MARKET SECTORS HAVE YET TO HIT A NEW HIGH-- THREE THAT HAVE ARE DEFENSIVE IN NATURE -- ENERGY IS THE YEAR'S WEAKEST SECTOR
by John Murphy,
Chief Technical Analyst, StockCharts.com
SECTOR BREADTH ISN'T BROAD ENOUGH...One of the ways to measure the strength of the stock market's uptrend is to see how many of its eleven sectors have hit new highs with the major stock indexes. In a strong uptrend, most market sectors should be confirming...
READ MORE
MEMBERS ONLY
Selloffs Are All About Emotion; Watch These Sentiment Readings
by Tom Bowley,
Chief Market Strategist, EarningsBeats.com
Market Recap for Monday, August 5, 2019
It was a very bad day on Wall Street with our major indices having their worst day of 2019. Panic is setting in as the U.S. and China shoot trade war bullets back and forth at each other. China's Shanghai...
READ MORE
MEMBERS ONLY
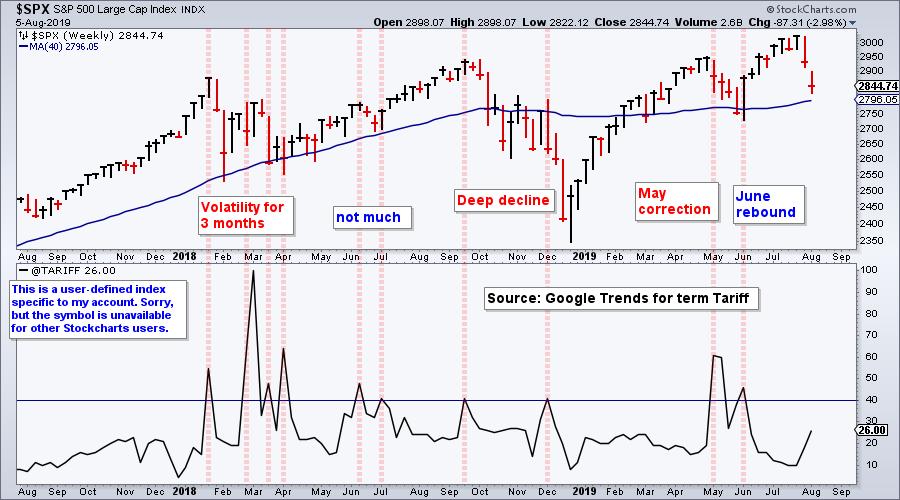
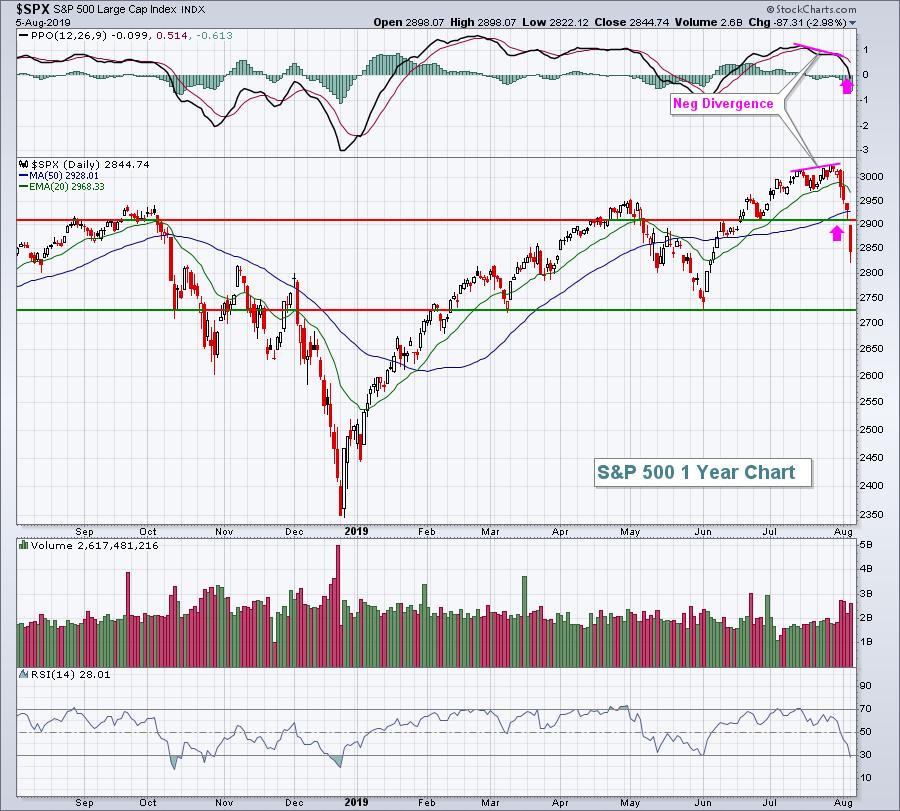
Charting Tariffs, Putting the Decline into Perspective and Considering a Mean-Reversion Bounce
by Arthur Hill,
Chief Technical Strategist, TrendInvestorPro.com
Stocks were pummeled on Monday with the S&P 500 falling the most (2.98%) since December 2018. The Russell 2000 and Nasdaq 100 also fell more than 3% with widespread selling pressure. I am not going to start the blame game (tariffs, the Fed, early August seasonal patterns,...
READ MORE
MEMBERS ONLY
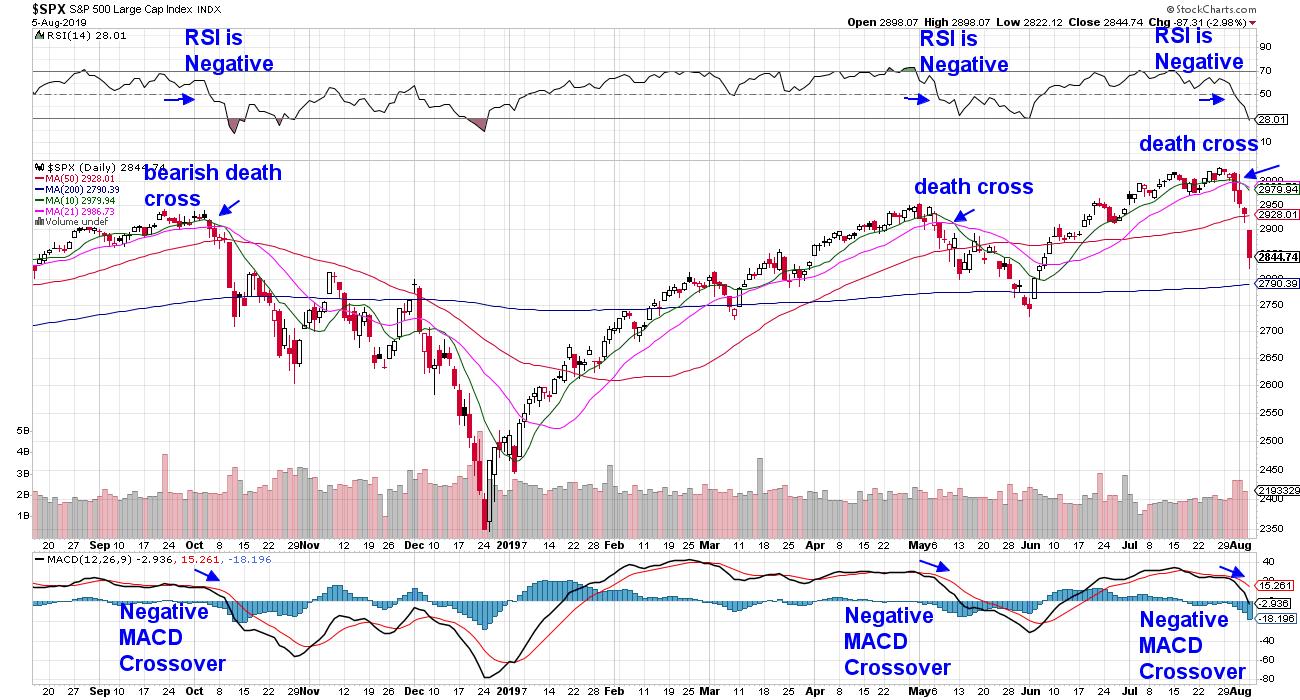
Momentum Shift: Death Cross Is Pointing To More Downside

by Mary Ellen McGonagle,
President, MEM Investment Research
The broader markets have taken quite a hit over the last several days. While some indicators are close to being in oversold positions, the upside momentum may well have shifted.
One signal that identifies this is the Death Cross, as it is called. A death cross is generated when a...
READ MORE
MEMBERS ONLY
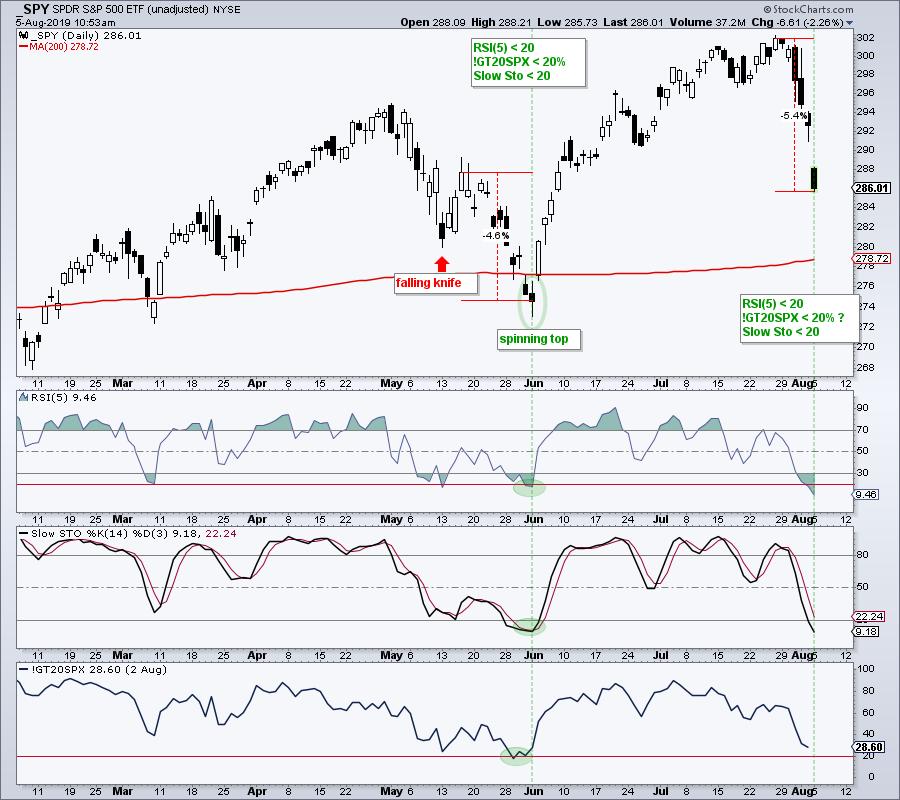
Three Indicators to Measure Oversold Conditions in SPY
by Arthur Hill,
Chief Technical Strategist, TrendInvestorPro.com
The S&P 500 SPDR (SPY) is down sharply this morning and over the last six days. The ETF hit a new all time high less than two weeks ago and remains above its 200-day SMA, and its early June low. This suggests that the long-term trend remains up....
READ MORE
MEMBERS ONLY

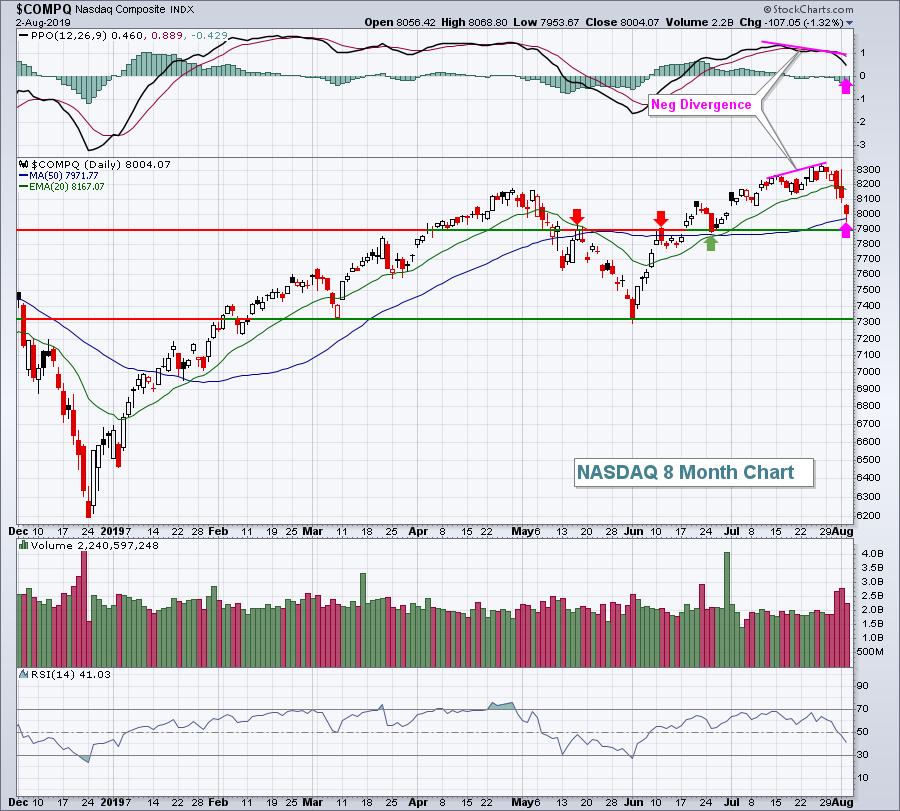
CHINESE YUAN TUMBLES TO LOWEST LEVEL SINCE 2008 -- STOCKS DROP AROUND THE WORLD -- MAJOR U.S. STOCK INDEXES MAY BE HEADED TOWARD THEIR 200-DAY AVERAGES -- EMERGING MARKETS ISHARES ARE THREATENING THEIR MAY REACTION LOW
by John Murphy,
Chief Technical Analyst, StockCharts.com
CHINA DEVALUES YUAN IN RESPONSE TO NEW TARIFFS...It didn't take long for China to retaliate against last Thursday's announcement of a new U.S. tariffs on Chinese imports starting on September 1. Those tariffs are a tax on Chinese imports which raises their price. Today&...
READ MORE
MEMBERS ONLY
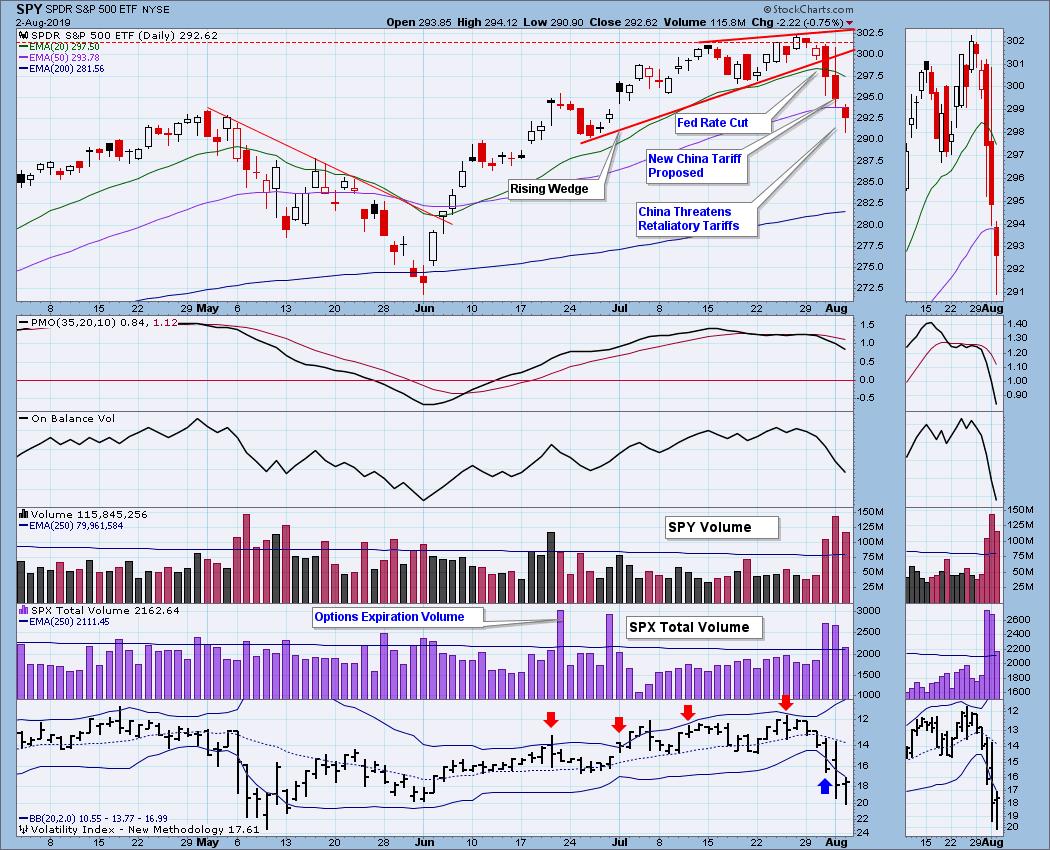
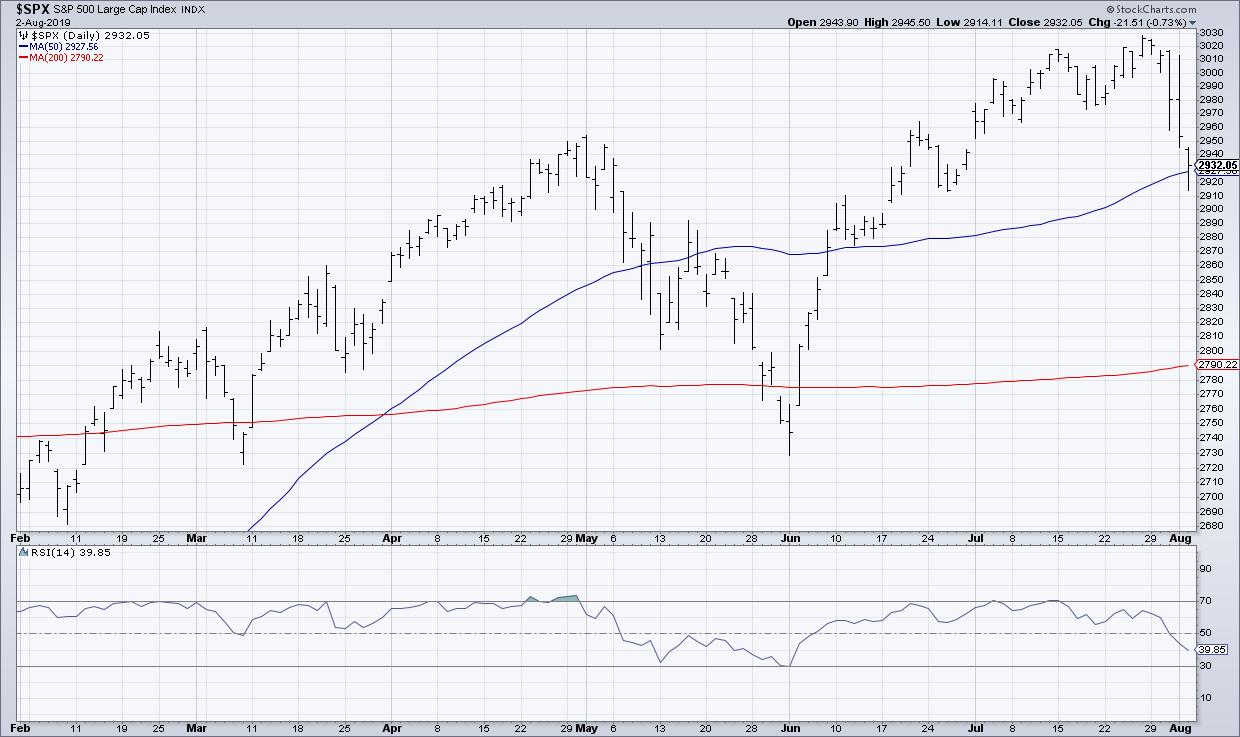
Growing Cautious Is Fine, But I'd Avoid Being Bearish
by Tom Bowley,
Chief Market Strategist, EarningsBeats.com
Market Recap for Friday, August 2, 2019
The latest nonfarm payrolls report came in, but quite honestly no one seemed to care. The Fed has already said its piece and was rather noncommittal to another rate cut and both bond and equity markets are fixated on the US-China trade war....
READ MORE
MEMBERS ONLY
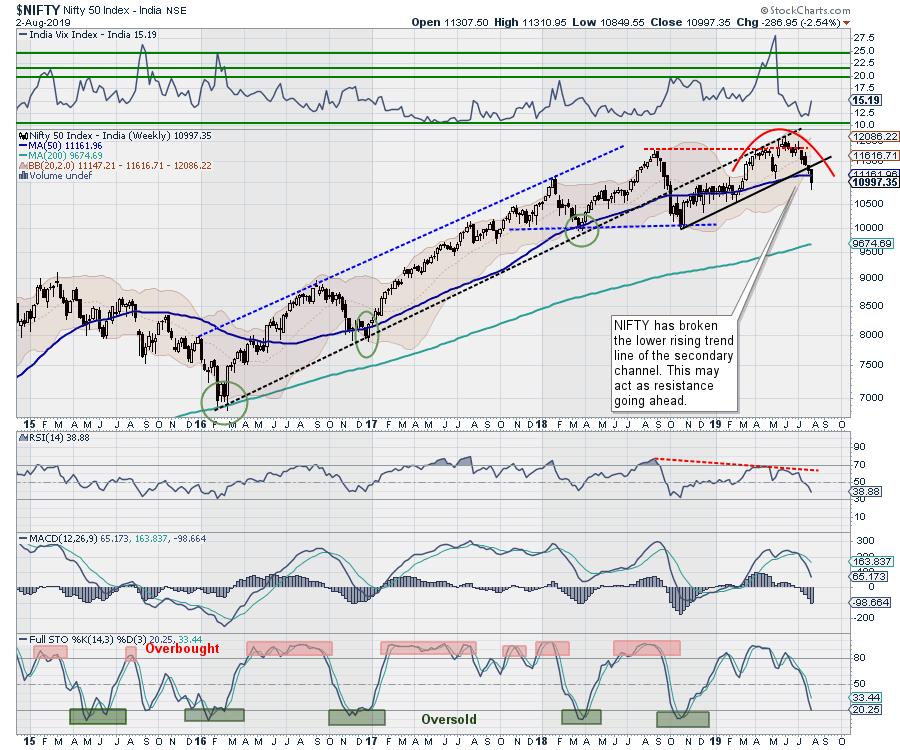
Week Ahead: Pullbacks May Occur, But These Signs Suggest Broader Technical Structure Damaged

by Milan Vaishnav,
Founder and Technical Analyst, EquityResearch.asia and ChartWizard.ae
The end of the previous week saw the NIFTY taking support at its 50-Week MA but making a downward breach on the downside from the secondary channel, which was formed after the NIFTY breached the primary uptrend in October 2018. The week that went by saw the index extending its...
READ MORE
MEMBERS ONLY

Is It A Short-Term Correction or The Start of a Bear Market?
by Martin Pring,
President, Pring Research
* Two Indicators That are Not Yet Oversold
* Several Confidence Ratios are at the Brink
* Global Equities Probably Need to Test Their 200-day MA
In the third week of July, I wrote an article entitled "Is It Time For A Contra Trend Correction?" (currently unavailable). Initially, the market thumbed...
READ MORE
MEMBERS ONLY

S&P 500 STILL NEAR RECORD TERRITORY BUT LOOKING VULNERABLE -- WEEKLY INDICATORS SHOW LOSS OF UPSIDE MOMENTUM -- ALL COUNTRY WORLD INDEX IS MEETING RESISTANCE AT ITS EARLY 2018 PEAK -- WHILE FOREIGN STOCK INDEX IS STALLING AT ITS 62% RETRACEMENT LEVEL
by John Murphy,
Chief Technical Analyst, StockCharts.com
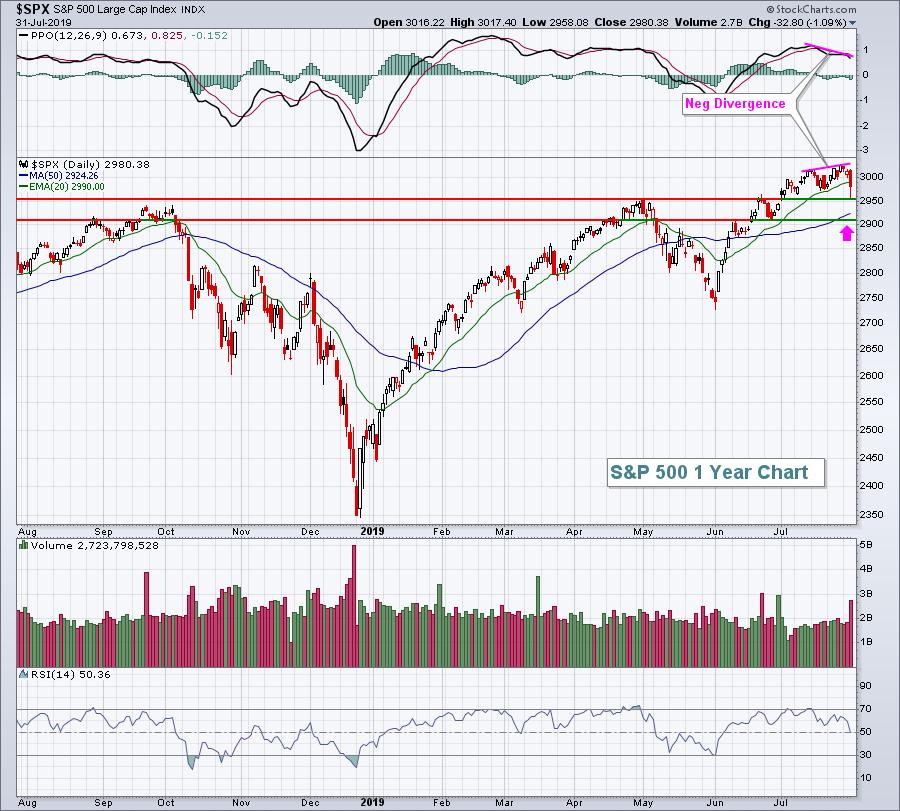
S&P 500 UPTREND MAY BE TESTED...Global weakness has become a major theme for financial markets. Even the Fed's so-called "data dependence" relies more on developments in foreign economies and markets. That includes falling foreign interest rates which are pulling bond yields down in...
READ MORE
MEMBERS ONLY
Bearish Breadth Thrusts and Short-term Support Breaks could Signal Start of Corrective Period
by Arthur Hill,
Chief Technical Strategist, TrendInvestorPro.com
Stocks were hit with some of the strongest selling pressure since December as the S&P 500 fell 3.10% and the Nasdaq 100 fell 4.04%. These weekly declines were the largest since mid December. The Russell 2000 held up the best with a 2.87% decline, which...
READ MORE
MEMBERS ONLY
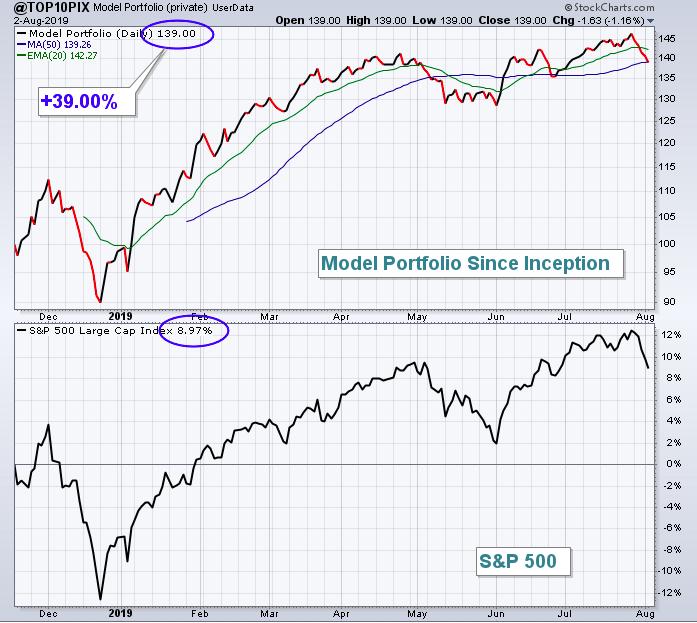
My Philosophy: Creating Portfolios To Beat The Benchmark S&P 500
by Tom Bowley,
Chief Market Strategist, EarningsBeats.com
(This is a reprint of a Trading Places blog article written a week ago. I've updated the performance and charts to include last week's selloff.)
Beating the S&P 500 is my #1 goal. If I didn't believe I could beat the S&...
READ MORE
MEMBERS ONLY
Stocks Bucking The Selloff - Pockets Of Strength In A Difficult Week
by Mary Ellen McGonagle,
President, MEM Investment Research
The bears were awakened last week following Fed Chair Powell's remarks, as well as Trump's trade war tweets. Both events brought the markets to their knees, with each of the major indices pulling back to their 50-day moving averages.
Despite the negative action in the broader...
READ MORE
MEMBERS ONLY
Defining a Bull or Bear Market Using a Two-Way Test
by Martin Pring,
President, Pring Research
Editor's Note: This article was originally published in Martin Pring's Market Roundup on Tuesday, July 30th at 1:14pm ET.
Technical Analysis is an art form, one in which we put together several reasonably reliable indicators and form a weight-of-the-evidence opinion about the status of the...
READ MORE
MEMBERS ONLY
DP WEEKLY WRAP: Was Technical Analysis At All Helpful This Week?

by Carl Swenlin,
President and Founder, DecisionPoint.com
While I work, I watch a business news channel with the sound turned down. It's not really a necessary activity, it's just what I do. One of the things I notice is that the commentators try to attribute news items to every market twitch, and most...
READ MORE
MEMBERS ONLY
Three Charts Clarify a Cautious Outlook for Stocks

by David Keller,
President and Chief Strategist, Sierra Alpha Research
"Never confuse brains with a bull market."
When the market is going higher and the average stock is appreciating, we often attribute the gains to our skill as investors. Due to our incredible investing prowess, we have managed to own stocks that are doing well!
However, when the...
READ MORE
MEMBERS ONLY
Using SCTRs to Fill Your Relative Rotation Graph
by Julius de Kempenaer,
Senior Technical Analyst, StockCharts.com
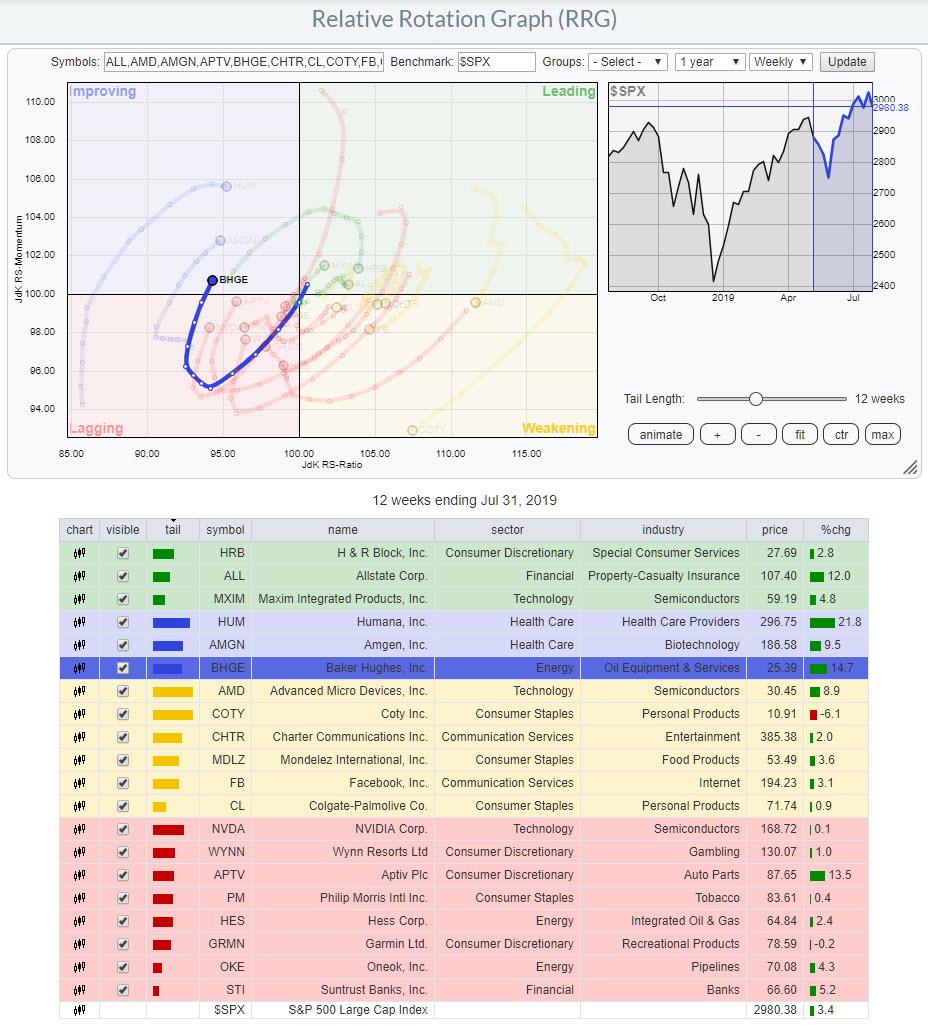
In my latest "Don't Ignore This Chart" article, I used a Relative Rotation Graph holding 20 stocks as a starting point to find an interesting-looking rotation and a possible trading opportunity for BHGE. The question: how was I able to select those 20 stocks to include...
READ MORE
MEMBERS ONLY

Martin Pring's Monthly Market Roundup 2019-08-02
by Martin Pring,
President, Pring Research
The monthly Market Roundup video for August is now available.
Good luck and good charting,
Martin J. Pring
The views expressed in this article are those of the author and do not necessarily reflect the position or opinion of Pring Turner Capital Group of Walnut Creek or its affiliates....
READ MORE
MEMBERS ONLY

FALLING COMMODITIES ARE HURTING THE AUSSIE AND CANADIAN DOLLARS -- THAT'S HELPING BOOST THE DOLLAR -- BOND YIELDS AND COMMODITIES ARE LINKED -- AND ARE FALLING TOGETHER -- THAT WARNS OF GLOBAL ECONOMIC WEAKNESS WITH CONTINUED LOW INFLATION
by John Murphy,
Chief Technical Analyst, StockCharts.com
AUSSIE AND CANADIAN DOLLARS ARE TIED TO COMMODITIES...Two major events this past week have highlighted the need to view things from a global perspective. Mr. Powell on Wednesday emphasized that the Fed was lowering its short-term rate to partially offset weakness in foreign markets. President Trump yesterday announced new...
READ MORE
MEMBERS ONLY

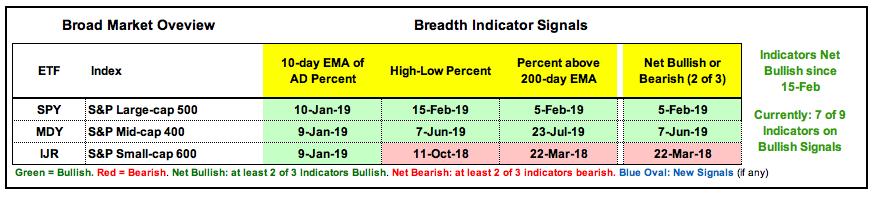
The State of the Stock Market - Short and Long Term Breadth Signals
by Arthur Hill,
Chief Technical Strategist, TrendInvestorPro.com
Today I am going to dive into breadth by looking at two indicator groups used for short-term market timing and three indicator groups for long-term market timing. Most of you are familiar with these indicators: AD Percent, Up/Down Volume%, High-Low Percent and %Above 200-day EMA. Stocks fell on Wednesday...
READ MORE
MEMBERS ONLY
Three Tweets And You're OUT
by Tom Bowley,
Chief Market Strategist, EarningsBeats.com
Market Recap for August 1, 2019
Today's article will be very brief.
The whole Fed deal and now another trade tweet. Really? Can we all just get along? It reminds me of that old Jackson 5 song, Rockin Robin (sing along if you'd like....and yes...
READ MORE
MEMBERS ONLY

BOND YIELDS PLUNGE TO NEW LOWS -- STOCK RALLY FADES ON CHINA TARIFF THREAT -- DOLLAR WEAKENS AS YEN AND GOLD REBOUND -- CRUDE OIL TUMBLES 7% -- FALLING YIELDS HURT FINANCIALS
by John Murphy,
Chief Technical Analyst, StockCharts.com
BOND YIELDS PLUNGE...A threat of new tariffs on China starting September 1 is contributing to this afternoon's plunge in bond yields. And lower stock prices. Chart 1 shows the 10-Year Treasury yield plunging 13 basis points to the lowest level since 2016. Even more surprising is a...
READ MORE
MEMBERS ONLY

A RISING DOLLAR LOWERS U.S. INFLATION BY PUSHING COMMODITY PRICES LOWER -- FALLING EUROPEAN CURRENCIES ARE PUSHING THE DOLLAR HIGHER -- FALLING BOND YIELDS IN THE UK AND EUROZONE ARE PULLING TREASURY YIELDS DOWN -- 10-YEAR BOND YIELD DROPS BELOW 2.00%
by John Murphy,
Chief Technical Analyst, StockCharts.com
A RISING DOLLAR IS KEEPING COMMODITY INFLATION DOWN...One of the reasons given by the Fed for lowering rates yesterday was to boost inflation. But the dollar hit the highest level in a year right after the rate cut. That's because foreign central bankers in Asia and Europe...
READ MORE
MEMBERS ONLY
BHGE Rapidly Improving and Ready to Jump
by Julius de Kempenaer,
Senior Technical Analyst, StockCharts.com
Here's a Relative Rotation Graph filled with stocks that I got off my StockCharts.com dashboard this morning:
Your Dashboard is a great way to get an overview of what's going on in the market and organize your workflow on the site. If you are interested...
READ MORE
MEMBERS ONLY
Fed Lowers Rates, But Creates Utter Confusion; Thanks For Nothing
by Tom Bowley,
Chief Market Strategist, EarningsBeats.com
Market Recap for Wednesday, July 31, 2019
To say that this current Fed is transparent would be the equivalent of saying I'm a marine biologist (a Seinfeldism for those of you that are fans). What the heck are they doing? Seriously, what is going on in those meetings?...
READ MORE
MEMBERS ONLY
Monthly Chart Review | SELL Signals on Major Indexes | Double-Top on SPX
by Erin Swenlin,
Vice President, DecisionPoint.com
While the Fed didn't do anything unexpected, market participants were not excited about the language of Chairman Powell. The 10-minute bar chart below shows the spike in volume that finished the day, which is the biggest volume finish in the past two weeks. The question is whether it...
READ MORE
MEMBERS ONLY

STOCKS SELL OFF AFTER QUARTER POINT RATE CUT -- DOLLAR INDEX HITS NEW HIGH FOR THE YEAR WHICH PUSHED GOLD LOWER -- A RISING DOLLAR MAKES IT HARDER FOR THE FED TO BOOST INFLATION
by John Murphy,
Chief Technical Analyst, StockCharts.com
STOCKS WEAKEN...Stocks sold off on today's Fed accouncement. Or, more accurately, during the press conference afterwards based on some confusing responses from Jerome Powell regarding the reasons for today's rate cut, or whether more cuts are coming. The first three charts show three major stock...
READ MORE
MEMBERS ONLY
Traders Await Fed, Apple Blows Away Estimates
by Tom Bowley,
Chief Market Strategist, EarningsBeats.com
Market Recap for Tuesday, July 30, 2019
For a second straight day, traders opted for safety ahead of today's FOMC policy statement. It was once again apparent in the sector leaderboard, which ended the session on Tuesday as follows:
Industrials (XLI, +0.43%) became the first aggressive sector...
READ MORE
MEMBERS ONLY
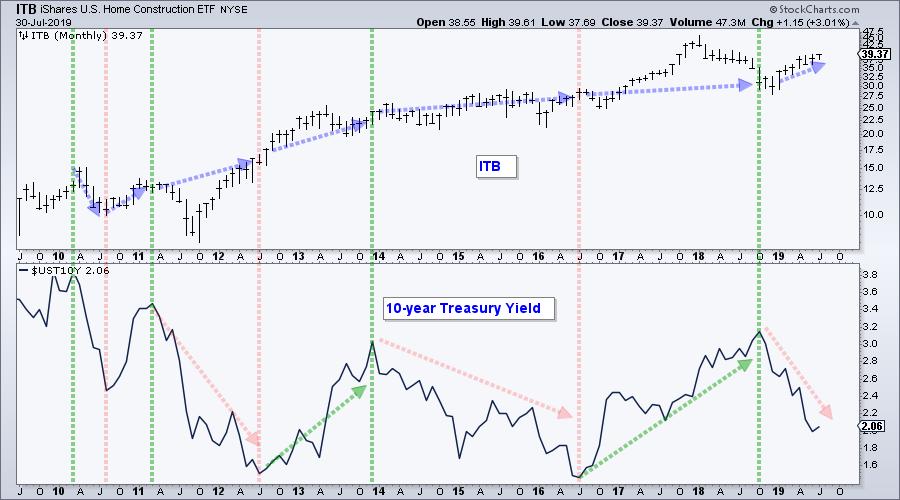
The Fed, Treasury Yields, Housing and a Bullish Continuation Pattern
by Arthur Hill,
Chief Technical Strategist, TrendInvestorPro.com
After an extended tightening cycle, the Fed is set to lower rates for the first time since December 2008 (yawn). It seems easy to equate easier Fed policy as bullish for housing, but the relationship between Treasury yields and the Home Construction iShares (ITB) is not as clear cut. First...
READ MORE
MEMBERS ONLY

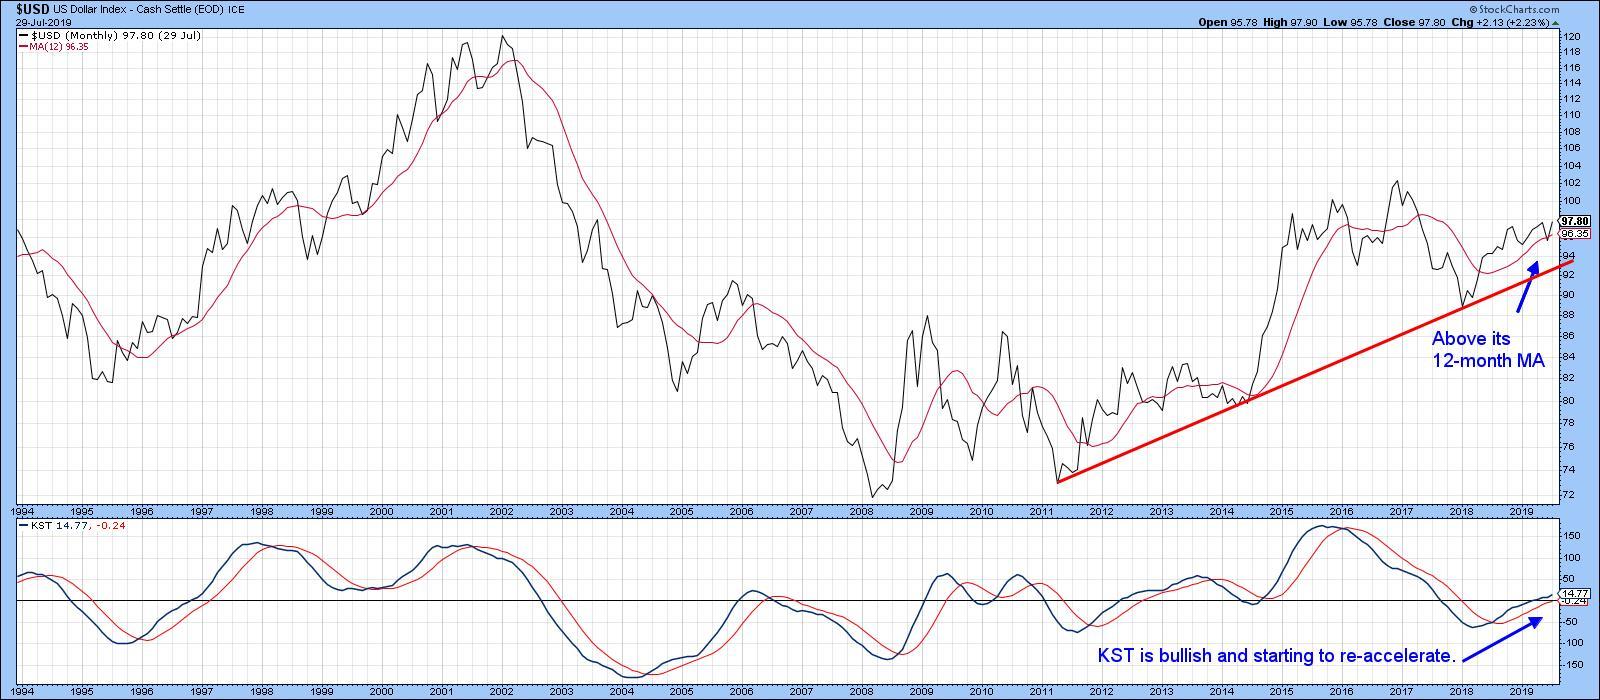
Tricky Dollar Is Still In A Bull Market
by Martin Pring,
President, Pring Research
* Defining a Bull or Bear Market Using a Two-Way Test
* Applying the Test to the Dollar
* The Euro and the Pound
Defining a Bull or Bear Market Using a Two-Way Test
Technical Analysis is an art form, one in which we put together several reasonably reliable indicators and form a...
READ MORE