MEMBERS ONLY
Lock Into A Strengthening Industry For Great Earnings Results

by Tom Bowley,
Chief Market Strategist, EarningsBeats.com
It works like a charm. Wall Street places their bets ahead of earnings season, then the solid results pour in. Shocking? Not really. That's a big advantage to have - to be able to meet with management teams ahead of earnings reports (before the "quiet period") to...
READ MORE
MEMBERS ONLY

DP Daily Diamonds - Small-Caps Dominate Scans - A Look At Seasonality Too!

by Erin Swenlin,
Vice President, DecisionPoint.com
Recently, I received an email from a reader who basically said he found that, if he traded in a bull market, he made money, whereas when he traded in a choppy or bear market, he lost money. The lesson learned is that, despite the best attempts to find the best...
READ MORE
MEMBERS ONLY
DP Daily Diamonds - Bull Flags Appearing on Daily and Weekly Charts
by Erin Swenlin,
Vice President, DecisionPoint.com
Scan results were a mixed bag of different sectors today. The charts that I found the most interesting were those that had some bullish flag formations. Not every stock today is showing that bull flag formation, but the others still look enticing. I'm personally holding off on adding...
READ MORE
MEMBERS ONLY

Global Indexes Just Below Major Breakout Points

by Martin Pring,
President, Pring Research
* The Dow Jones and MSCI World Stock Indexes/ETF Poised to Move Higher
* Rest of the World Emerging
* Europe, Japan and Emerging Markets Looking Positive
The Dow Jones and MSCI World Stock Indexes/ETF Poised to Move Higher
US indexes have rallied sharply in the last week, but so have...
READ MORE
MEMBERS ONLY

DP Show: Anniversary of 1929 and 1987 Crashes - Does History Tell Us to Expect the Same?
by Erin Swenlin,
Vice President, DecisionPoint.com

by Carl Swenlin,
President and Founder, DecisionPoint.com
In this episode of DecisionPoint, Erin covered the major indexes and DP indicators, taking a deeper look at the Rydex Ratio (which is showing very bearish sentiment in place). Meanwhile, with this week marking the anniversary of both the 1929 and 1987 market crashes, Carl took us back in time...
READ MORE
MEMBERS ONLY
MEM Edge TV: Take Advantage of Shifts in Strength

by Mary Ellen McGonagle,
President, MEM Investment Research
On this episode of StockCharts TV's The MEM Edge, Mary Ellen reviews new areas showing critical strength and the ways in which you can capitalize. Additionally, she discusses stocks that are setting up nicely going into earnings, as well as those that have already reported. This episode originally...
READ MORE
MEMBERS ONLY

S&P 500 NEARS TEST OF OVERHEAD RESISTANCE -- TRANSPORTS ARE OFF TO A STRONG START -- FINANCIALS LEAD MARKET HIGHER -- BANK OF AMERICA MAY BE BREAKING OUT -- STATE STREET SURGES -- STRONG FINANCIALS MAY BE BOOSTING SMALL CAPS

by John Murphy,
Chief Technical Analyst, StockCharts.com
STOCK INDEXES NEAR OLD HIGH...Stocks around the world are trading higher this morning. Chart 1 shows the S&P 500 nearing a test of a trendline drawn over its July/September highs. All other major stock indexes are also trending higher. A big drop in Boeing (BA), however,...
READ MORE
MEMBERS ONLY
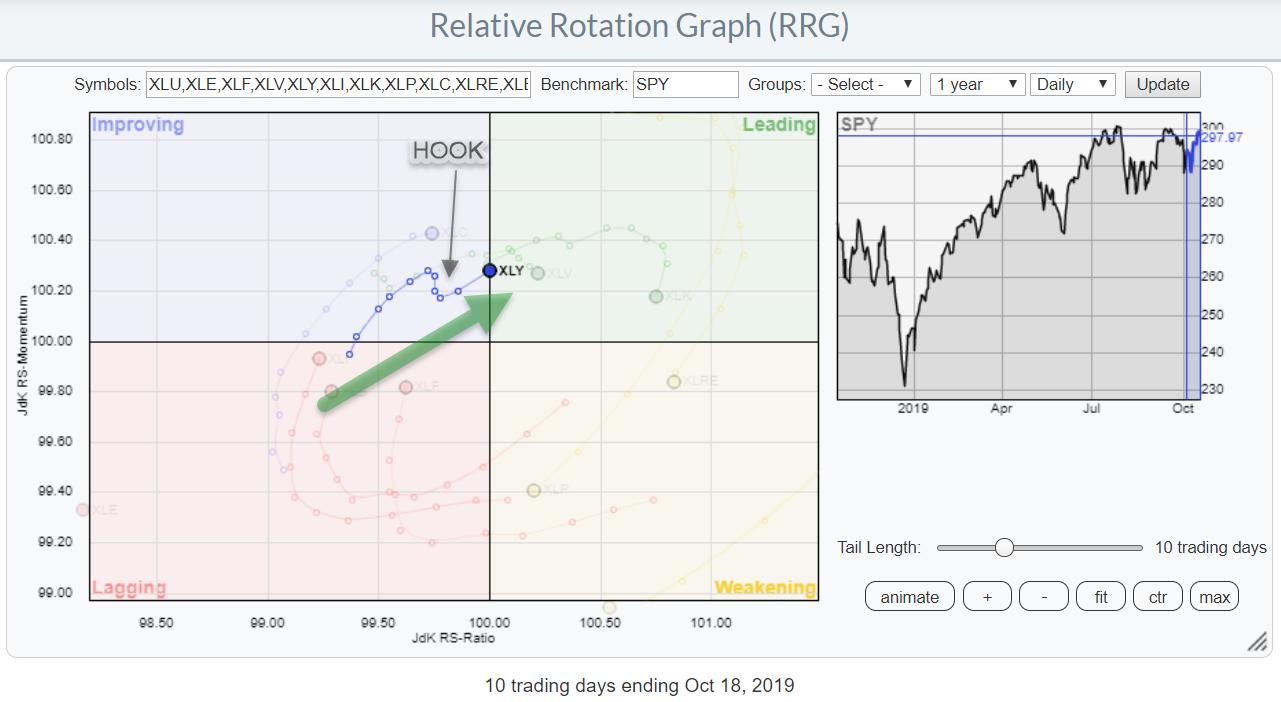
Consumer Discretionary On the Verge of Crossing Over Into The Leading Quadrant on RRG

by Julius de Kempenaer,
Senior Technical Analyst, StockCharts.com
The RRG chart above shows the relative position for US sectors based on last Friday's close.
The sector that stands out most at the moment, at least for me, is Consumer Discretionary. After initially rolling over inside the improving quadrant, this sector "hooked" back on track...
READ MORE
MEMBERS ONLY
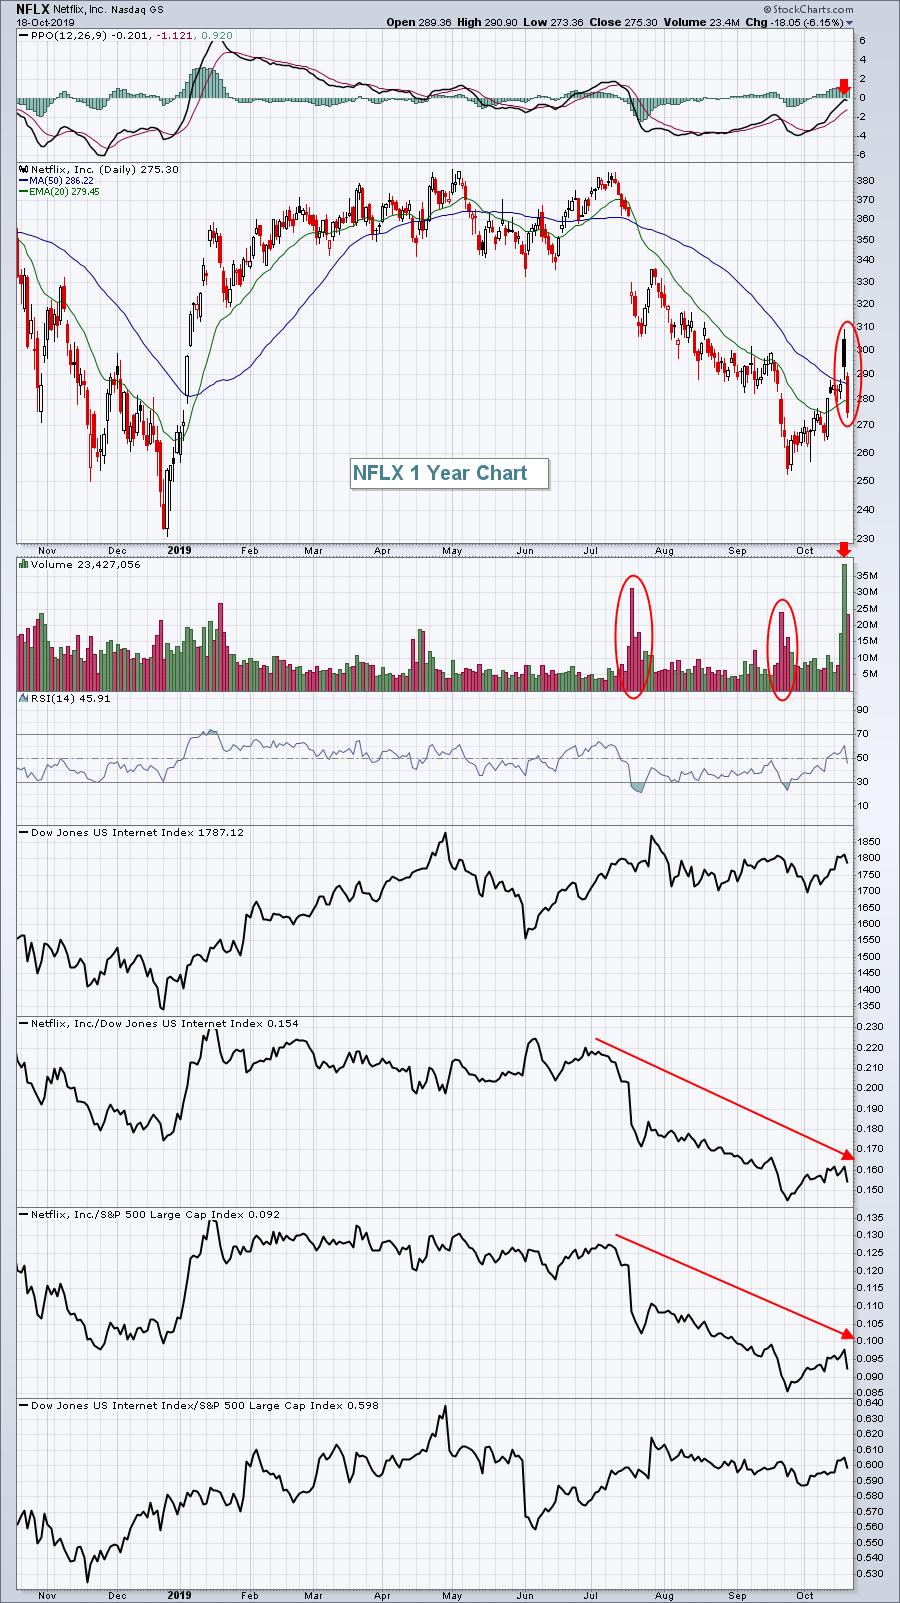
NFLX Dropped A Bomb, How Will The Other FAANG Stocks React To Earnings?
by Tom Bowley,
Chief Market Strategist, EarningsBeats.com
There's been a lot said and written about the struggles of the FAANG stocks. Don't let any of it fool you. The only FAANG stock reeling in my view is Netflix (NFLX). In last week's "Q3 Earnings Sneak Preview", I said I...
READ MORE
MEMBERS ONLY
Dividends Rule!

by Bruce Fraser,
Industry-leading "Wyckoffian"
Growth stocks and Income (Value) stocks often perform in opposition to each other. When the growth theme is strong, the value theme is lagging. On a secular scale two time periods come to mind. From about 1977-83 growth stocks dominated with the raging IPO market signaling the conclusion of...
READ MORE
MEMBERS ONLY
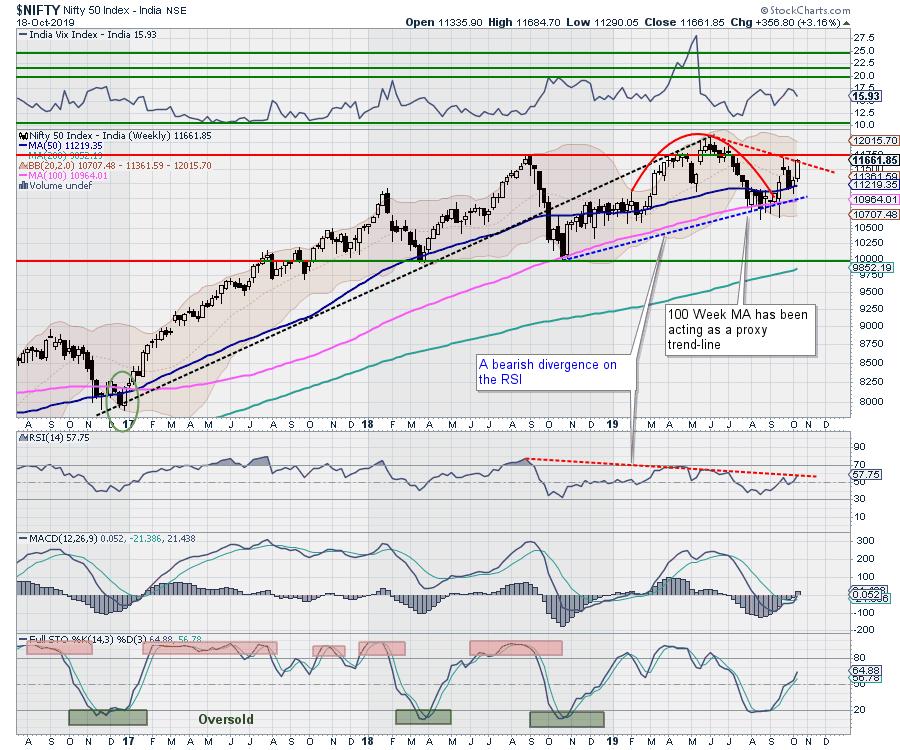
Week Ahead: This Zone Crucial for NIFTY to Navigate; Rotation Evident in Certain Sectors

by Milan Vaishnav,
Founder and Technical Analyst, EquityResearch.asia and ChartWizard.ae
The Indian equity markets had a strong week, making a steady upside move and ending the week with decent gains. In the week before this, the NIFTY had defended its crucial support levels of 200-DMA on the daily charts and the 50-Week MA on the weekly charts. After...
READ MORE
MEMBERS ONLY

A Mixed Market as Earnings Season Hits

by Arthur Hill,
Chief Technical Strategist, TrendInvestorPro.com
While the S&P 500 and large-caps hold up well, small-caps and mid-caps continue to trade mixed. This suggest that the average stock is trading mixed, some up and some down. Even though we are not in a bear market environment, stock picking is challenging right...
READ MORE
MEMBERS ONLY

Why Pick Stocks Over ETFs or Mutual Funds? My Personal Five Most Compelling Reasons

by Gatis Roze,
Author, "Tensile Trading"
Yes, this is personal. I'll share my own portfolio experiences from the past 25 years. Feel free to embrace those elements that strike you as most appropriate to your investing style.
First, a few ground-floor definitions before I get specific on the five reasons that motivate me...
READ MORE
MEMBERS ONLY
DP WEEKLY WRAP: Triple Top Now?
by Carl Swenlin,
President and Founder, DecisionPoint.com
The breakout above the short declining tops line last week was extended upward this week, and that has kind of messed up my double top scenario. Now it appears that a triple top may be in progress, and the expected outcome for that is really no different than for a...
READ MORE
MEMBERS ONLY
Earnings Season Presents TONS of Profit Opportunities

by John Hopkins,
President and Co-founder, EarningsBeats.com
On Friday morning, Tom Bowley, Chief Market Strategist of EarningsBeats.com, and Mary Ellen McGonagle, president of MEM Investment Research, conducted a webinar that included identifying stocks reporting earnings next week that could make significant moves. It was fascinating listening to these two seasoned pros as they displayed charts on...
READ MORE
MEMBERS ONLY

Few New Highs, but Even Fewer New Lows
by Arthur Hill,
Chief Technical Strategist, TrendInvestorPro.com
The lack of new highs may seem like a concern, but one cannot talk about new highs without also looking at new lows because there are two sides to the story. The S&P 500 is within 2% of an all time high and there were just 28 new...
READ MORE
MEMBERS ONLY
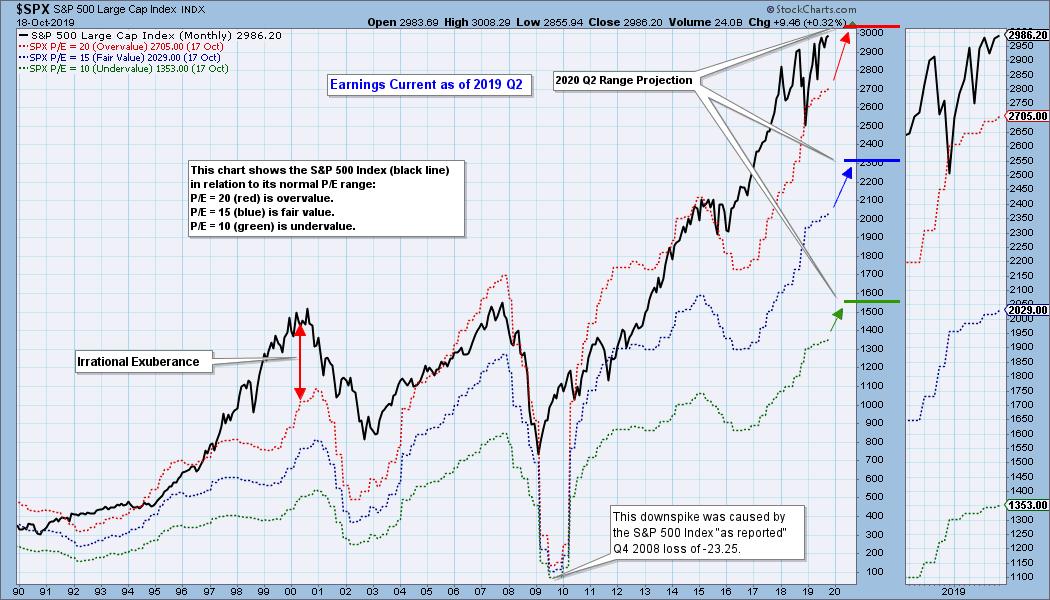
EARNINGS: 2019 Q2 Finalized; S&P 500 Still Overvalued
by Carl Swenlin,
President and Founder, DecisionPoint.com
The S&P 500 earnings for 2019 Q2 were finalized a few weeks ago. The following chart shows us the normal value range of the S&P 500 Index, indicating where the S&P 500 would have to be in order to have an overvalued P/E...
READ MORE
MEMBERS ONLY
The Dollar Has Fallen This Week Against the Euro and Pound
by John Murphy,
Chief Technical Analyst, StockCharts.com
Editor's Note: This article was originally published in John Murphy's Market Message on Friday, October 18th at 4:23pm ET.
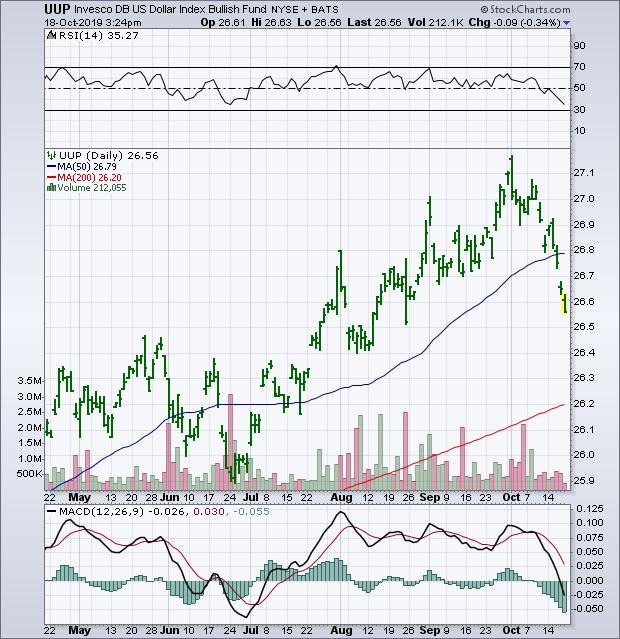
Chart 1 shows the Invesco US Dollar Index Fund (UUP) falling this week to the lowest level in two months. Most of that drop has come...
READ MORE
MEMBERS ONLY

THE DOLLAR HAS FALLEN THIS WEEK AGAINST THE EURO AND POUND -- BOTH CURRENCIES HAVE RALLIED ON HOPES FOR BREXIT SETTLEMENT -- EUROPEAN STOCK ETFS HAVE ALSO BEEN RISING -- THOSE GAINS, HOWEVER, COULD DEPEND ON SATURDAY VOTE IN PARLIAMENT
by John Murphy,
Chief Technical Analyst, StockCharts.com
DOLLAR FALLS AGAINST EURO AND POUND...Chart 1 shows the Invesco US Dollar Index Fund (UUP) falling this week to the lowest level in two months. Most of that drop has come against the Euro and British Pound. Chart 2 shows the British Pound rising to the highest level in...
READ MORE
MEMBERS ONLY
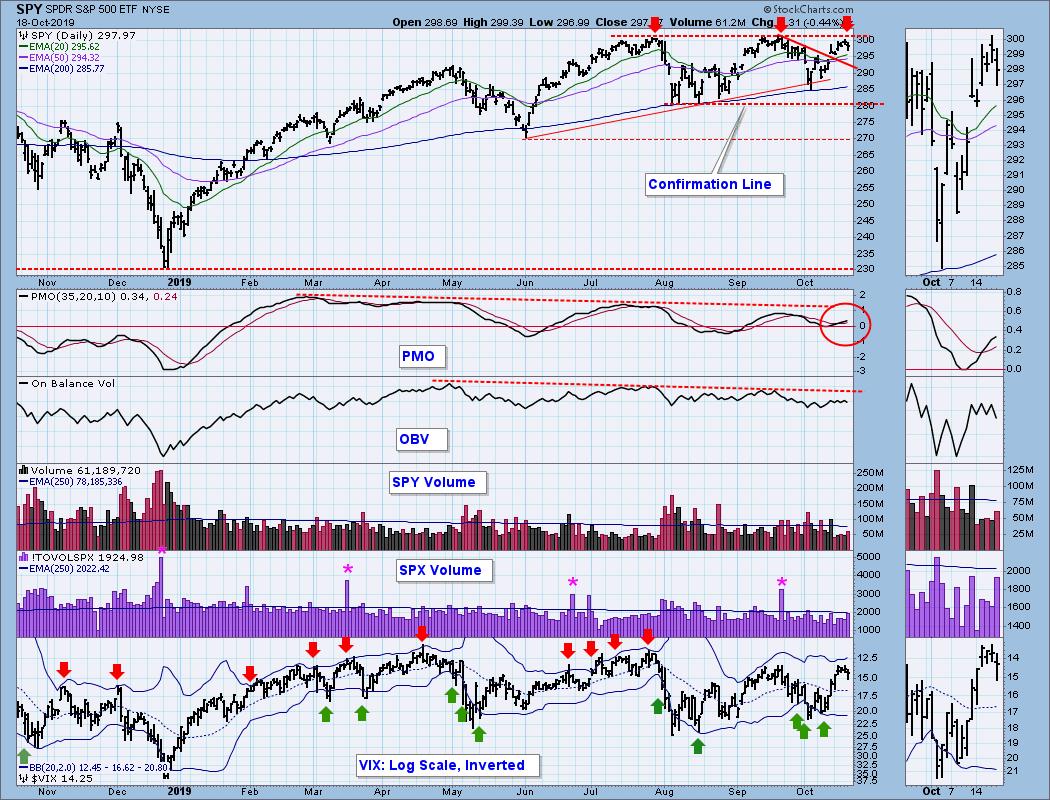
The State of the Stock Market - Waning Upside Momentum is Normal - A Special Announcement
by Arthur Hill,
Chief Technical Strategist, TrendInvestorPro.com
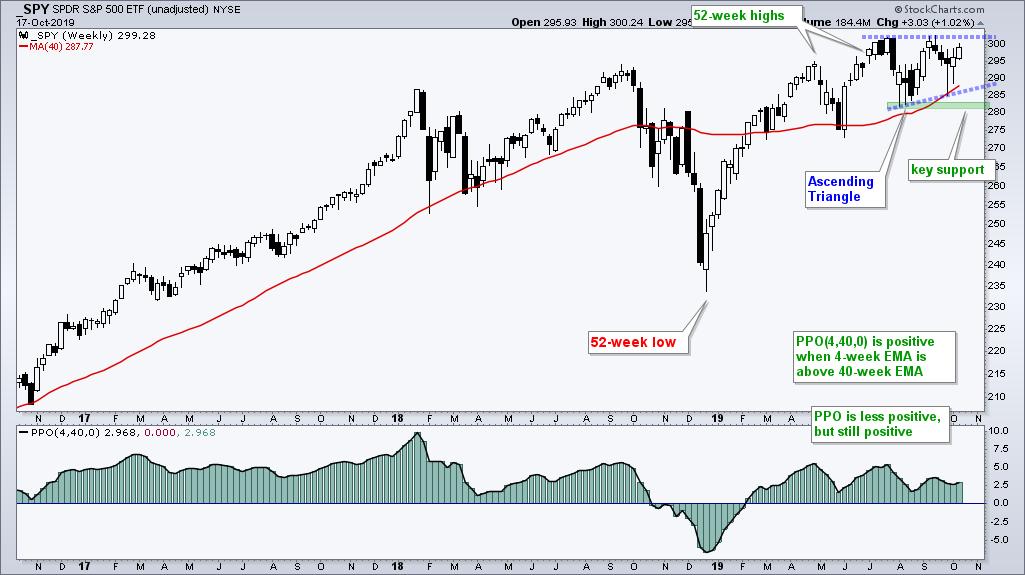
The S&P 500 SPDR (SPY) hit a new high in July and then moved into a trading range the last few months. Momentum turned down during this trading range and this is perfectly normal during a consolidation. Today will look at a weekly chart pattern taking shape and...
READ MORE
MEMBERS ONLY
Earnings-Related Gaps - How To Profit From Them
by Tom Bowley,
Chief Market Strategist, EarningsBeats.com
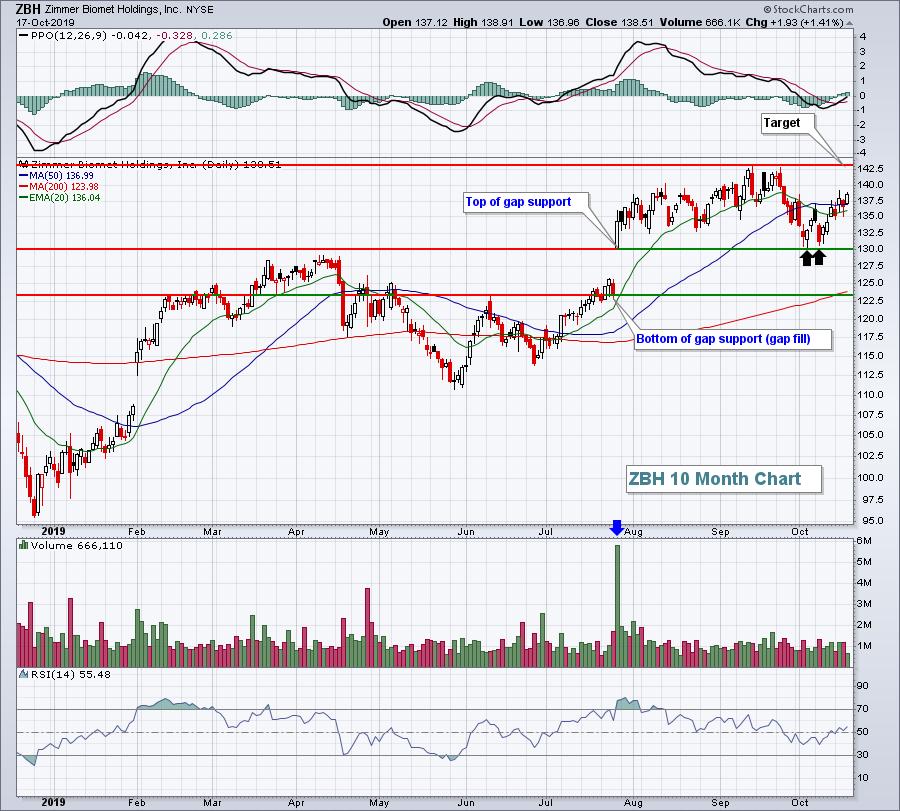
Earnings season is, by far, my favorite time of the year. It occurs four times a year and provides a significant number of trading opportunities if you know what you're looking for. My first piece of advice is this: Not all gaps are created equal. Many traders consider...
READ MORE
MEMBERS ONLY
A Watershed Moment For This Strong Earner - Here's The Time Frame Chart To Use
by Mary Ellen McGonagle,
President, MEM Investment Research
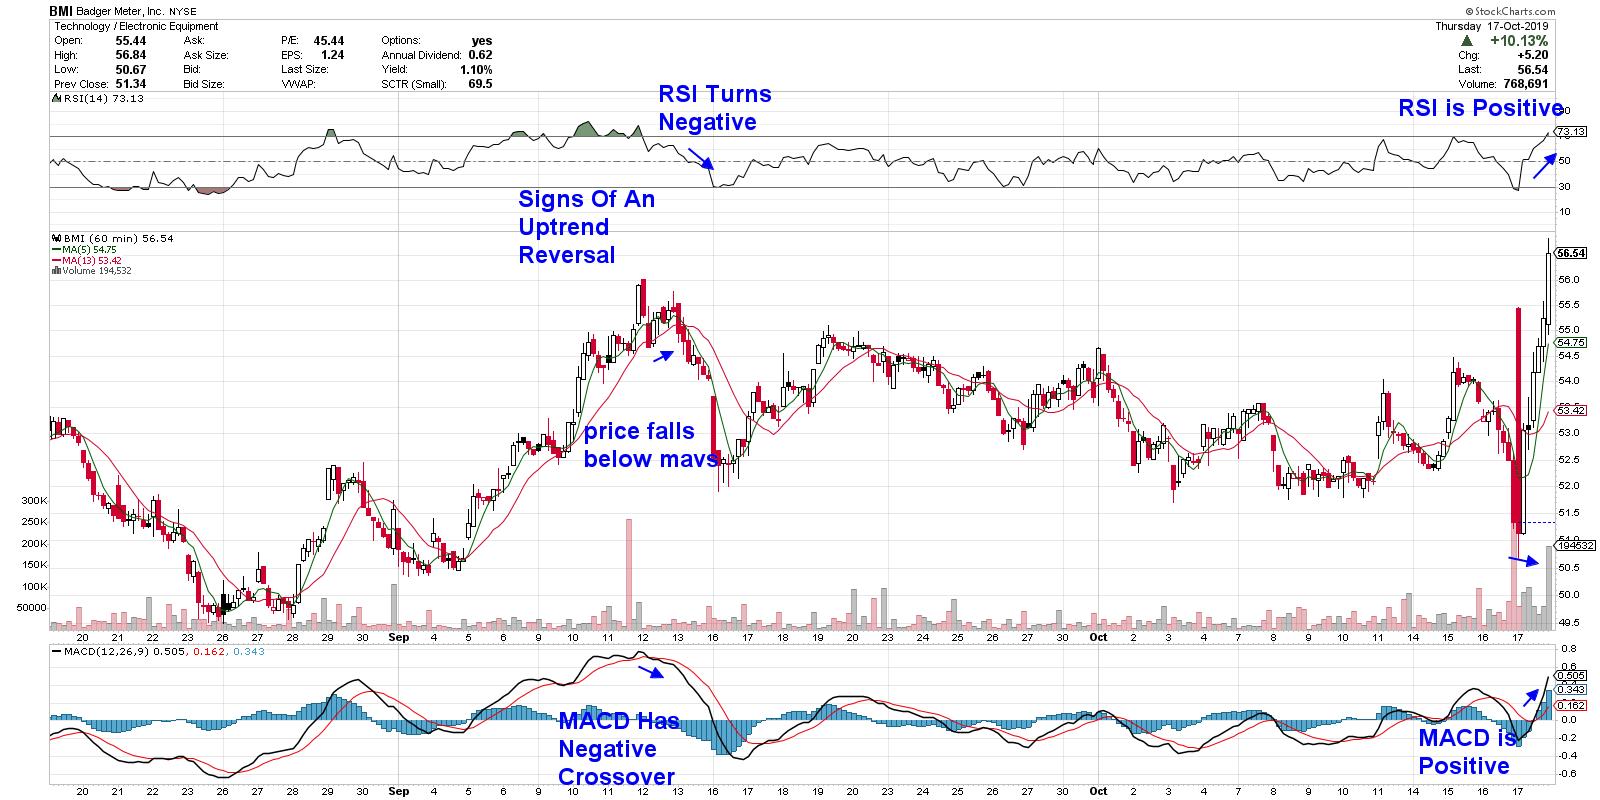
Earnings season began this week with over 95 companies reporting their most recent earnings reports. By all accounts, it's been quite a positive season so far, with most companies coming in ahead of estimates and the markets responding warmly.
One of the biggest winners has been a small-...
READ MORE
MEMBERS ONLY
DP Daily Diamonds - Short- and Intermediate-Term Ideas
by Erin Swenlin,
Vice President, DecisionPoint.com
I've begun to incorporate the weekly charts in the Diamond Reports. When I get a large amount of scan results, I find that it helps to narrow down the field by looking at a CandleGlance of the entire list and deleting the obvious "not ready for primetime&...
READ MORE
MEMBERS ONLY

HEALTH INSURERS AND DRUG DISTRIBUTORS PUT HEALTHCARE SPDR NEAR THREE-MONTH HIGH -- UNITEDHEALTH GROUP AND HUMANA CLEAR 200-DAY LINES -- AMERISOURCEBERGEN, CARDINAL HEALTH, AND MCKESSON ARE HAVING A VERY STRONG CHART WEEK
by John Murphy,
Chief Technical Analyst, StockCharts.com
HEALTHCARE CONTINUES STRONG WEEK...Healthcare is the day's strongest sector for the second time this week. Chart 1 shows the Health Care SPDR (XLV) trading above a falling trendline drawn over its July/September highs; and putting the XLV close to the highest level in nearly four months....
READ MORE
MEMBERS ONLY

Ranking and Grouping ETFs - Emerging Markets ETF Challenges Key Level - Big Announcement
by Arthur Hill,
Chief Technical Strategist, TrendInvestorPro.com
Today's report on StockCharts is short because the full report can be found at my new website, TrendInvestorPro.com. More details below. For now, I will leave you with the Core Emerging Markets ETF (IEMG) as its technical picture improves. The chart for IEMG looks similar to the...
READ MORE
MEMBERS ONLY
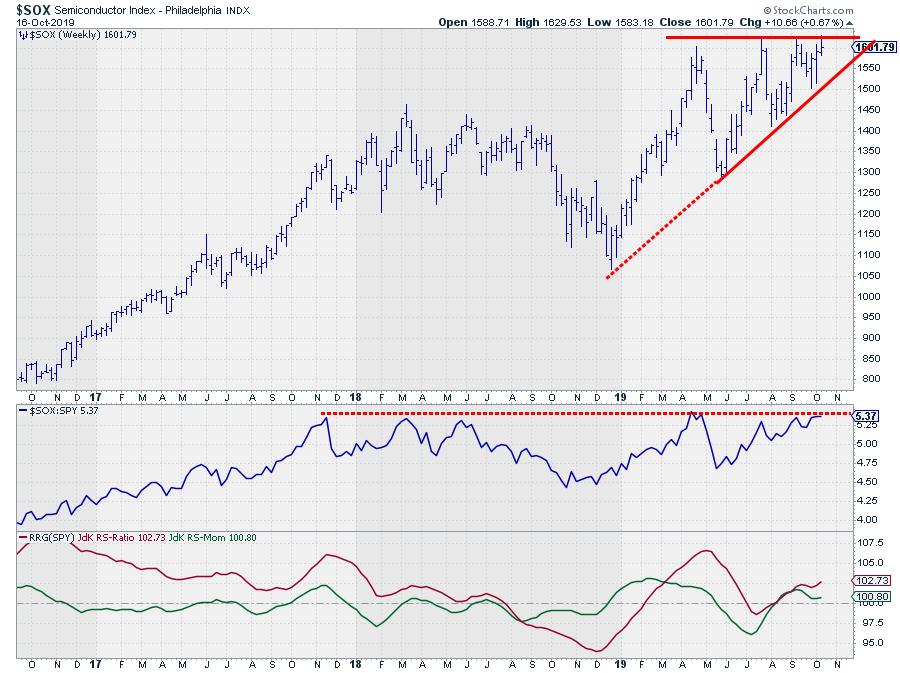
Semiconductors Have NOT Broken Out (Yet), But Here's a Pair Trade That May Offer an Opportunity
by Julius de Kempenaer,
Senior Technical Analyst, StockCharts.com
In the past week or so, I've seen a few headlines flying by mentioning the semiconductor index ($SOX) and an alleged breakout. In response, I checked out the chart of $SOX, as printed above, in combination with relative strength versus SPY.
What I see is a pretty big...
READ MORE
MEMBERS ONLY
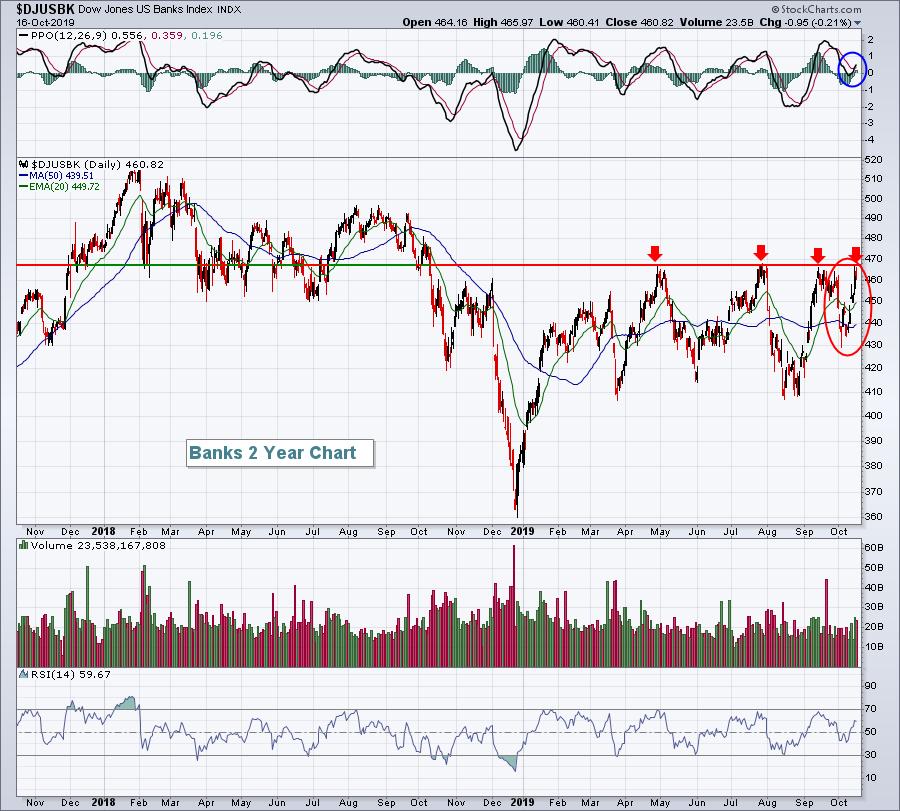
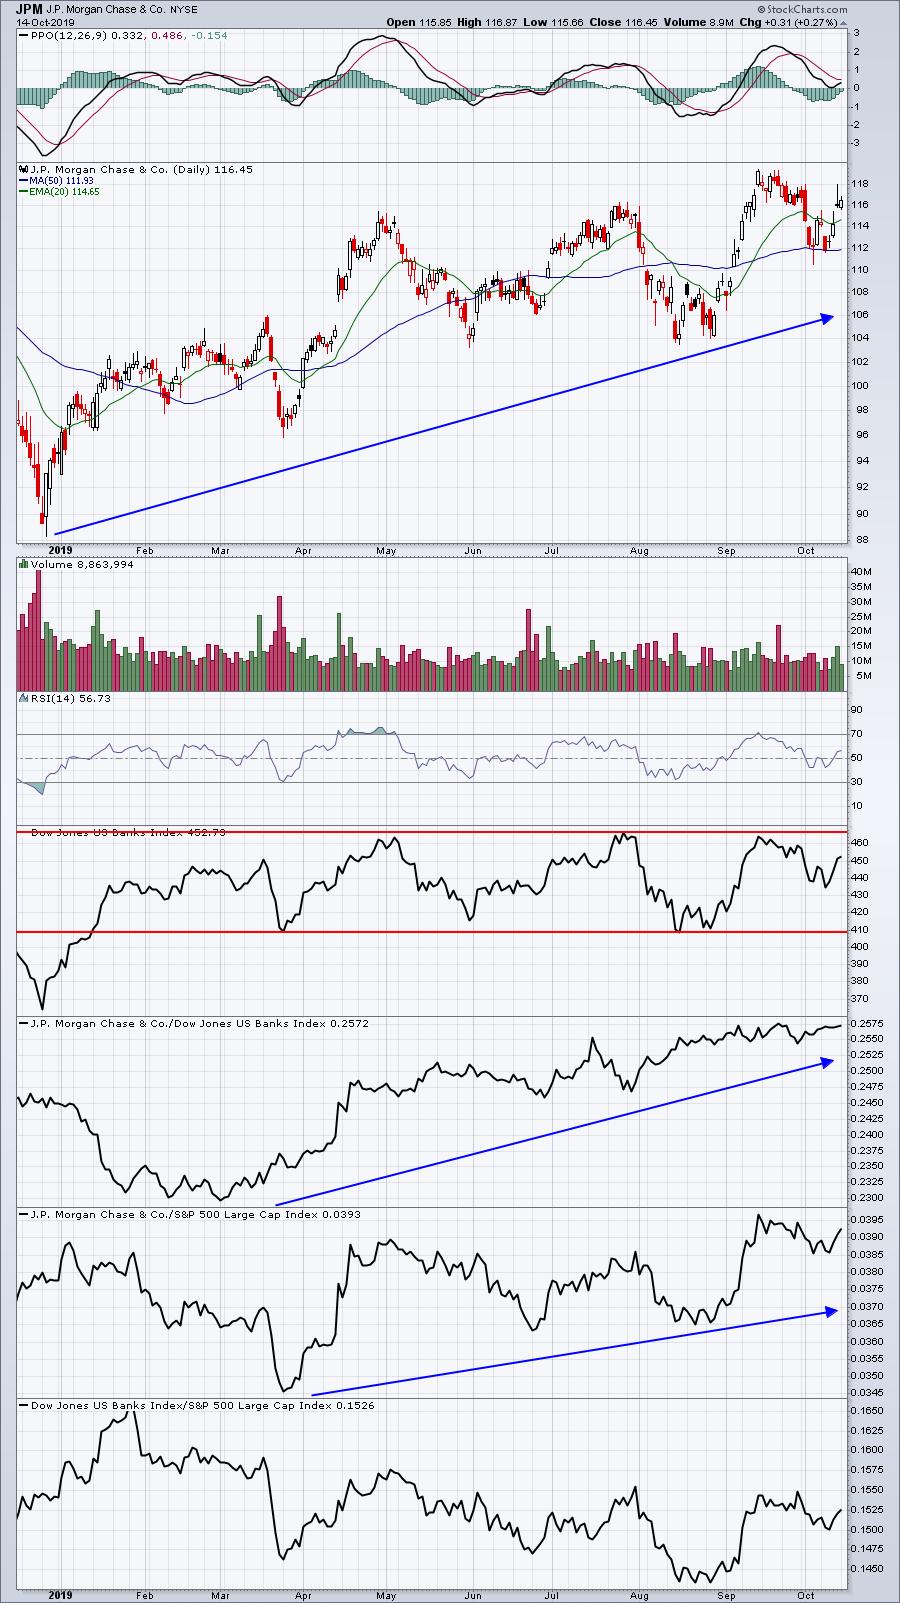
What A Month For The Banks So Far!
by Tom Bowley,
Chief Market Strategist, EarningsBeats.com
October volatility in the banking industry ($DJUSBK) has been nothing short of crazy! On September 30th, the DJUSBK stood at 457.39. A little more than two weeks later, we show an index value of 460.82. No big deal, right? Well, October began with that infamous ISM manufacturing number...
READ MORE
MEMBERS ONLY
Measuring Offensive vs Defensive Sectors Using BETA
by Julius de Kempenaer,
Senior Technical Analyst, StockCharts.com
We, including myself, are always talking about offensive and defensive sectors, sector rotation from offensive to defensive, etc. Offensive sectors are the sectors that will do very well - and usually outperform - when the market goes up, while defensive sectors are the sectors that outperform when the market goes down. These...
READ MORE
MEMBERS ONLY
DecisionPoint Diamonds - Home Builders Breaking Out
by Erin Swenlin,
Vice President, DecisionPoint.com
The "Chart Breakouts" Scan returned about nine different home builder stocks. I didn't care for all of them, but I did pick out three for your review. This scan generally pulls stocks that had monster days. Consequently, you may need to wait for a pullback to...
READ MORE
MEMBERS ONLY

DP Mid-Week Alert: Swenlin Trading Oscillators Leave Doubt About Reaching All-Time Highs
by Erin Swenlin,
Vice President, DecisionPoint.com
It's only Wednesday, but we've already had quite a few Scoreboard changes this week - BUY signals all around. The Scoreboards would suggest all-time highs should be no sweat, but the short-term indicators aren't on board with that analysis. The VIX is also...
READ MORE
MEMBERS ONLY

British Pound Clears Its 200-day MA for an Initial Sign of a New Bull Market
by Martin Pring,
President, Pring Research
* Pound is in a Long-Term Secular Bear Market
* Crossing of the 200-Day Starts the Ball Rolling for a Primary Bull Market
* Pound Set to Break Against the Euro
Pound is in a Long-Term Secular Bear Market
Chart 1 shows that the British Pound has been in a...
READ MORE
MEMBERS ONLY
DP Show: Indicators Don't Support All Time Highs
by Erin Swenlin,
Vice President, DecisionPoint.com
by Carl Swenlin,
President and Founder, DecisionPoint.com
In this week's episode of DecisionPoint, Carl spent a few minutes analyzing a six-month chart of the SPX, after which Erin and Carl discussed the lack of support this recent rally is showing. Erin followed up with sentiment and DecisionPoint indicators, while Carl took his discussion of...
READ MORE
MEMBERS ONLY
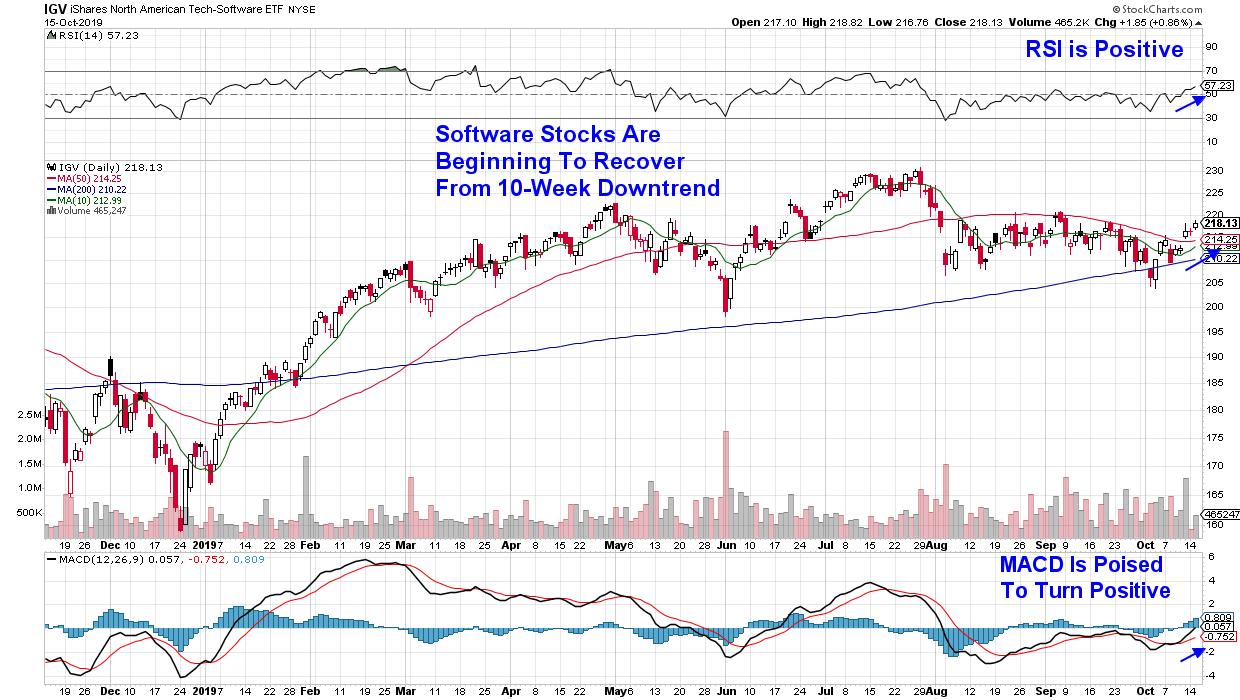
Uniquely Bullish Opportunity Emerges With This Week's Rally
by Mary Ellen McGonagle,
President, MEM Investment Research
Software stocks peaked in late July after posting phenomenal year-to-date returns. The August dip in the markets hit this group particularly hard and, unlike other areas, it has been slow to recover.
The good news, as you can see below, is that these stocks are beginning to reverse...
READ MORE
MEMBERS ONLY
DP Diamonds - These Stocks Look Good in All Timeframes with Great Seasonality Too!
by Erin Swenlin,
Vice President, DecisionPoint.com
Today, I had a plethora of results from my DP Diamond Scan - 83, to be exact! So it took me a bit longer to find today's diamonds, as I studied not only the daily and weekly charts but also seasonality in order to pare down to the best...
READ MORE
MEMBERS ONLY

FACEBOOK AND GOOGLE LEAD COMMUNICATIONS TO ONE OF DAY'S STRONGEST SECTORS -- BOUNCING BOND YIELDS ARE PUSHING TREASURY BOND PRICES LOWER -- BUT HIGH YIELD BONDS ARE RISING
by John Murphy,
Chief Technical Analyst, StockCharts.com
COMMUNICATIONS SPDR HAS STRONG DAY...While healthcare and financials have been leading for most of the day, communication stocks have crept into second place in afternoon trading. Chart 1 shows the Communication Services SPDR (XLC) bouncing impressively off its 50-day average that it cleared just last week. It'...
READ MORE
MEMBERS ONLY

MAJOR STOCK INDEXES BUILD ON LAST WEEK'S GAINS -- HEALTHCARE PROVIDERS LEAD HEALTHCARE SPDR HIGHER LED BY UNITEDHEALTH -- RECORD HIGH BY JP MORGAN CHASE LEADS BANKS AND FINANCIALS HIGHER -- FALLING VIX ALSO SUPPORTS HIGHER STOCK PRICES
by John Murphy,
Chief Technical Analyst, StockCharts.com
MAJOR STOCK INDEXES BUILD ON RECENT GAINS...After a modest pullback yesterday, major U.S. stock indexes are building on last week's trade-inspired gains. Chart 1 shows the Dow Industrials trading at the highest level of the month this morning. The Dow appears headed toward the top...
READ MORE
MEMBERS ONLY
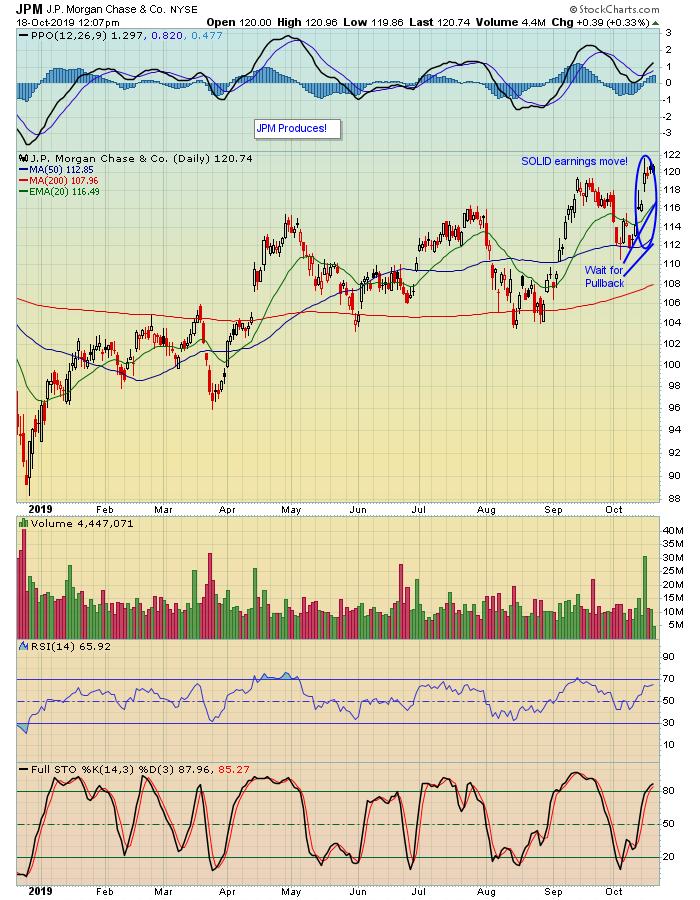
JP Morgan Chase (JPM) Banks A Huge Report
by Tom Bowley,
Chief Market Strategist, EarningsBeats.com
JPM did not disappoint Wall Street. The Street had been "banking" on a solid report, as evidenced by its solid relative performance to its banking peers and to the benchmark S&P 500. And wow did they get it! JPM reported revenues of $30.06 billion and...
READ MORE
MEMBERS ONLY
Trend Following Strategies

by Greg Morris,
Veteran Technical Analyst, Investor, and Author
Our rules-based trend following model is the foundation for three different money management strategies. This article will introduce you to two of them. Our model uses a weight-of-the-evidence approach to measure the strength of up-trends in the U.S. equity markets and is primarily focused...
READ MORE
MEMBERS ONLY
DecisionPoint Diamonds - Daily and Weekly Charts of Three Diamonds in the Rough
by Erin Swenlin,
Vice President, DecisionPoint.com
In today's Diamond Report, I decided to look at only three stocks as I want to discuss not only their daily charts, but their weekly charts as well. Seeing strength in both timeframes can provide the option to trade in the shorter term or in the longer term....
READ MORE
MEMBERS ONLY
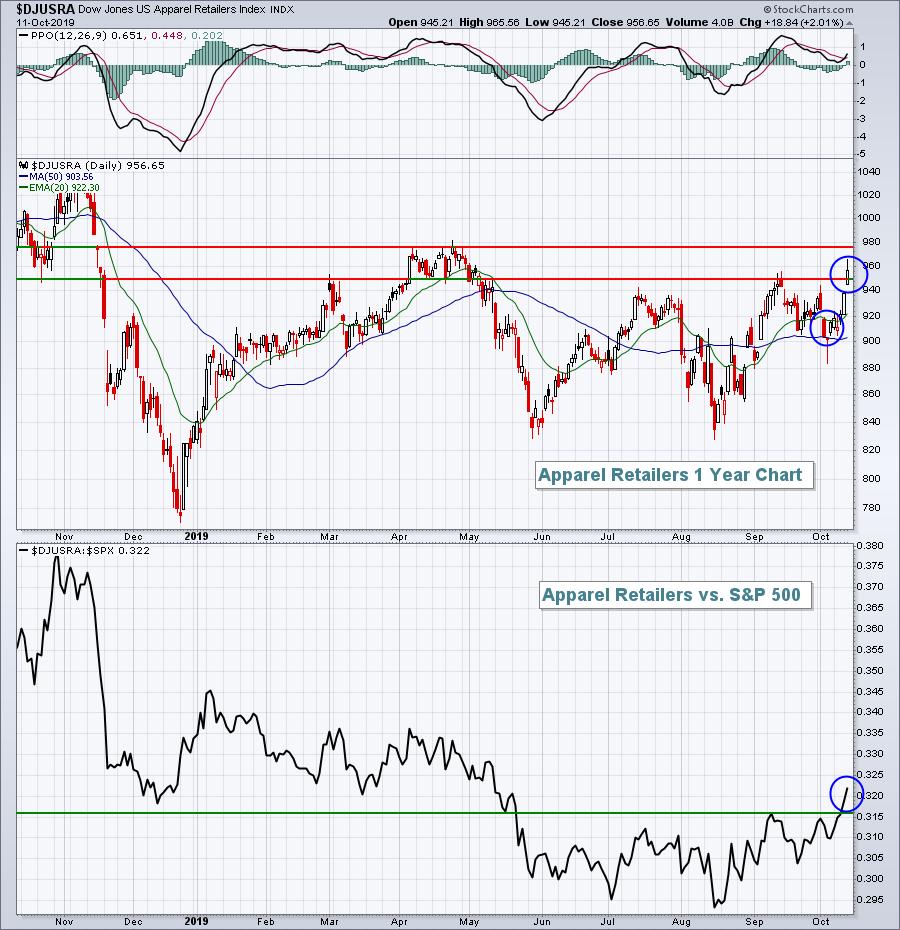
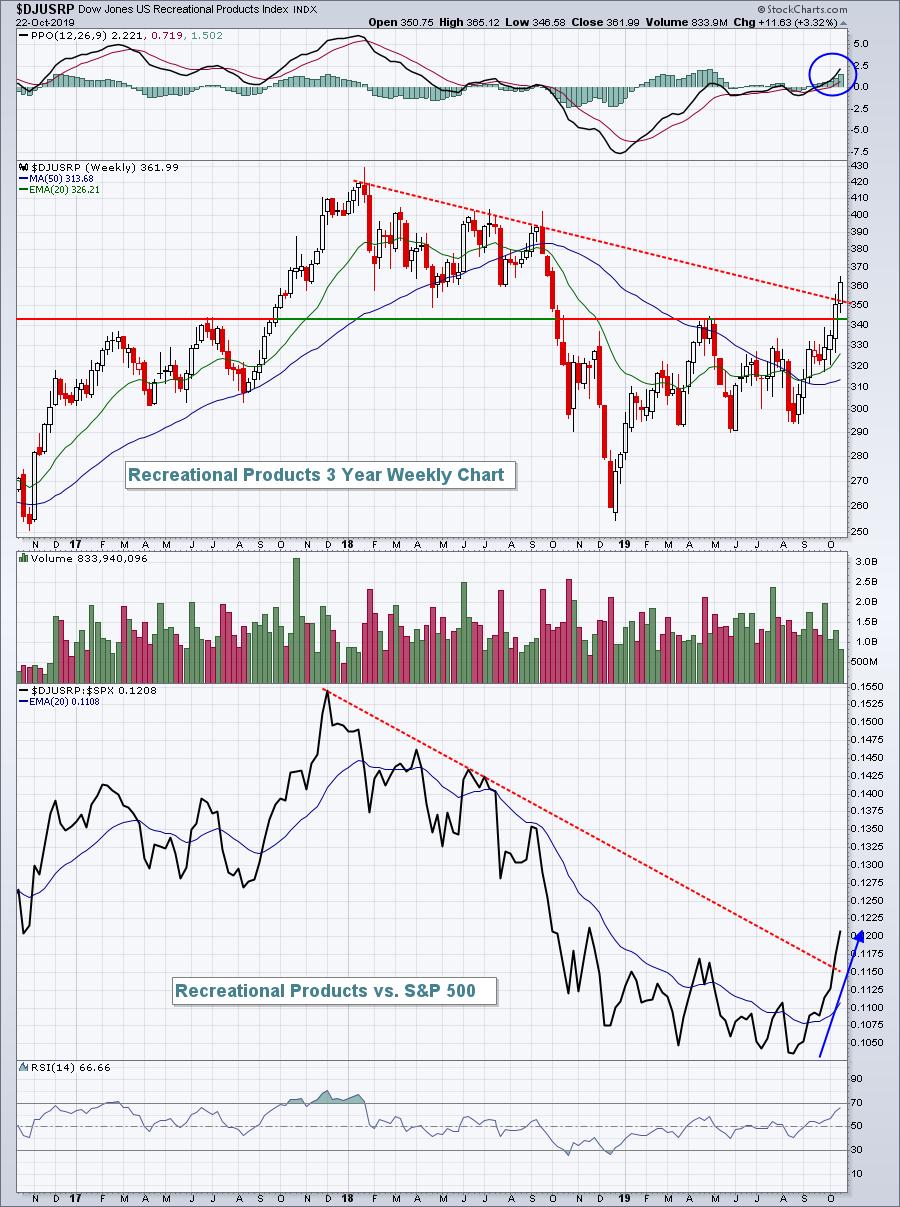
Consumer Discretionary Poised To Lead Market Higher
by Tom Bowley,
Chief Market Strategist, EarningsBeats.com
Last week, there were eight industry groups within consumer discretionary (XLY) that gained 2% or more, lead by the rapidly-improving apparel retailers ($DJUSRA), which gained 4.57% and broke out to 5 month absolute and relative highs:
The strength in the DJUSRA helped the XLY bounce off trendline support...
READ MORE