MEMBERS ONLY

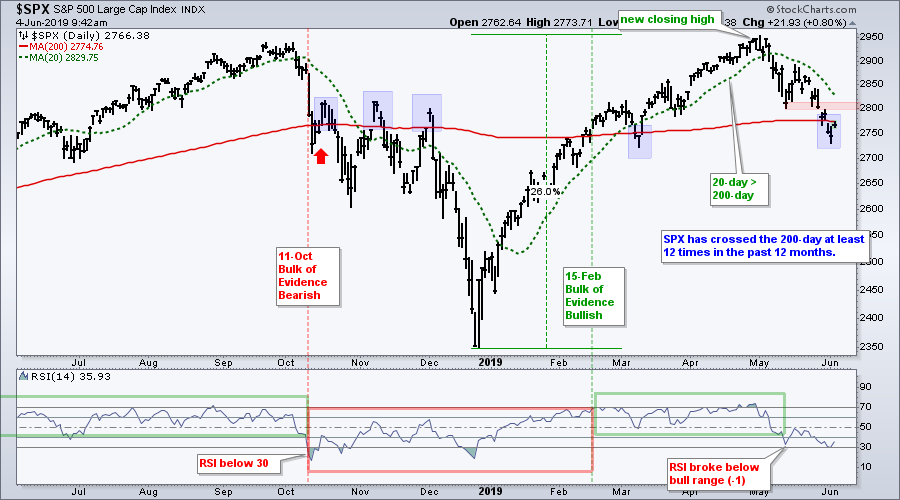
STOCKS RALLY ON INCREASED HOPE FOR A RATE CUT -- S&P 500 REGAINS 200-DAY LINE -- TECHNOLOGY AND CYCLICAL SPDRS HOLD THEIR 200-DAY LINES -- WHILE FINANCIALS, INDUSTRIALS, AND MATERIALS REGAIN THEIR RED LINES -- VIX FALLS FURTHER BELOW 20

by John Murphy,
Chief Technical Analyst, StockCharts.com
S&P 500 TRADES BACK OVER ITS 200-DAY AVERAGE... A combination of a short-term oversold condition and dovish sounding comments from the head of the Fed are giving a big lift to stocks today. All major indexes are are showing strong gains with the Nasdaq in the lead (+2....
READ MORE
MEMBERS ONLY
S&P 500 Toys with 200-day - Two Emerging Market ETFs To Watch

by Arthur Hill,
Chief Technical Strategist, TrendInvestorPro.com
* S&P 500 Crosses 200-day for Umpteenth Time.
* The S&P 500 versus a Slew of Negative Charts.
* Vietnam ETF Tests Breakout Zone.
* Frontier Markets ETF Nears Breakout.
... There sure is a lot of negativity out there as the S&P 500 toys with its 200-day SMA....
READ MORE
MEMBERS ONLY
What We Know That Isn't So

by Greg Morris,
Veteran Technical Analyst, Investor, and Author
Investment-Related “Believable” Misinformation Makes Successful Investing Hard Work
Exceptional discipline and objectivity will keep you from falling victim to short-term emotion and chasing something new, even though you know your long-term methods are sound. The uncertainty of the market requires a methodology that allows you to participate in most of...
READ MORE
MEMBERS ONLY
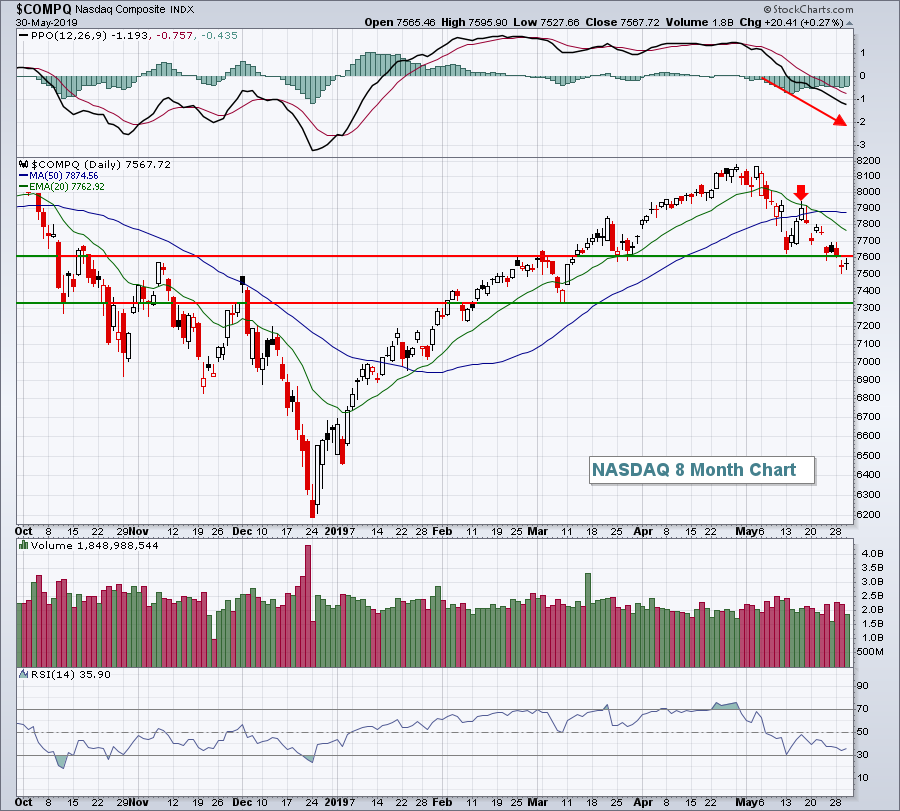
Late Afternoon Buying Does Little For NASDAQ Shares

by Tom Bowley,
Chief Market Strategist, EarningsBeats.com
Market Recap for Monday, June 3, 2019
I've had lots of positives for software stocks the past few years, but yesterday we saw a rare short-term breakdown that will test the mettle of traders. The Dow Jones U.S. Software Index ($DJUSSW, -3.17%) joined internet stocks ($DJUSNS,...
READ MORE
MEMBERS ONLY
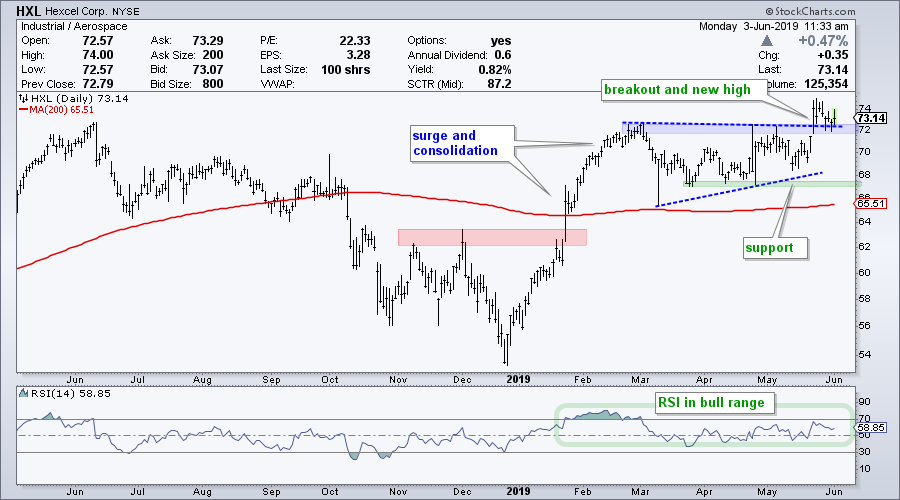
Hexcel Bucks the Selling and Holds the Break Zone
by Arthur Hill,
Chief Technical Strategist, TrendInvestorPro.com
May was a tough month for the broad market indexes and nine of the eleven sectors. Only the Utilities SPDR and Real Estate SPDR advanced in May as the other nine sectors fell. Stocks that closed higher in May bucked some serious selling pressure and could be worth a second...
READ MORE
MEMBERS ONLY
Don't Gamble On This Industry In June
by Tom Bowley,
Chief Market Strategist, EarningsBeats.com
Market Recap for Friday, May 31, 2019
The U.S. stock market was in no mood for any negative surprises, yet it received one when President Trump slapped a 5% tariff on all products from Mexico (effective June 10th) to try to control illegal immigration. While it may seem as...
READ MORE
MEMBERS ONLY
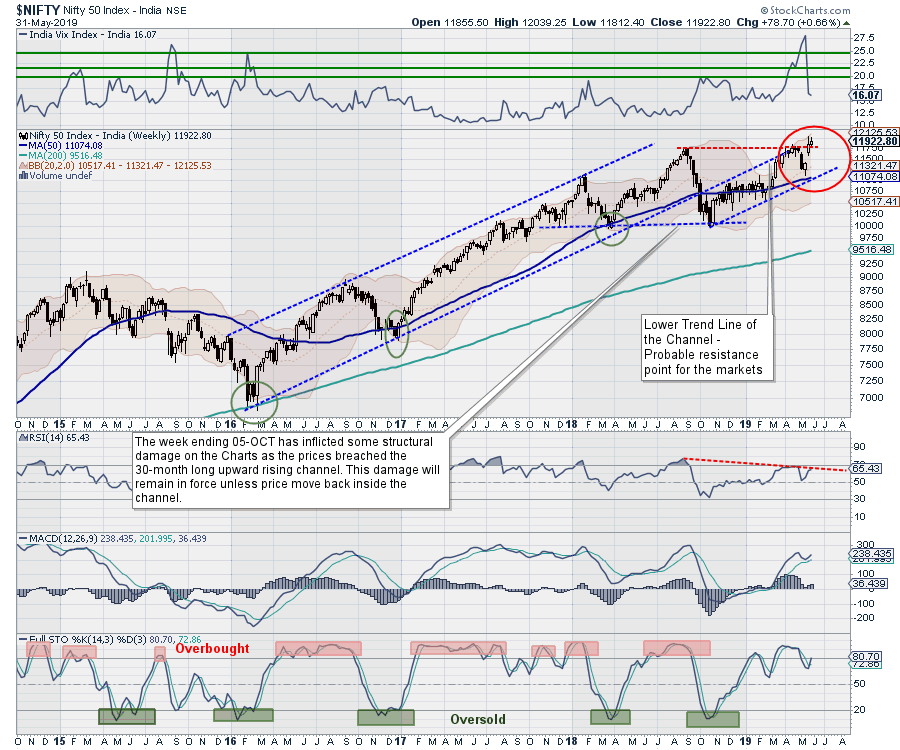
Week Ahead: Markets May Face Broader Technical Headwinds; Volatility Likely To Resurface

by Milan Vaishnav,
Founder and Technical Analyst, EquityResearch.asia and ChartWizard.ae
In yet another fairly eventful week, the Indian equity markets continued to digest the general elections fully, ending with a violent reaction to the portfolio allocation of the new set of cabinet ministers. After witnessing a 420-point trading range while marking incremental highs on a closing basis, the headline index...
READ MORE
MEMBERS ONLY
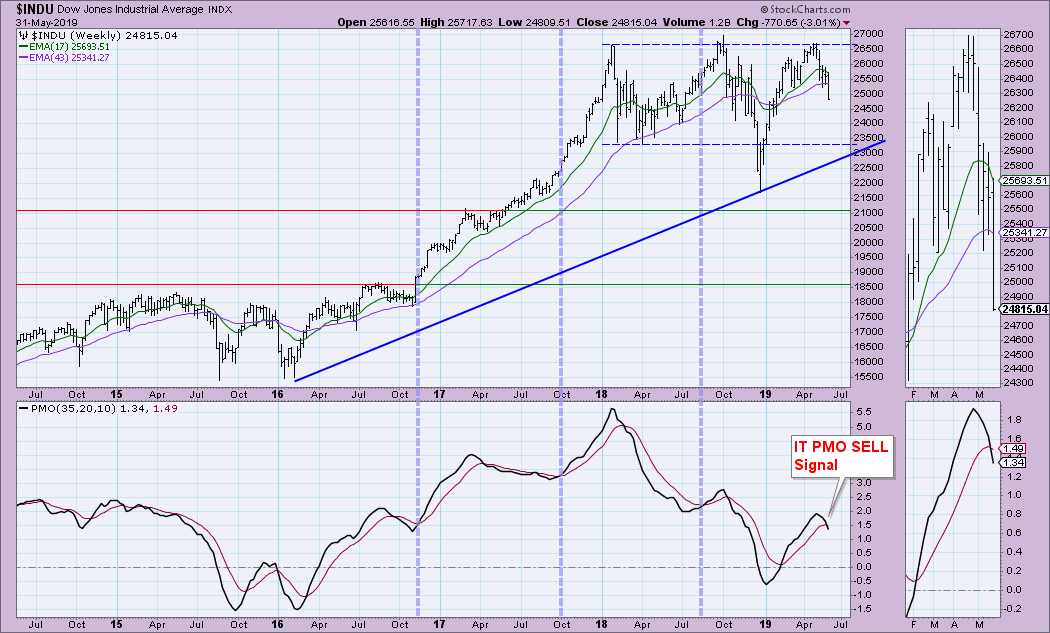
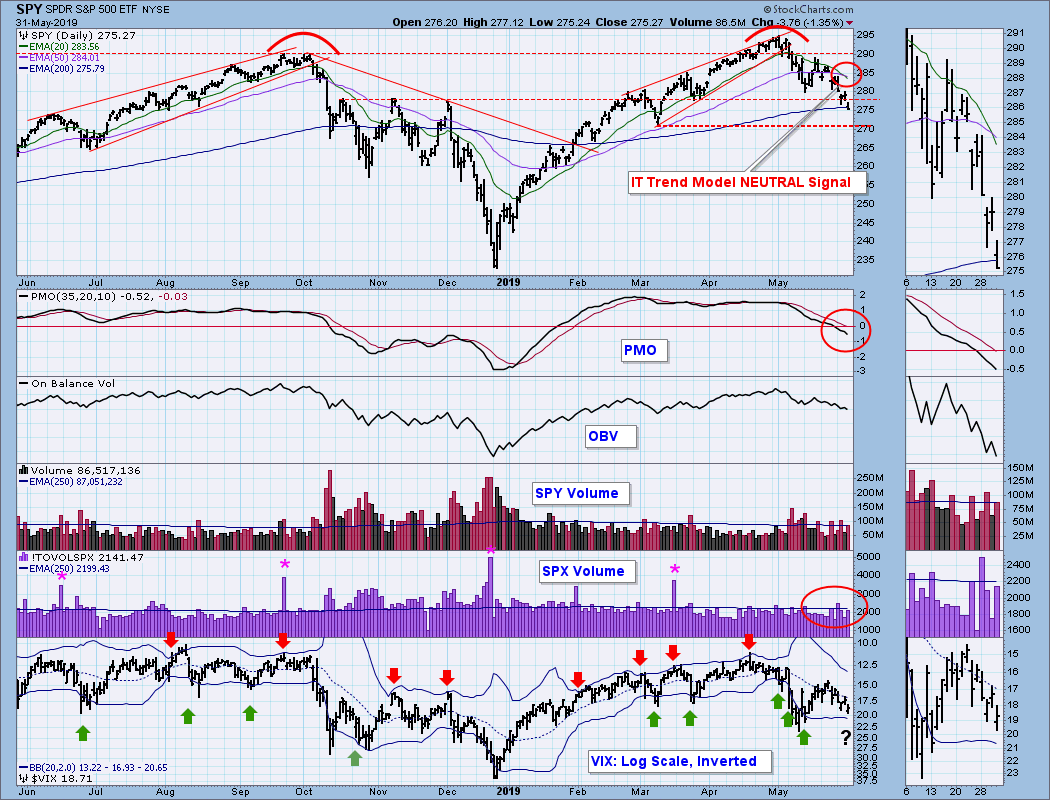
Dissecting the Dow - New IT Price Momentum Oscillator SELL Signal

by Erin Swenlin,
Vice President, DecisionPoint.com
This week, all four of the Scoreboard indexes (SPX, OEX, NDX, Dow) switched to IT Trend Model Neutral signals. This is just added insult to injury, given the ST Neutral and SELL signals that posted earlier this month. Today, the Dow lost its IT Price Momentum Oscillator (PMO) BUY signal....
READ MORE
MEMBERS ONLY
Strong Earnings can Fuel a Portfolio

by John Hopkins,
President and Co-founder, EarningsBeats.com
The market has been under fire for some time now as uncertainty abounds. Even a lot of stocks that had earlier reported strong earnings haven't been able to escape the recent market turmoil. However, there are also many stocks that have held up quite well, outperforming the market...
READ MORE
MEMBERS ONLY

The Best of Breed Methodology: Stage 4 - A Significant Enhancement

by Gatis Roze,
Author, "Tensile Trading"
A quarter century of investing yields one paramount conclusion. Venture capitalists have known this forever. Professional sports teams as well. Investors have been a little slower on the uptake.
Venture capitalists will tell you that if you invest in one company like Netflix, Salesforce or Google, it will make up...
READ MORE
MEMBERS ONLY
DP WEEKLY/MONTHLY WRAP: Intermediate-Term Trend Model Back to NEUTRAL from BUY

by Carl Swenlin,
President and Founder, DecisionPoint.com
Today the SPY 20EMA crossed down through the 50EMA and the IT Trend Model for SPY changed from BUY to NEUTRAL. As usual, this signal is an information flag to encourage us to take a closer look at the situation. In this case, the price breakdown is associated with a...
READ MORE
MEMBERS ONLY

Key Moving Average Rolls Over for S&P 500
by Arthur Hill,
Chief Technical Strategist, TrendInvestorPro.com
The 200-day moving averages for the S&P Mid-Cap 400 and the S&P Small-Cap 600 are already trending lower and this key moving average for the S&P 500 turned lower over the past week. This puts all three indexes below their falling 200-day SMAs and...
READ MORE
MEMBERS ONLY
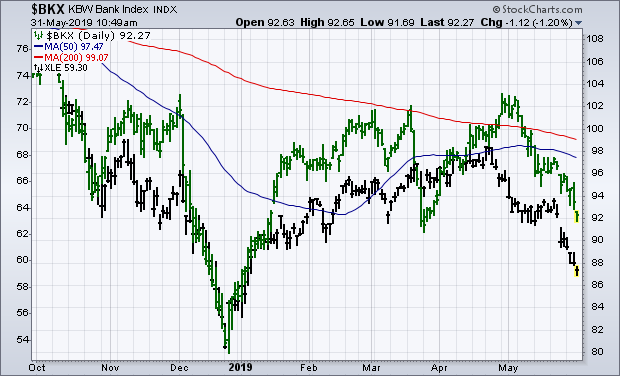
There's a Reason Why Banks and Energy Stocks are Falling Together - And That Reason May be Falling Oil Prices
by John Murphy,
Chief Technical Analyst, StockCharts.com
Editor's Note: This article was originally published in John Murphy's Market Message on Friday, May 31st at 11:14am ET.
Energy stocks are one of the weakest parts of the market. So are bank stocks. There may be a reason why. The black bars in Chart...
READ MORE
MEMBERS ONLY

THREAT OF MEXICAN TARIFFS PUSHES GLOBAL STOCKS LOWER -- 200-DAY AVERAGES ARE BEING BROKEN -- AUTOS ARE BEING HIT ESPECIALLY HARD -- INCLUDING GENERAL MOTORS -- THERE'S A REASON WHY BANKS AND ENERGY STOCKS ARE FALLING TOGETHER
by John Murphy,
Chief Technical Analyst, StockCharts.com
200-DAY AVERAGES ARE BEING BROKEN... The threat of tariffs on Mexican imports is rattling global markets today. And more technical damage is being done. Chart 1 shows the Dow Industrials falling below their March low near 25,200. That puts the Dow at the lowest level since late January. Chart...
READ MORE
MEMBERS ONLY

Weekly Market Review & Outlook - Bearish Evidence Proliferates
by Arthur Hill,
Chief Technical Strategist, TrendInvestorPro.com
* Key Moving Average Turns Lower.
* Mid-caps Trigger Bearish Breadth Signal.
* Small-caps Lead New Low Expansion.
* Four New Signals on Sector Table.
* Risk Aversion Indicators Surge.
* Treasury Bonds Extend Surge.
* Consumer Discretionary Sector Breaks Down.
* Oil Extends Decline.
* Gold Forms a Bull Wedge.
* Art's Charts ChartList Update.
... Stocks are...
READ MORE
MEMBERS ONLY
The Charts Do Not Say Recession Is Likely....At Least Not Yet
by Tom Bowley,
Chief Market Strategist, EarningsBeats.com
Market Recap for Thursday, May 30, 2019
Dollar General (DG, +7.16%) and Dollar Tree (DLTR, +3.14%) provided a lift to consumer discretionary stocks (XLY, +0.65%) after releasing their latest quarterly results, but PVH Corp (PVH, -14.87%) tumbled, further compromising an already-weak clothing & accessories group ($DJUSCF,...
READ MORE
MEMBERS ONLY
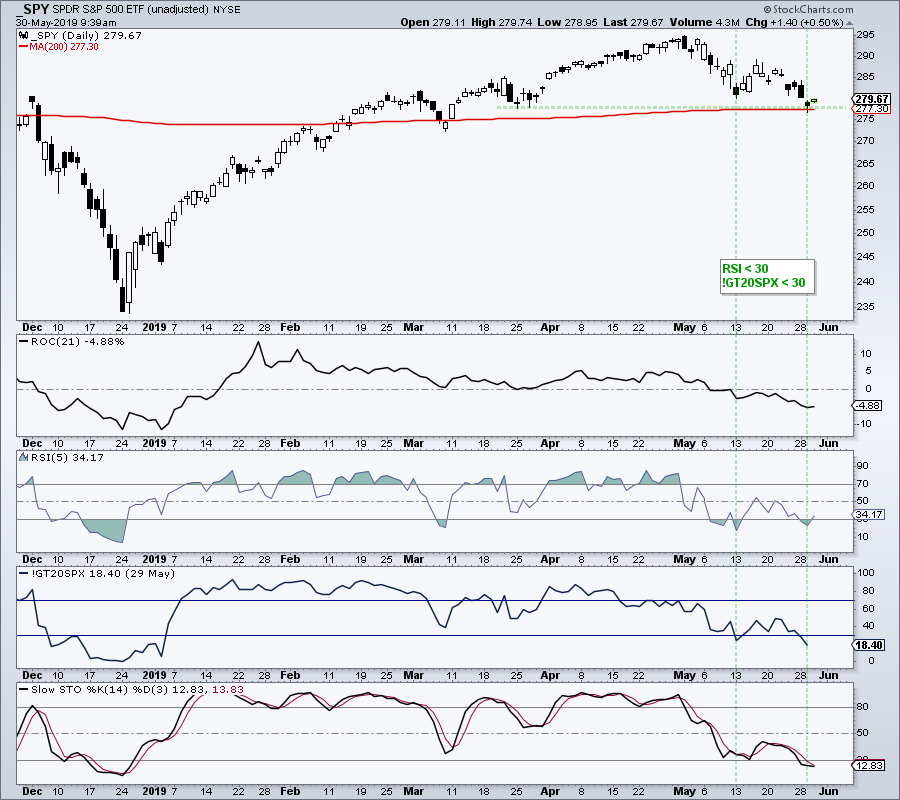
SPY and SOXX Become Oversold near Support
by Arthur Hill,
Chief Technical Strategist, TrendInvestorPro.com
* Oversold and at the 200-day.
* Pennant Evolves into Wedge.
* SOXX and Semis Hit Support.
* A Correction within Uptrend for PALL.
... Oversold and at the 200-day
... The S&P 500 and S&P 500 SPDR (SPY) are at interesting junctures because both are oversold and both are at their...
READ MORE
MEMBERS ONLY
Trade War Negativity Hasn't Impacted This Industry Group
by Tom Bowley,
Chief Market Strategist, EarningsBeats.com
Market Recap for Wednesday, May 29, 2019
Trade and growth concerns, along with slumping crude oil prices ($WTIC), were mostly responsible for another bad day on Wall Street. There was across-the-board selling as all of our major indices fell from 0.69% (S&P 500) to 0.94% (Russell...
READ MORE
MEMBERS ONLY

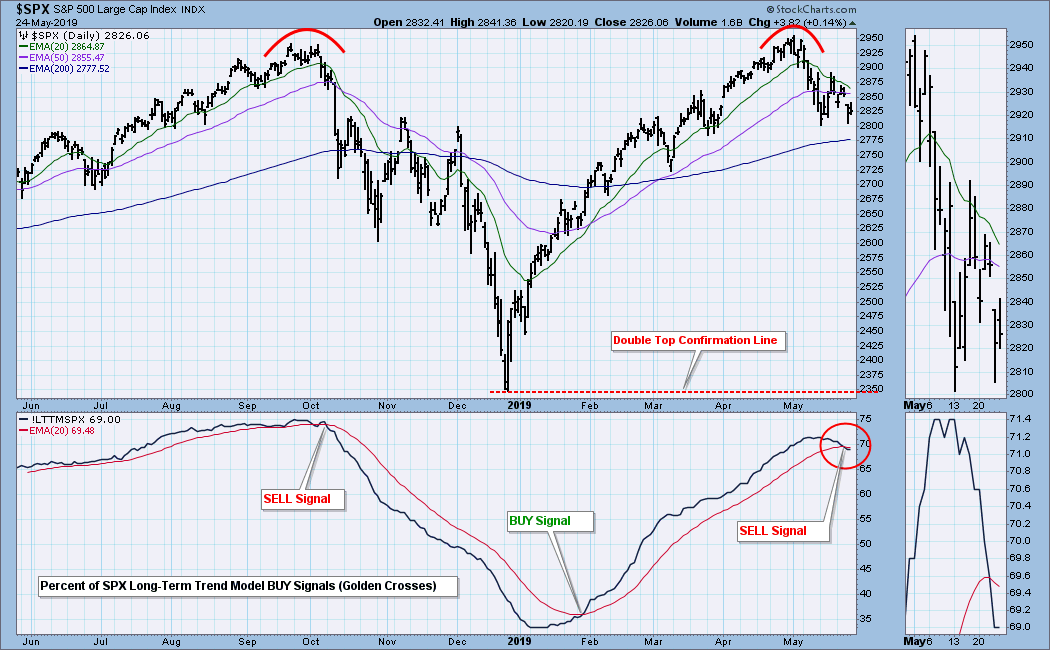
Did We Just Complete a H&S Top In $SPX?

by Julius de Kempenaer,
Senior Technical Analyst, StockCharts.com
It seems I did not have to look very far to find today's DITC entry...
The S&P 500 ($SPX) provides enough ammunition to get excited - or maybe worried is a better word - and not ignore the price action that is unfolding at the moment....
READ MORE
MEMBERS ONLY
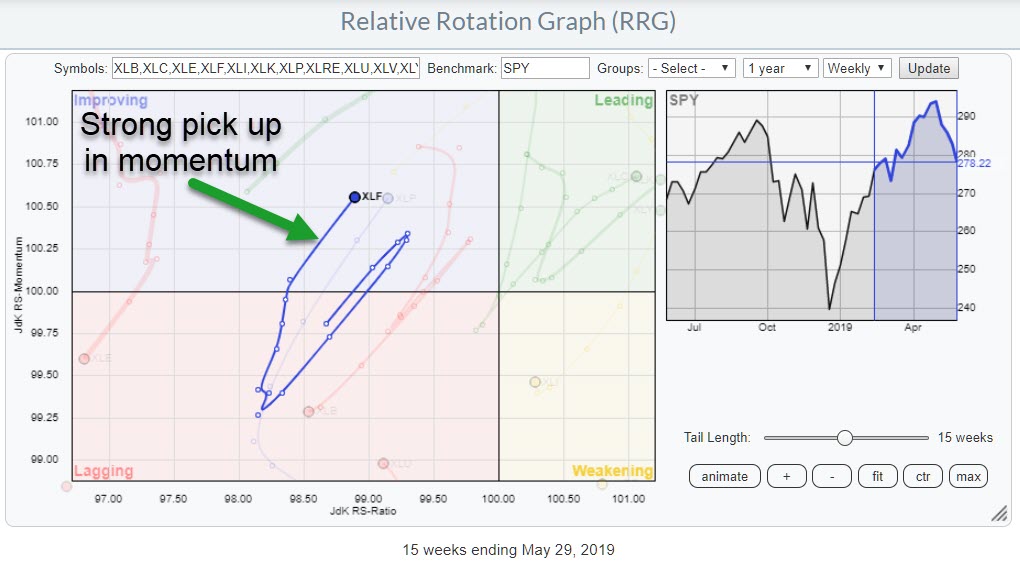
Spotting Strength And Weakness Inside The Financial Sector (XLF)
by Julius de Kempenaer,
Senior Technical Analyst, StockCharts.com
Looking at the Relative Rotation Graph showing the sectors of the S&P 500, we can see that the tail on the Financials sector stands out, having seen a big increase since last Friday.
Over the last 12-13 weeks, Financials rotated from the lagging into weakening quadrant, then moved...
READ MORE
MEMBERS ONLY

Deteriorating Confidence Is Not Good For Stocks And Commodities But Is For Bonds

by Martin Pring,
President, Pring Research
* Flight to Safety Leaves Stocks Behind
* S&P vs. Gold is Another Measure of Confidence That’s Deteriorating
* High-Quality Bonds Like Deteriorating Confidence
* A Rising Gold/Commodity Ratio is Actually Bearish for Commodities
Flight to Safety Leaves Stocks Behind
Last week, I wrote that it was nail-biting time for...
READ MORE
MEMBERS ONLY

DP Alert: Scoreboard Indexes Nearing Neutral Signals - More Whipsaw on UUP PMO
by Erin Swenlin,
Vice President, DecisionPoint.com
I was somewhat surprised that the SPX, NDX and OEX did not lose their IT Trend Model BUY signals today. However, I would look for those signal changes tomorrow after the close. In order to avoid these Neutral signals, price would need to climb above the 50-EMA. As you can...
READ MORE
MEMBERS ONLY

FALLING BOND YIELDS CAUSE FLIGHT TO SAFETY OF TREASURY BONDS -- TEN YEAR - 3 MONTH YIELD CURVE INVERTS -- STOCKS CONTINUE TO WEAKEN -- DOW TRADES BELOW ITS 200-DAY AVERAGE -- NASDAQ AND S&P 500 ARE THREATENING THEIR RED LINES
by John Murphy,
Chief Technical Analyst, StockCharts.com
TEN-YEAR TREASURY YIELD MAY BE HEADING TO 2%... The surprising drop in global bond yields is continuing. The weekly bars in Chart 1 shows the 10-Year Treasury Yield falling today to 2.22% which is the lowest level since September 2017. The weekly bars in Chart 1 show the next...
READ MORE
MEMBERS ONLY
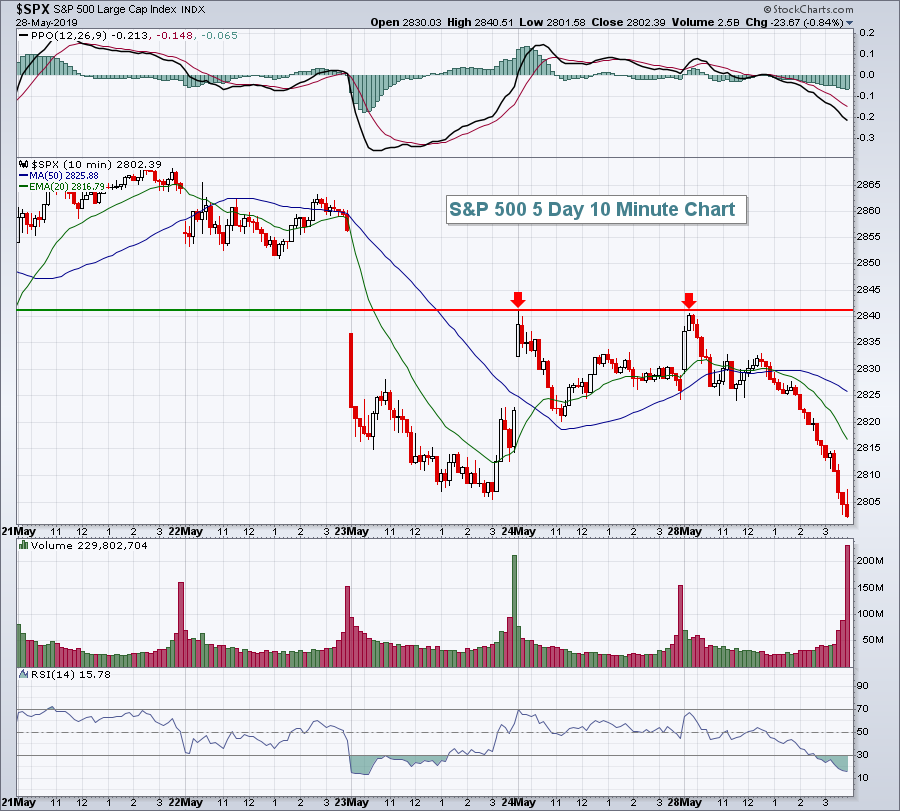
Software's Been A Leader, Watch This Key Support Level
by Tom Bowley,
Chief Market Strategist, EarningsBeats.com
Market Recap for Tuesday, May 28, 2019
U.S. stocks jumped at the open, but then ran into sellers throughout the session. After gapping down at the open on Thursday, it's been difficult for the S&P 500 to clear the low 2840s and yesterday's...
READ MORE
MEMBERS ONLY

Cardiovascular Systems Breaks from Pennant
by Arthur Hill,
Chief Technical Strategist, TrendInvestorPro.com
Cardiovascular Systems (CSII) shows bullish price action with signs of accumulation that could lead to higher prices.
First and foremost, the long-term trend is up because CSII recorded a new high in early March and is above the 200-day SMA. The 50-day SMA (green) is also above the 200-day SMA...
READ MORE
MEMBERS ONLY
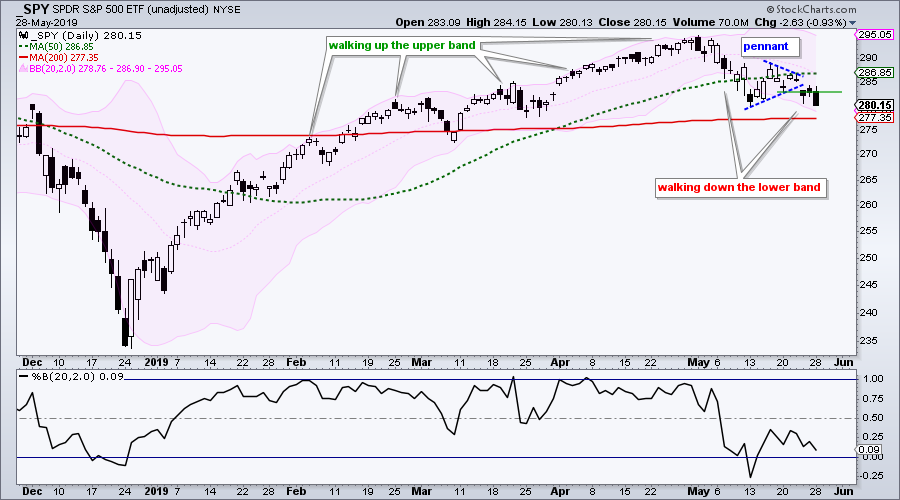
Walking Down the Lower Bollinger Band
by Arthur Hill,
Chief Technical Strategist, TrendInvestorPro.com
* Walking Down the Lower Band.
* Swings are Getting Bigger.
* Selling Pressure Expands to Defensive Sectors.
* Bearish Breadth Thrust for XLP and XLV.
* On Trend on Youtube.
...Walking Down the Lower Band
...Even though the weight of the evidence has yet to turn bearish for the S&P 500, the...
READ MORE
MEMBERS ONLY

Where There's Smoke...

by Bruce Fraser,
Industry-leading "Wyckoffian"
In early May (see my 5/2 MarketWatchers LIVE appearance) it seemed that a hint of smoke was noticeable at the tippy top of the market rally. We looked at the attributes of Distribution that were evident in the smaller intraday time frames. During the May 10th Power Charting episode,...
READ MORE
MEMBERS ONLY
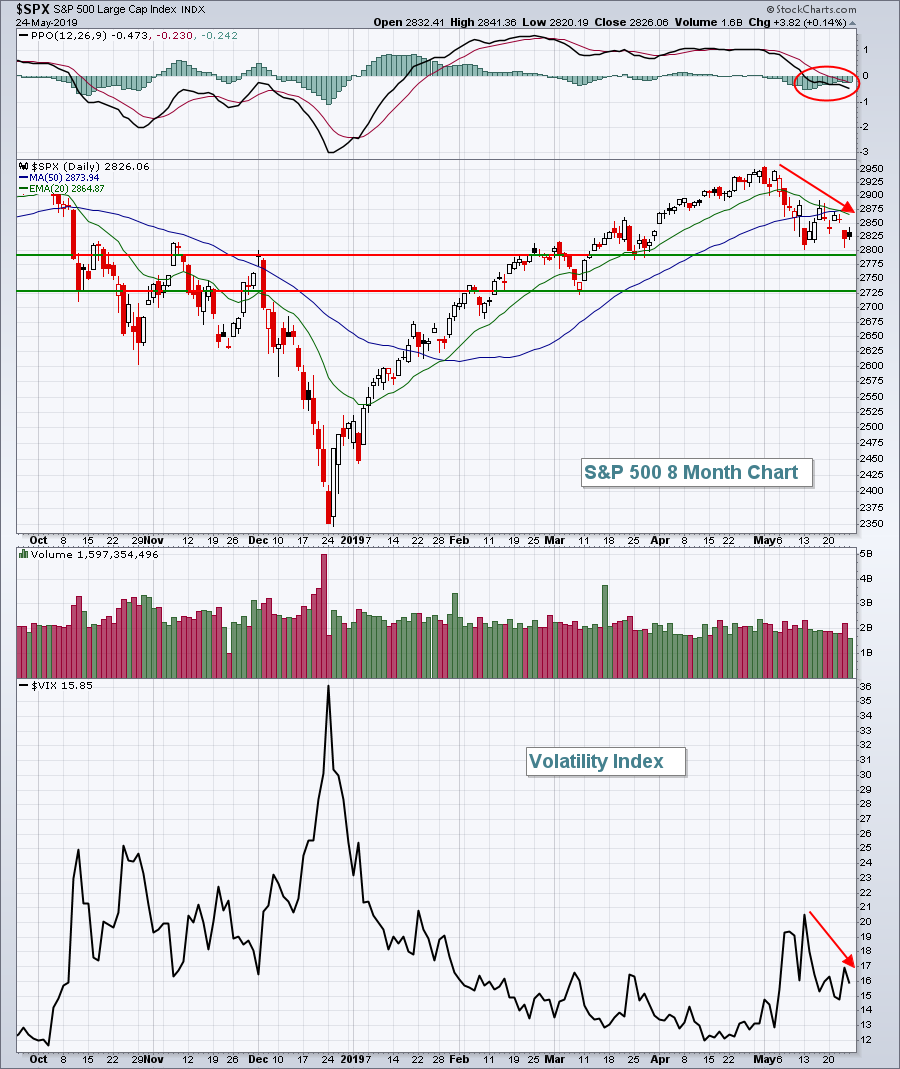
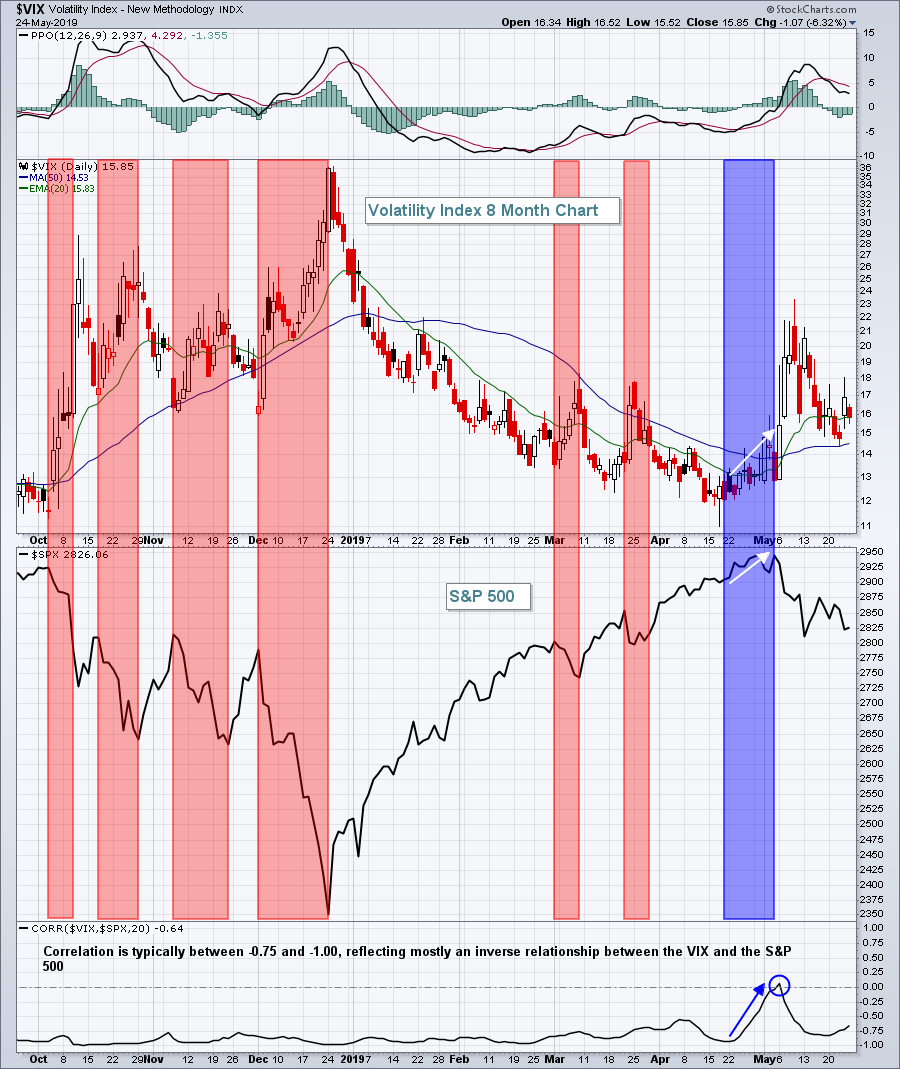
Consumer Staples Has Been A Leader In May, But Don't Expect It In June
by Tom Bowley,
Chief Market Strategist, EarningsBeats.com
Market Recap for Friday, May 24, 2019
Before I summarize Friday's numbers, let me first say that the S&P 500 closed near a two-month low while the Volatility Index ($VIX) has been falling as well. I find this to be a very bullish development as nervousness...
READ MORE
MEMBERS ONLY
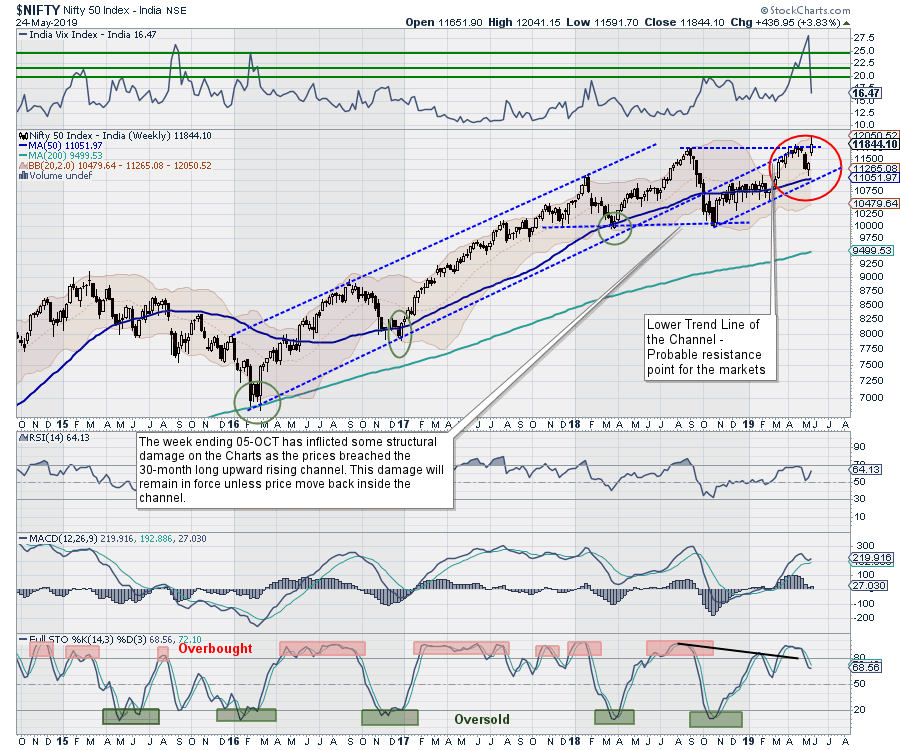
Week Ahead: Markets Set To See Wider Moves; Some Volatility May Resurface Again
by Milan Vaishnav,
Founder and Technical Analyst, EquityResearch.asia and ChartWizard.ae
The Indian equity markets finished one their most eventful weeks as they faced the general election results. Though the move remained much on expected lines, the timing got little awry as the market finished the bulk of its reaction by rising after the exit polls rather than waiting for the...
READ MORE
MEMBERS ONLY
The Relative Safety Of High-Yielding Stocks - 4 Names To Ponder As Interest Rates Plummet and Markets Waffle

by Mary Ellen McGonagle,
President, MEM Investment Research
We’re in a difficult period with the markets at the moment, as uncertainty surrounding U.S.- China trade talks is weighing heavily on stocks. With both sides throwing barbs and a resumption of talks not due until later this month, the pressure on the markets may very likely...
READ MORE
MEMBERS ONLY
DP WEEKLY WRAP: "Golden Cross" Index Generates SELL Signal
by Carl Swenlin,
President and Founder, DecisionPoint.com
When the 50EMA crosses up through the 200EMA, it is commonly known as a "Golden Cross," because it signals the potential for a long-term bullish outcome. For the sake of consistency, in DecisionPoint parlance we refer to the 50/200EMA relationship as the Long-Term Trend Model (LTTM), which...
READ MORE
MEMBERS ONLY
Calling Market Tops Is Easier Than You Think
by Tom Bowley,
Chief Market Strategist, EarningsBeats.com
There are no perfect signals that scream "GET OUT" of equities, but there are warning signs.....so long as you know where to find them. Most market participants believe in the random walk theory, which suggests that changes in stock prices have the same distribution and are independent...
READ MORE
MEMBERS ONLY
Current Trend of Declining Rates Seen as Part of a Large Base
by Martin Pring,
President, Pring Research
Editor's Note: This article was originally published in Martin Pring's Market Roundup on Friday, May 24th at 4:42pm ET.
This week has seen many interest rate series, both in the US and around the world, breaking down from important trading ranges or reaffirming previous breaks....
READ MORE
MEMBERS ONLY

Interest Rates Are Breaking Down On A Worldwide Basis
by Martin Pring,
President, Pring Research
* Current Trend of Declining Rates Seen as Part of a Large Base
* Downside Breakouts in Yields are Worldwide in Scope
* US Short-Rates Look Vulnerable as Well
* 30-Year Yield Completes a Top
* Stocks and Commodities versus Bonds
Current Trend of Declining Rates Seen as Part of a Large Base
This week...
READ MORE
MEMBERS ONLY
Five Trendlines Revisited

by David Keller,
President and Chief Strategist, Sierra Alpha Research
About a month ago, I wrote an article for ChartWatchers titled “Five Trendlines You Should Be Watching.” The general idea was that, as long as those five trend lines held, then the market was still most likely in a very constructive phase.
Revisiting those trend lines here will show that...
READ MORE
MEMBERS ONLY
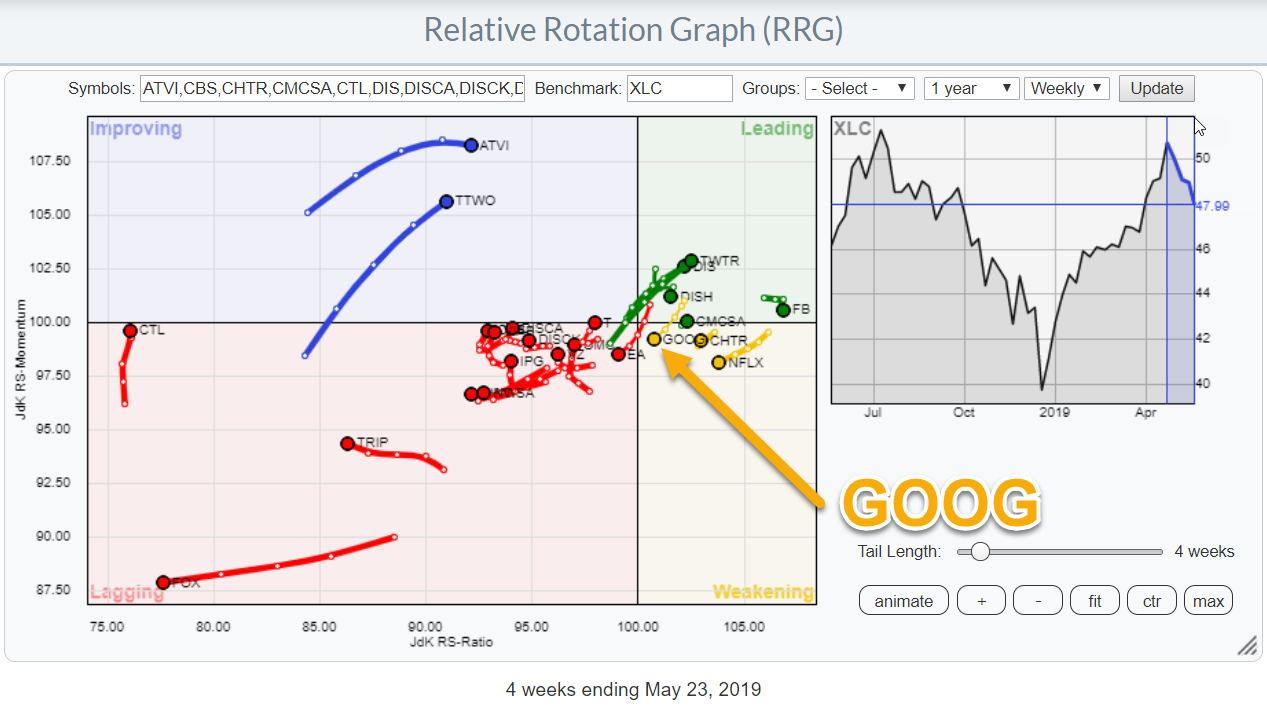
Communication Services Shows a Strong Rotation, But GOOG Is Not Participating
by Julius de Kempenaer,
Senior Technical Analyst, StockCharts.com
Relative Rotation Graphs can help to identify threats and opportunities within groups of securities. In this article, I will be looking at the position and rotation of the Communication Services Sector against the S&P 500 and other sectors, followed by a closer look at the rotation of various...
READ MORE
MEMBERS ONLY

HEALTHCARE SPDR IS TRYING TO CLEAR MOVING AVERAGE LINES -- MEDTRONIC AND BOSTON SCIENTIFIC LEAD MEDICAL EQUIPMENT GROUP HIGHER -- MERCK AND MCKESSON ARE DRUG LEADERS -- TECH SECTOR IS ONE OF MAY'S WEAKEST GROUPS
by John Murphy,
Chief Technical Analyst, StockCharts.com
HEALTHCARE IS GETTING BETTER ... While a lot of attention is being given to stock market swings over the last month, and recent selling in everything related to tariffs and global trade, one group has been quietly getting stronger. And that's healthcare. Healthcare remains this year's weakest...
READ MORE
MEMBERS ONLY

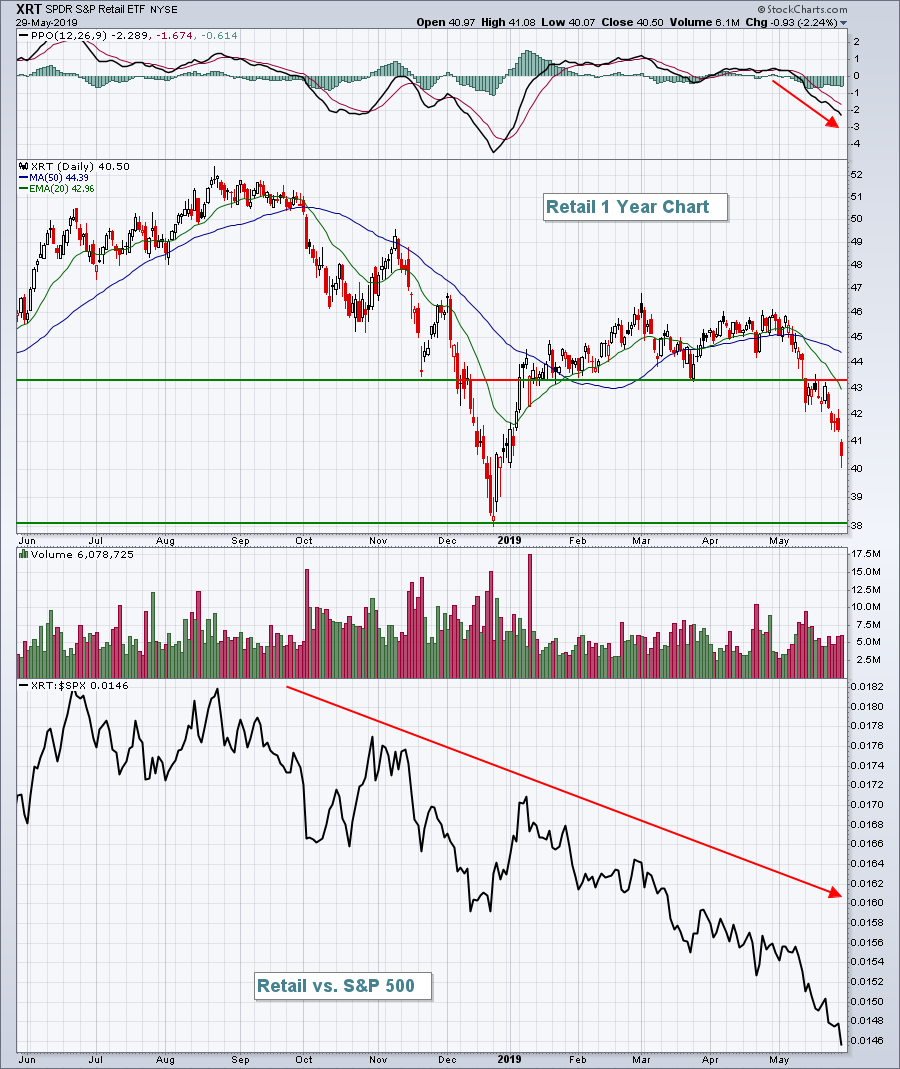
Weekly Market Review & Outlook - Small-caps, Retail and Oil Lead Lower
by Arthur Hill,
Chief Technical Strategist, TrendInvestorPro.com
* Retail, Banks, Semis and Oil.
* S&P 500 Corrects with Bigger Uptrend.
* Index Breadth Table Remains Net Bullish.
* AD Percent Down Days Weigh in May.
* Small-caps Lead the Way Lower.
* Charts to Measure Risk On/Off.
* Sector Shift in May.
* Sector Breadth Table Remains Bullish.
* Healthcare ETFs Hold Up...
READ MORE
MEMBERS ONLY
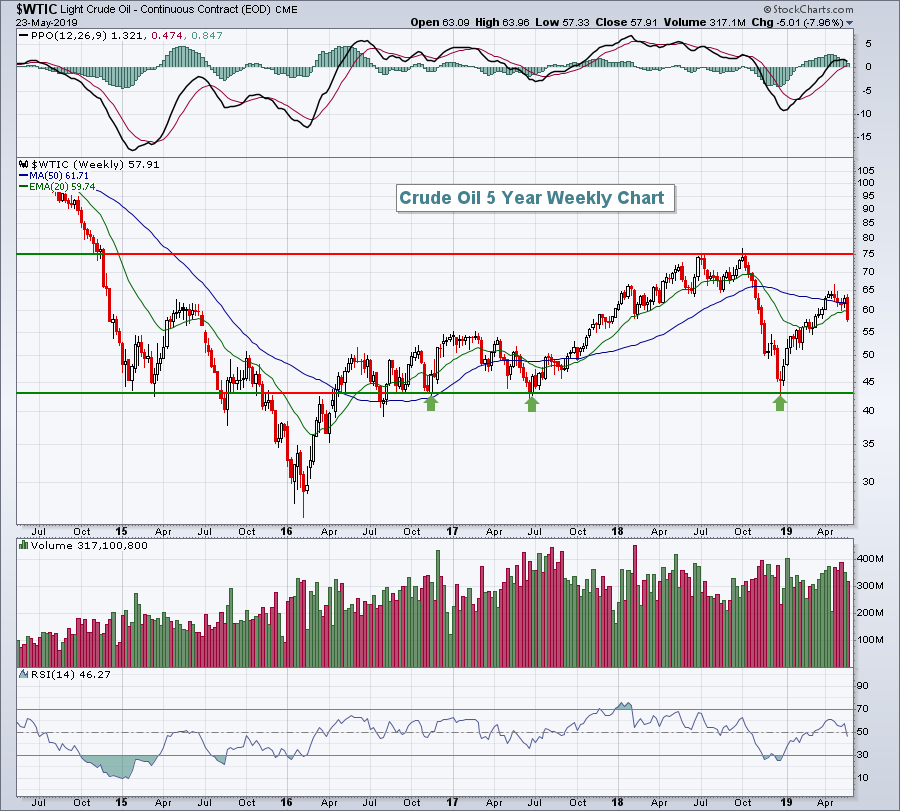
Crude Oil Plunges, Energy Crushed
by Tom Bowley,
Chief Market Strategist, EarningsBeats.com
Market Recap for Thursday, May 23, 2019
Energy (XLE, -3.35%) has been a relative laggard for the past 8 years, mostly due to a rising U.S. Dollar Index ($USD). The group took another big blow yesterday as crude oil prices ($WTIC, -5.71%) tumbled and had its worst...
READ MORE
MEMBERS ONLY

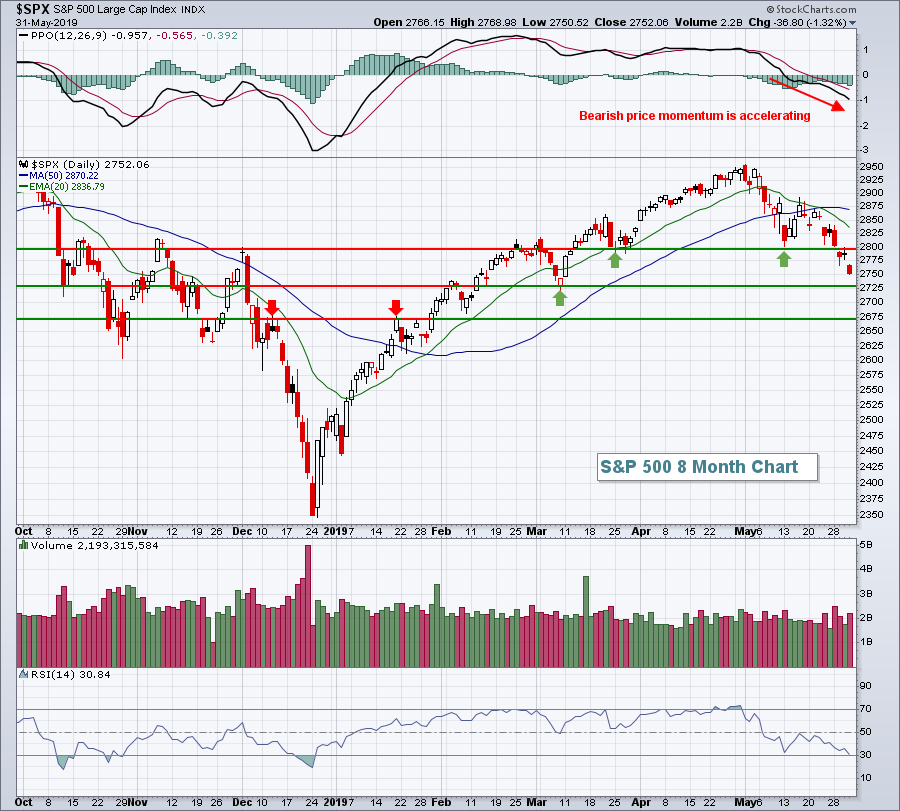
STOCK SELLING INTENSIFIES -- DOW TRADES BELOW ITS 200-DAY AVERAGE -- NASDAQ AND S&P 500 ARE DROPPING TOWARD THEIR 200-DAY LINES -- IF THEY DON'T HOLD, A TEST OF THEIR MARCH LOWS WOULD BE NEXT
by John Murphy,
Chief Technical Analyst, StockCharts.com
TRADE TENSIONS CONTINUE TO WEIGH ON STOCKS... Stocks are under heavy selling pressure today. Energy stocks are leading the market lower with a drop of more than -3%, while oil is dropping nearly twice as much. Technology, industrials, and financials are down -2% or more. As has been the case...
READ MORE