MEMBERS ONLY

BOND YIELDS AND STOCKS TRENDED IN OPPOSITE DIRECTIONS PRIOR TO 2000 -- BUT THEY'VE BEEN TRENDING IN THE SAME DIRECTION SINCE THEN ... THE EMERGENCE OF DEFLATION AROUND THE TURN OF THE CENTURY CHANGED THE BOND-STOCK RELATIONSHIP

by John Murphy,
Chief Technical Analyst, StockCharts.com
BOND YIELDS AND STOCKS BEFORE 2000...A lot of attention is being given to what falling bond yields mean for the U.S. economy and stock market. I've written several books on intermarket analysis that explain the impact that bond yields have on the stock market (and eventually...
READ MORE
MEMBERS ONLY

State of the Stock Market - Index and Sector Breadth Models Take Hits

by Arthur Hill,
Chief Technical Strategist, TrendInvestorPro.com
Watch for Rising Correlation
...The overall state of the stock market is the most important factor to consider when trading or investing in stocks. Broad market movements, by definition, affect most stocks. When the major stock indexes are trending lower, most stocks will also trend lower. Some will buck the...
READ MORE
MEMBERS ONLY
Futures Rally As Wall Street Tries To Show A Little "Sole"

by Tom Bowley,
Chief Market Strategist, EarningsBeats.com
Special Event
I am hosting a HUGE event on Monday, August 19th at 4:30pm EST as I release my Top 10 Stocks for my Model, Aggressive and Income portfolios. Each of these portfolios has crushed the benchmark S&P 500 since their respective inceptions and for a mere...
READ MORE
MEMBERS ONLY
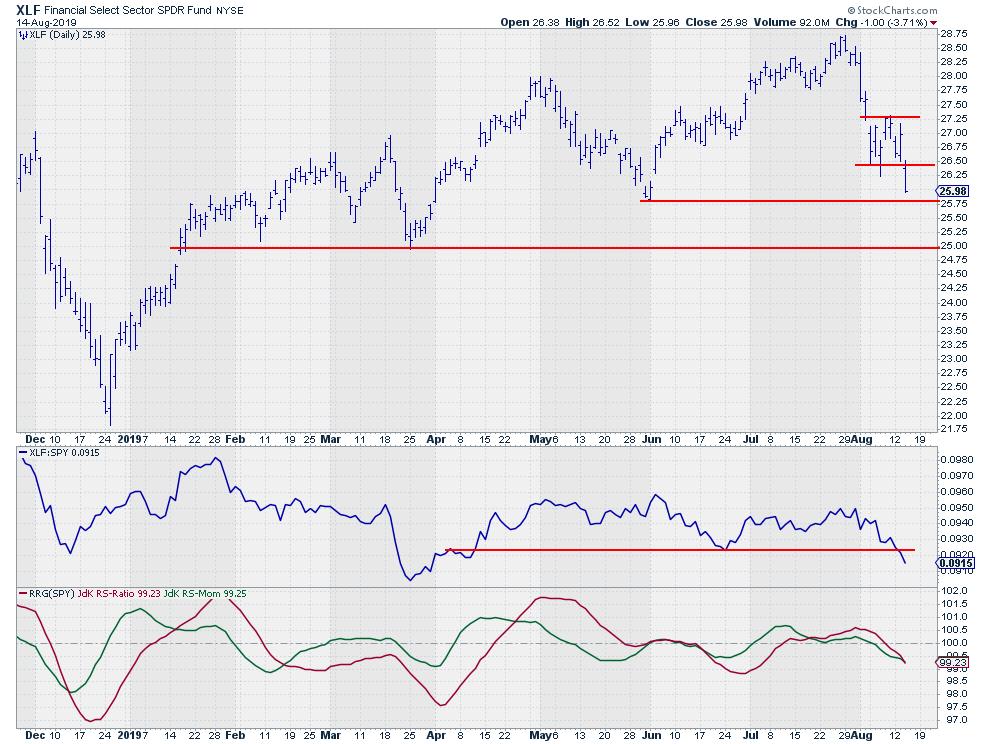
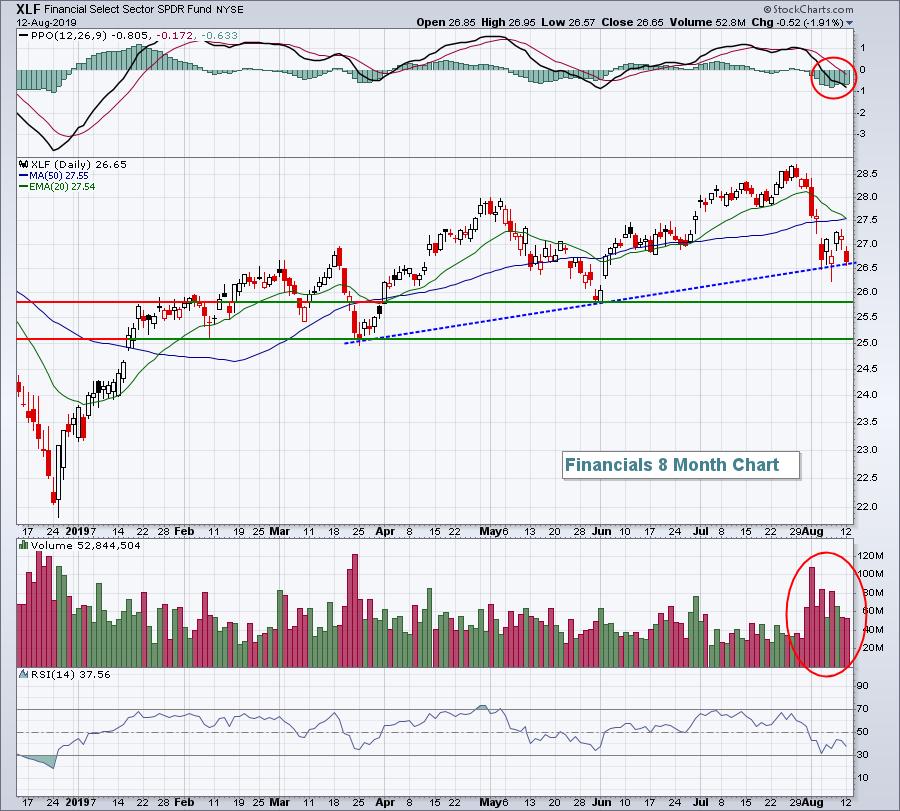
Financials Are Breaking (more) Support While Rotating Into the Lagging Quadrant On The RRG

by Julius de Kempenaer,
Senior Technical Analyst, StockCharts.com
On the Relative Rotation Graph for US sectors, the tail on XLF, the Financials sector, caught my eye this morning. After a short stint through the leading quadrant, XLF had a sharp turn lower and entered the weakening quadrant, in which it spent only three days before rotating into lagging....
READ MORE
MEMBERS ONLY

DP Mid-Week: More Like a Dead Mouse Bounce - IT Neutral Signals

by Erin Swenlin,
Vice President, DecisionPoint.com
The market has been flinging us around a lot this past week. I had been looking for a better bounce off the 200-EMA than we got; usually we use the term "dead cat" bounce, but in this case it was so small that I call it a "...
READ MORE
MEMBERS ONLY

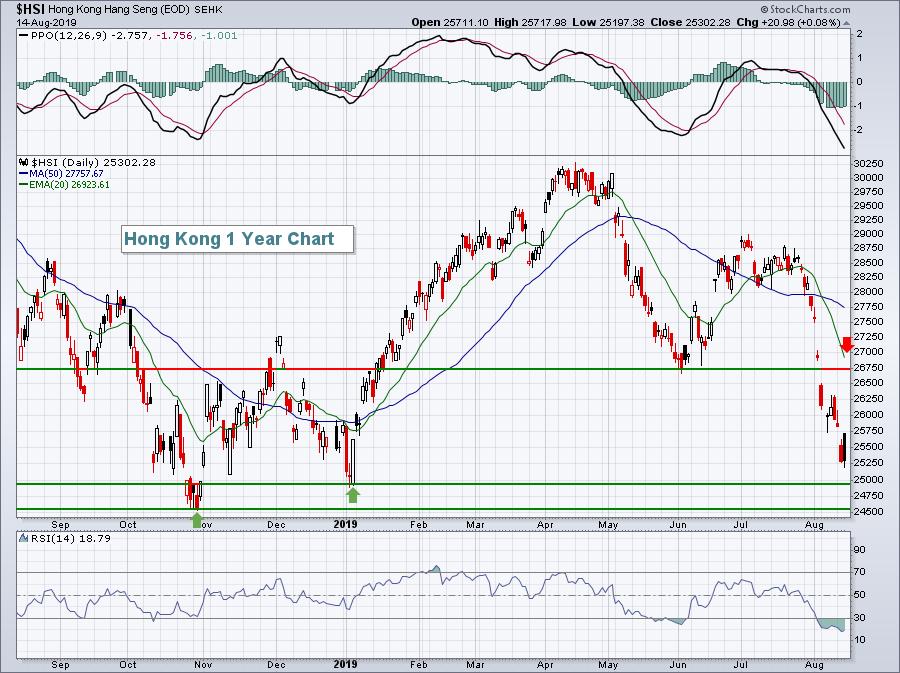
GLOBAL STOCKS UNDER HEAVY SELLING PRESSURE -- TEN-YEAR YIELD FALLS BELOW 2-YEAR -- RETEST OF 200-DAY AVERAGES APPEARS LIKELY
by John Murphy,
Chief Technical Analyst, StockCharts.com
MORE HEAVY STOCK SELLING...Global stocks are under heavy selling pressure again today. Bond yields continue to drop around the world. The ten-year Treasury yield dropped below the 2-year yield for the first time since 2007 which has created a second inversion of the yield curve. The 10-year yield fell...
READ MORE
MEMBERS ONLY

A Bearish Continuation Pattern Takes Shape in IWM
by Arthur Hill,
Chief Technical Strategist, TrendInvestorPro.com
The Russell 2000 iShares (IWM) has been underperforming for some time now and remains the weakest of the major index ETFs. The chart below shows IWM forming a lower high from May to July and a lower low from March to May. Adding a couple of trend lines to these...
READ MORE
MEMBERS ONLY
Tuesday Was Nothing More Than A Bounce In A Market Downtrend
by Tom Bowley,
Chief Market Strategist, EarningsBeats.com
Market Recap for Tuesday, August 13, 2019
I received an email the other day after I discussed the rising volatility ($VIX) and likely move lower and it stated "Tom, I thought you were bullish. Why the bearish view now?". Let me address this because maybe some others are...
READ MORE
MEMBERS ONLY

Stock Market Time

by Bruce Fraser,
Industry-leading "Wyckoffian"
Recently the stock market indexes entered a period of extreme volatility. Seemingly random events sent the indexes into rapid declines. These unexpected events blindsided many traders and investors. Stops were hit on positions that only moments prior seemed to have a safe cushion of profit.
When markets become volatile and...
READ MORE
MEMBERS ONLY
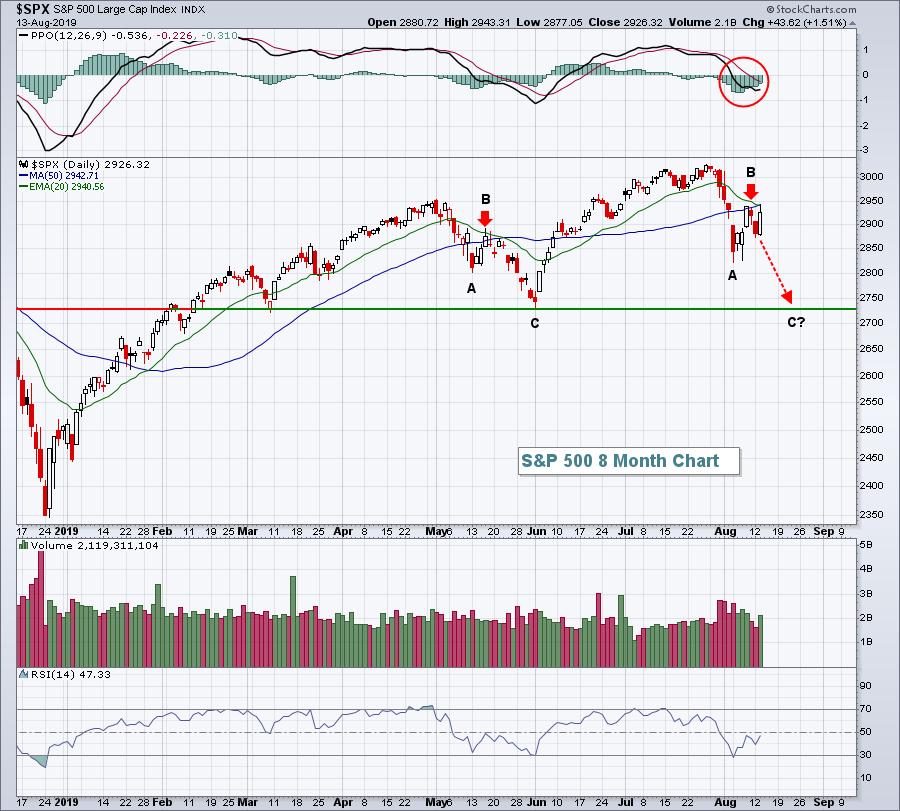
Starting To Shape Up Like An ABC Correction
by Tom Bowley,
Chief Market Strategist, EarningsBeats.com
Market Recap for Monday, August 12, 2019
The flight to safety was clear on Monday. The 10 year treasury yield ($TNX) tumbled once again, falling 9 basis points to 1.63%, inching closer and closer to the historic TNX lows that were set in 2012 and 2016. The all-time low...
READ MORE
MEMBERS ONLY
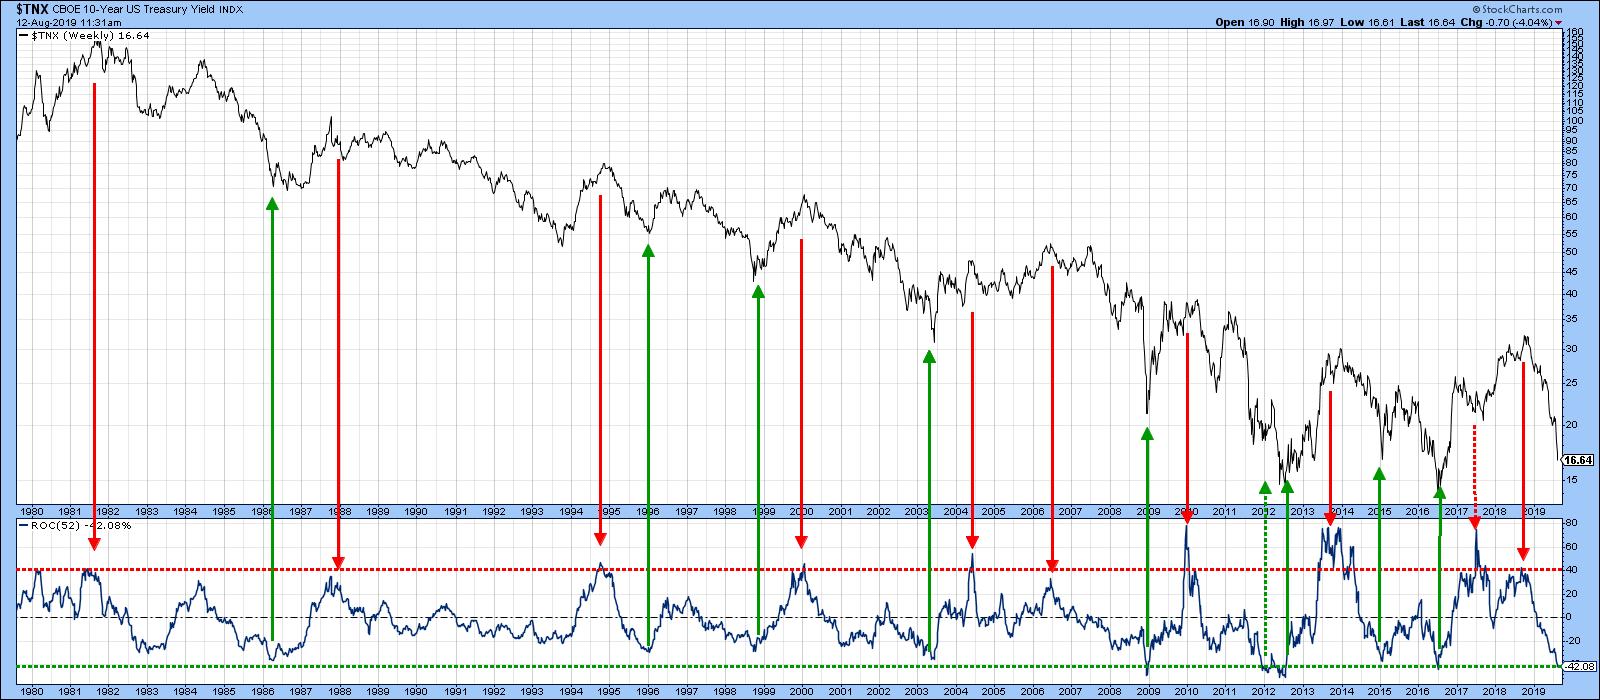
Thinking the Unthinkable - Bonds are Peaking

by Martin Pring,
President, Pring Research
* Long-Term Bond Oscillators Almost Fully Stretched
* Key Reversal Bars and Other Evidence Suggests Bonds are Exhausted on the Upside
* The Trend is Your Friend.... Until It Isn't
About a month ago, I wrote an article entitled "Bond Yields May Not Be Headed Lower After All". In...
READ MORE
MEMBERS ONLY
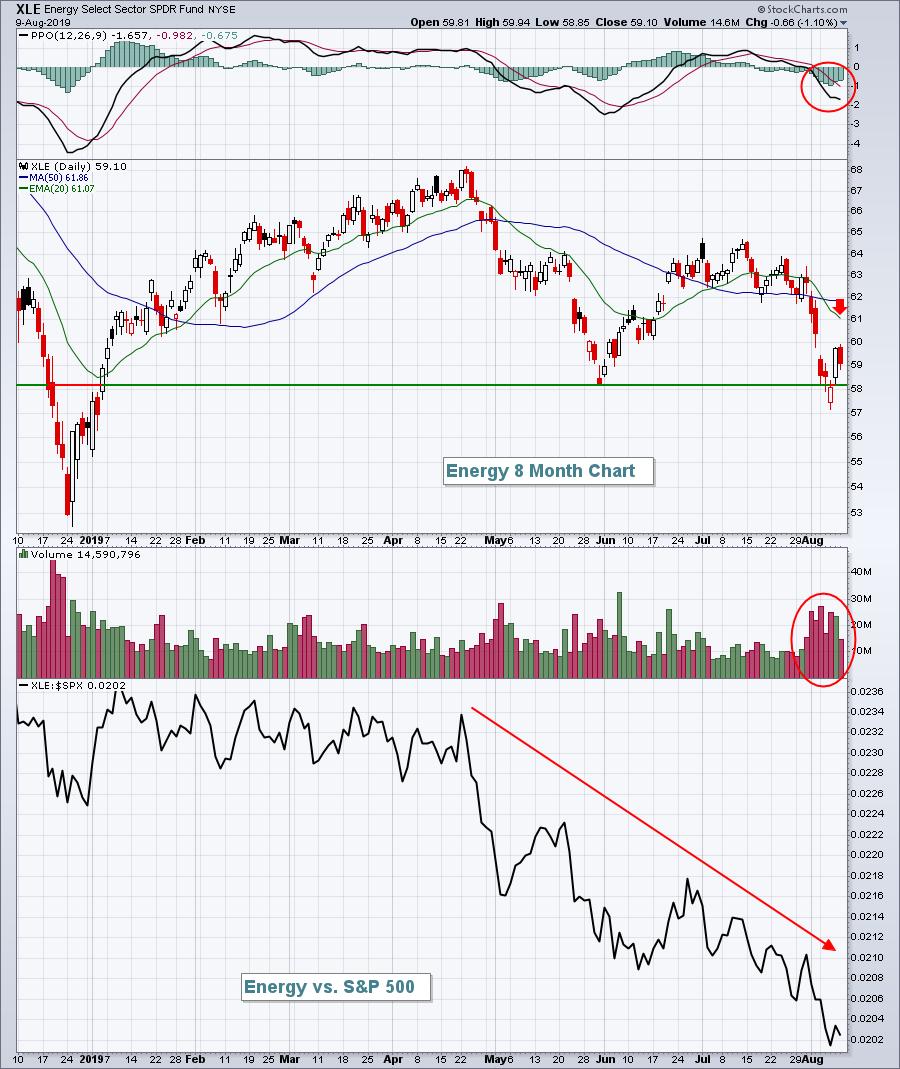
Energy Failing To Show Absolute Or Relative Strength....With One Exception
by Tom Bowley,
Chief Market Strategist, EarningsBeats.com
Special Note
If you didn't have a chance to read my blog post from Saturday, "I'm Returning To My Roots At EarningsBeats.com", be sure to check it out. I'll be explaining a lot more about my decision and discussing my three...
READ MORE
MEMBERS ONLY

This Biotech Kept its Head while Others Lost Theirs
by Arthur Hill,
Chief Technical Strategist, TrendInvestorPro.com
If you can keep your head when all about you are losing theirs ....Rudyard Kipling
The line above comes from the Poem, "If" by Rudyard Kipling. We can rephrase this when looking at stocks over the last few weeks.
If a stock can hold above the late July...
READ MORE
MEMBERS ONLY
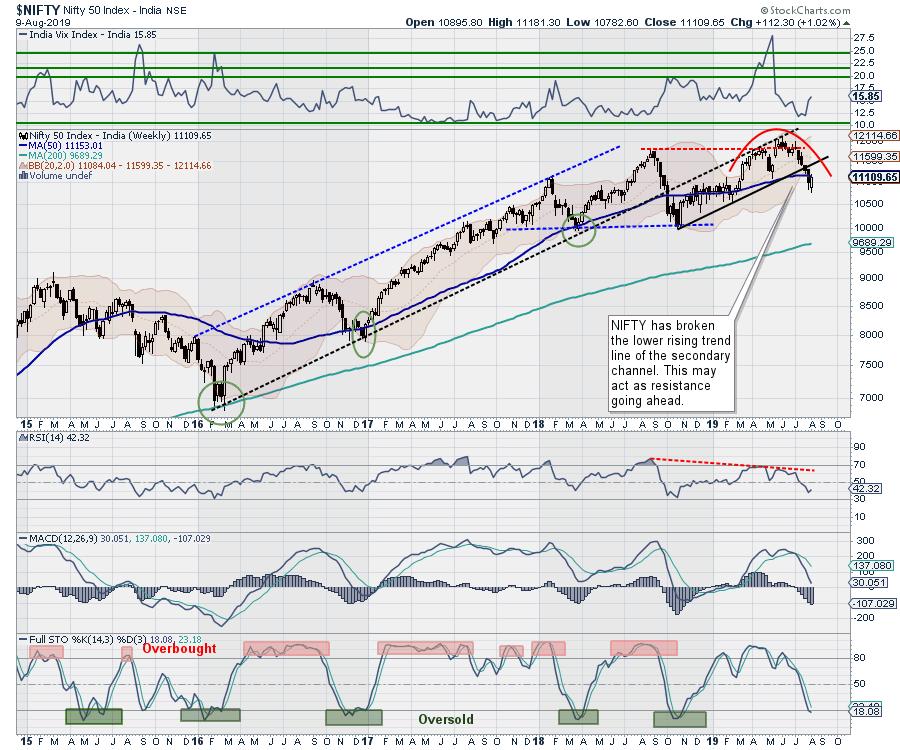
Week Ahead: Range-Bound Move Expected In The Truncated Week; These Sectors May Relatively Outperform

by Milan Vaishnav,
Founder and Technical Analyst, EquityResearch.asia and ChartWizard.ae
After bouncing off its 100-Week MA in the previous week, the markets attempted to take a breather and stabilize during the past week. The NIFTY was able to bounce back once again from the 100-Week MA; this pullback was aided by the oversold nature of the markets on the short-term...
READ MORE
MEMBERS ONLY

I'm Returning To My Roots At EarningsBeats.com!
by Tom Bowley,
Chief Market Strategist, EarningsBeats.com
Wow, it's been a great ride here at StockCharts.com!
The ride's not completely over, but I'm making a big change (and with mixed emotions) as I leave my role as Sr. Technical Analyst at StockCharts.com, effective September 15, 2019, and return to...
READ MORE
MEMBERS ONLY

STOCKS END MODESTLY LOWER AFTER VOLATILE WEEK -- REITS AND UTILITIES WERE THE WEEK'S STRONGEST SECTORS -- ENERGY AND FINANCIALS THE WEAKEST -- MATERIALS ARE BEING LED HIGHER BY GOLD MINERS -- WHILE COPPER MINERS REMAIN WEAK
by John Murphy,
Chief Technical Analyst, StockCharts.com
STOCKS END MODESTLY LOWER AS BOND YIELDS WEAKEN...After a week of wild swings, stocks ended only modestly lower on the week. The devaluation of the Chinese yuan to the lowest level in more than a decade set the tone for a volatile week in financial markets. The 10-year Treasury...
READ MORE
MEMBERS ONLY
5 Best Industry Groups Not Named Software (And Stocks To Trade In Each)

by John Hopkins,
President and Co-founder, EarningsBeats.com
I know it's summer, and we generally think defensively during this time of year, but there are still very strong areas with tremendous momentum that you should be considering. I'll give you my top five industry groups with a stellar individual stock performer within each group....
READ MORE
MEMBERS ONLY
Achieve Clarity In A Nuanced Stock Market By Maximizing Relative Strength In Three Investing Arenas

by Gatis Roze,
Author, "Tensile Trading"
The stock market is indeed a nuanced creature. With that in mind, I'd like to show you how to use Relative Strength to understand what this creature is actually doing. You'll find that my suggested use of Relative Strength will keep your probability of success in...
READ MORE
MEMBERS ONLY
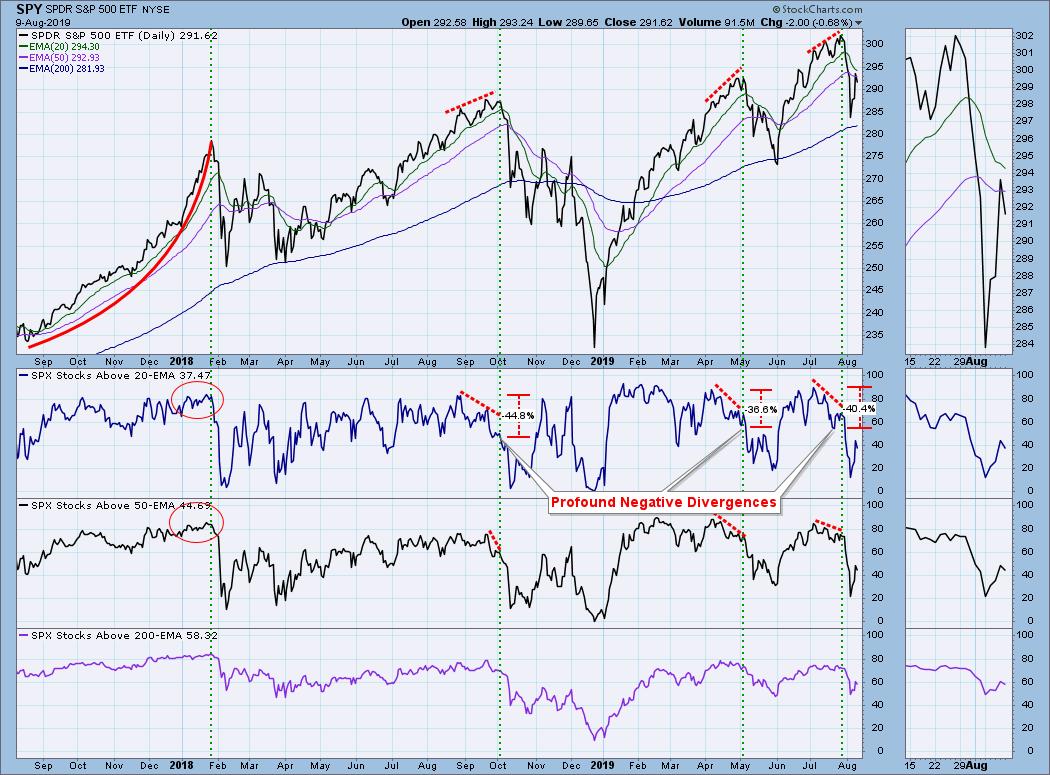
DP WEEKLY WRAP: Important New Look at an Old Indicator

by Carl Swenlin,
President and Founder, DecisionPoint.com
One thing that we technical analysts like to spot at price tops is an indicator flashing a negative divergence, which is an indicator that is trending downward while price continues to trend upward. Such divergences imply that internals are eroding under the rising price, and that a price correction could...
READ MORE
MEMBERS ONLY
The Risk Is Real – 3 Stock Candidates That Can Offer Solace In A Chaotic Market

by Mary Ellen McGonagle,
President, MEM Investment Research
It was a wild week on Wall Street as the markets continued to gyrate in response to the latest trade related headlines. Those who went on vacation for the week may have been served best as a market that was down as much as 3.8% at one point, closed...
READ MORE
MEMBERS ONLY
Taking the Pulse of SPDR Sectors - Defensive Sectors Have a Healthy Heartbeat
by Erin Swenlin,
Vice President, DecisionPoint.com
John Murphy joined us on MarketWatchers LIVE on Thursday (8/8/19) and showed us some very interesting charts on the Sector SPDRs. The deterioration of nearly all of them prompted me to look at them using the Price Momentum Oscillator (PMO) in CandleGlance.
Let's start by looking...
READ MORE
MEMBERS ONLY

Finding Sectors and Stocks that Held Up During the Onslaught
by Arthur Hill,
Chief Technical Strategist, TrendInvestorPro.com
The S&P 500 hit a new high in late July and then got pummeled in early August with a sharp decline that broke the 50-day EMA. Moving averages like this can serve benchmark levels that chartists can use to compare performance. Stocks and ETFs that did not break...
READ MORE
MEMBERS ONLY
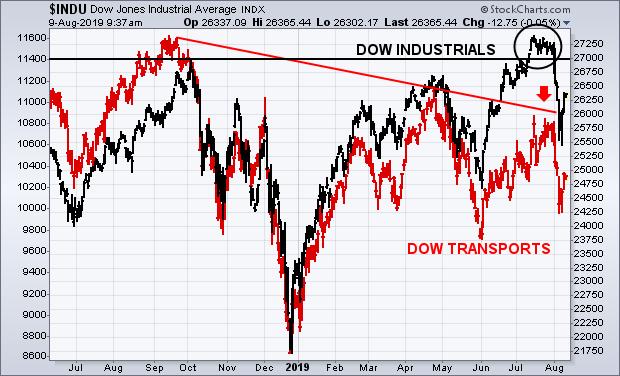
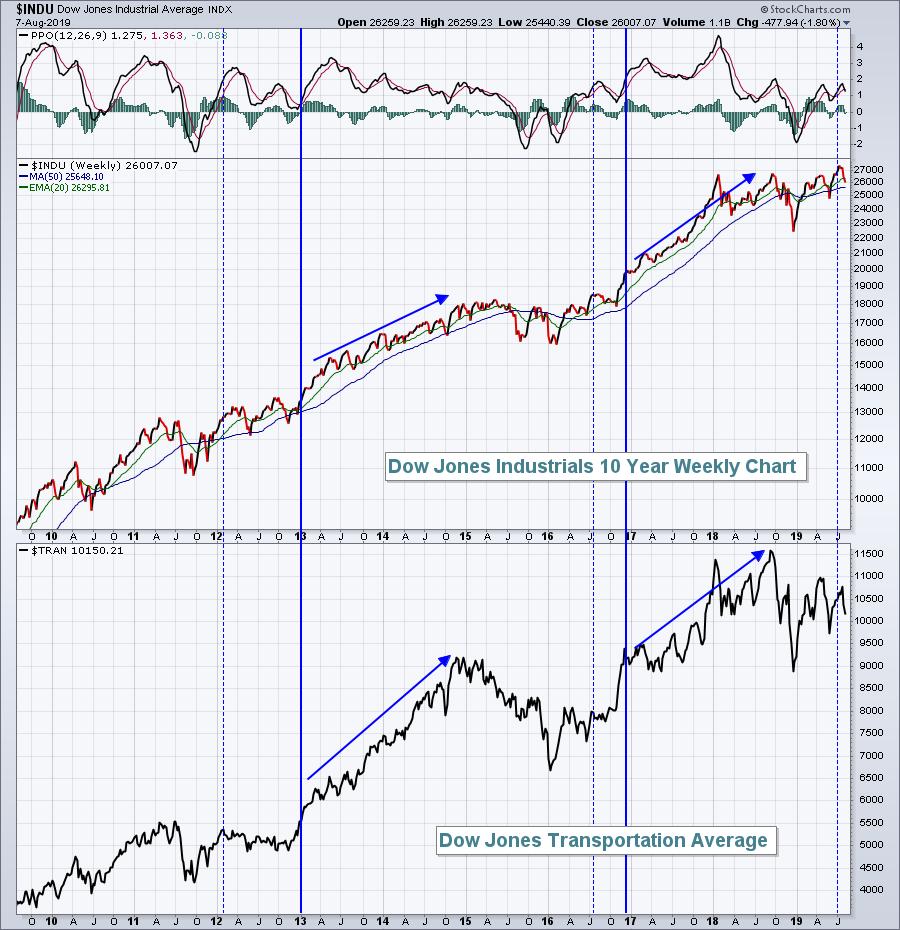
Transports Continue to Lag Behind the Dow Industrials
by John Murphy,
Chief Technical Analyst, StockCharts.com
Editor's Note: This article was originally published in John Murphy's Market Message on Friday, August 9th at 12:27pm ET.
I was asked during an interview on StockCharts TV yesterday whether I was concerned about the Dow Theory divergence between the Dow Industrials and the Dow...
READ MORE
MEMBERS ONLY

TRANSPORTS CONTINUE TO LAG BEHIND THE DOW INDUSTRIALS WHICH IS A DOW THEORY WARNING -- THE FACT THAT UTILITIES ARE THE STRONGEST OF THE THREE DOW AVERAGES MAY BE ANOTHER WARNING
by John Murphy,
Chief Technical Analyst, StockCharts.com
TRADITIONAL DOW THEORY DIVERGENCE...I was asked during an interview on Stockcharts TV yesterday whether I was concerned about the Dow Theory divergence between the Dow Industrials and the Dow Transports. I responded that I was. But with an additional twist to that theory which is also giving a warning...
READ MORE
MEMBERS ONLY

The State of the Stock Market (with video) - A Pick up in Volatility
by Arthur Hill,
Chief Technical Strategist, TrendInvestorPro.com
Volatility reared its ugly head this week with the S&P 500 falling around 6% in six days and then rebounding with a sharp three-day bounce. This is the biggest decline since the May-June correction, and the sharpest decline since early December. Looking back, the S&P 500...
READ MORE
MEMBERS ONLY
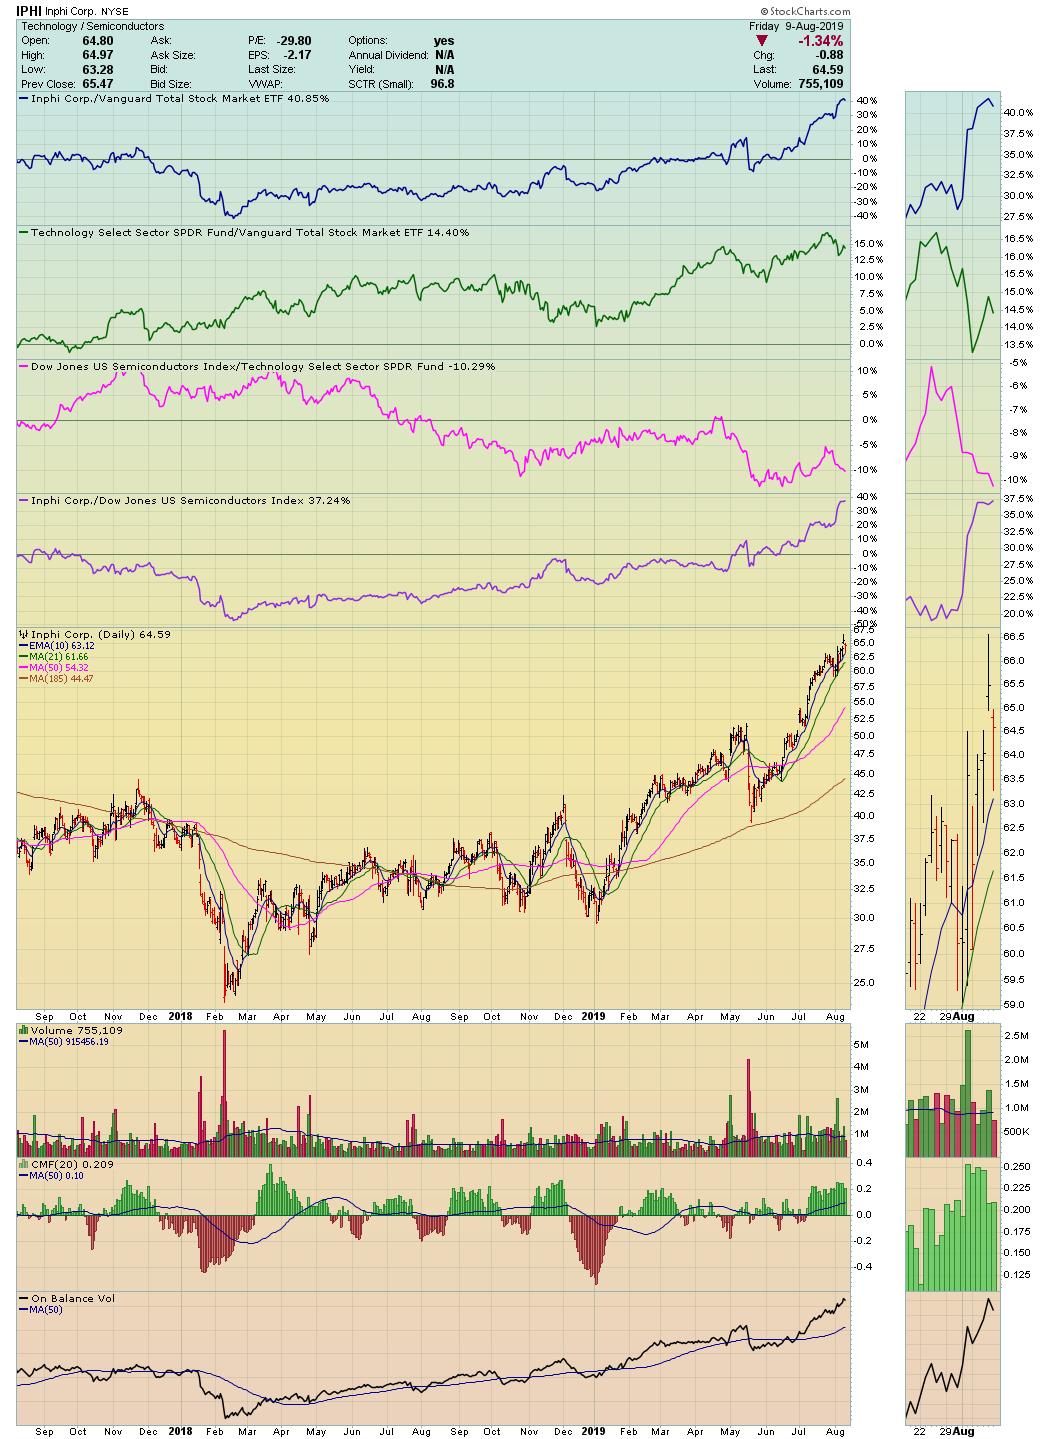
It's Make Or Break Time For Telecommunications Equipment Stocks
by Tom Bowley,
Chief Market Strategist, EarningsBeats.com
Market Recap for Thursday, August 8, 2019
Thursday was a trend day for U.S. stocks, one in which the action was positive from start to finish. It's generally viewed bullishly and as a sign of accumulation. However, I don't know if I'd grow...
READ MORE
MEMBERS ONLY

STOCKS BUILD ON YESTERDAY'S UPSIDE INTRA-DAY REVERSAL -- THE DOW CONTINUES REBOUND OFF 200-DAY AVERAGE -- SO DO INDUSTRIALS AND FINANCIALS -- BANKS BOUNCE OFF SUPPORT -- SO DO SMALL CAPS AND TRANSPORTS -- VIX FALLS BACK BELOW 20 LEVEL
by John Murphy,
Chief Technical Analyst, StockCharts.com
STOCK INDEXES CONTINUE REBOUND...Yesterday's impressive intra-day rebound in stocks is continuing into today's trading.Chart 1 shows the Dow Industrials surviving a test of its 200-day moving average yesterday; and building on that today. That's an encouraging sign. But it still needs to...
READ MORE
MEMBERS ONLY
DP Mid-Week Alert: Possible Silver Lining on the Short-Term Horizon
by Erin Swenlin,
Vice President, DecisionPoint.com
It's been a difficult week for the markets since the last publication of the Mid-Week Alert and the knife is falling fast. However, I'm putting my hands out there right now to catch it based on signs of life on our short-term indicators. The market is...
READ MORE
MEMBERS ONLY
This Is How To Pick Relative Strength Stocks To Improve Your Performance
by Tom Bowley,
Chief Market Strategist, EarningsBeats.com
Market Recap for Wednesday, August 7, 2019
It appeared as though we were heading for another big down day as our major indices opened down 2% or thereabouts. There was a huge rush into treasuries with the 10 year treasury yield ($TNX) dropping to an almost unfathomable 1.59% shortly...
READ MORE
MEMBERS ONLY
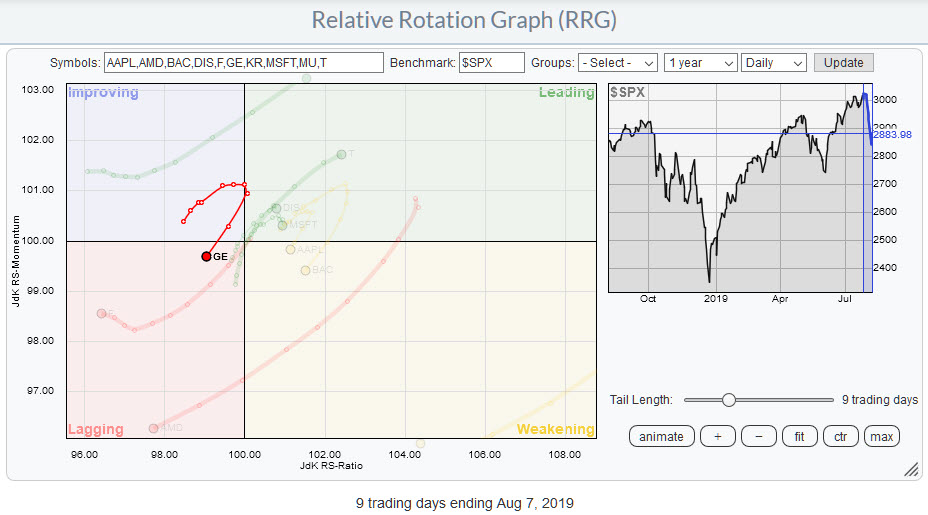
GE is Doing It Again!
by Julius de Kempenaer,
Senior Technical Analyst, StockCharts.com
A good way for you to check what has been driving a particular market is to go to the "Market Movers" widget on your dashboard and select the universe that you are interested in.
To the right, I have printed the table showing the top 10 most active...
READ MORE
MEMBERS ONLY

Seven Lucky Indicators Starting To Look Bullish
by Martin Pring,
President, Pring Research
* Three Short-Term Oscillators Positioned for a Rally
* Two Psychological Indicators Looking Bullish
* Just When You Thought Bonds Would Go Up Forever
Usually, it takes a long time for some of the indicators to reach what we might call "deep fear" levels, points from which important rallies can be...
READ MORE
MEMBERS ONLY

DOW INDUSTRIALS TEST THEIR 200-DAY LINE -- BANKS FALL BELOW THEIR RED LINE BUT ARE TESTING SUPPORT -- SMALL CAPS AND TRANSPORTS DO THE SAME -- VIX INDEX IS TESTING ITS MAY HIGH
by John Murphy,
Chief Technical Analyst, StockCharts.com
DOW TESTS 200-DAY AVERAGE...Chart 1 shows the Dow Industrials testing their 200-day moving average (red line). The 14-day RSI line has dipped below 30 signalling a short-term oversold condition. That's the first important test of support for the Dow.
BANKS HAVE A BAD DAY...Falling bond yields...
READ MORE
MEMBERS ONLY

STOCKS DROP EVEN FURTHER AS BOND YIELDS PLUNGE -- THREE MORE CENTRAL BANKS LOWER RATES -- MONEY CONTINUES TO FLOW INTO SAFE HAVEN GOLD AND JAPANESE YEN -- U.S. STOCKS LOOK MORE VULNERABLE -- 200-DAY MOVING AVERAGES ARE BEING THREATENED
by John Murphy,
Chief Technical Analyst, StockCharts.com
S&P 500 STILL LOOKS VULNERABLE...U.S. stocks are under pressure again today. Another plunge in global bond yields is undermining confidence in the global economy. Three more foreign central banks lowered rates today in New Zealand, India, and Thailand. That's feeding the "race to...
READ MORE
MEMBERS ONLY

Lockheed Martin Holds the Line
by Arthur Hill,
Chief Technical Strategist, TrendInvestorPro.com
Stocks were hit hard in August with the S&P 500 SPDR (SPY) moving below its 50-day line and mid July lows. Stocks and ETFs that did not break their 50-day lines and held above their mid July lows are showing relative "chart" strength. Lockheed Martin (LMT)...
READ MORE
MEMBERS ONLY
The S&P 500 Must Clear These 3 Levels
by Tom Bowley,
Chief Market Strategist, EarningsBeats.com
Market Recap for Tuesday, August 6, 2019
Ok, let's start with the good news. Our major indices all finished higher on Tuesday, rebounding from their worst day of 2019. Every sector except energy (XLE, -0.12%) finished the day higher and our 5 aggressive sectors were the 5...
READ MORE
MEMBERS ONLY
This is My Trendline, Which One is Yours?
by Julius de Kempenaer,
Senior Technical Analyst, StockCharts.com
Never a dull moment when it comes to the markets. Just when you thought you had it all figured out, Mr. Market throws us another curve-ball that we all have to deal with.
The last few days have been pretty hectic, given a 200-point drop in the S&P...
READ MORE
MEMBERS ONLY

STOCK MARKET NEEDS BROADER SECTOR PARTICIPATION -- SIX MARKET SECTORS HAVE YET TO HIT A NEW HIGH-- THREE THAT HAVE ARE DEFENSIVE IN NATURE -- ENERGY IS THE YEAR'S WEAKEST SECTOR
by John Murphy,
Chief Technical Analyst, StockCharts.com
SECTOR BREADTH ISN'T BROAD ENOUGH...One of the ways to measure the strength of the stock market's uptrend is to see how many of its eleven sectors have hit new highs with the major stock indexes. In a strong uptrend, most market sectors should be confirming...
READ MORE
MEMBERS ONLY
Selloffs Are All About Emotion; Watch These Sentiment Readings
by Tom Bowley,
Chief Market Strategist, EarningsBeats.com
Market Recap for Monday, August 5, 2019
It was a very bad day on Wall Street with our major indices having their worst day of 2019. Panic is setting in as the U.S. and China shoot trade war bullets back and forth at each other. China's Shanghai...
READ MORE
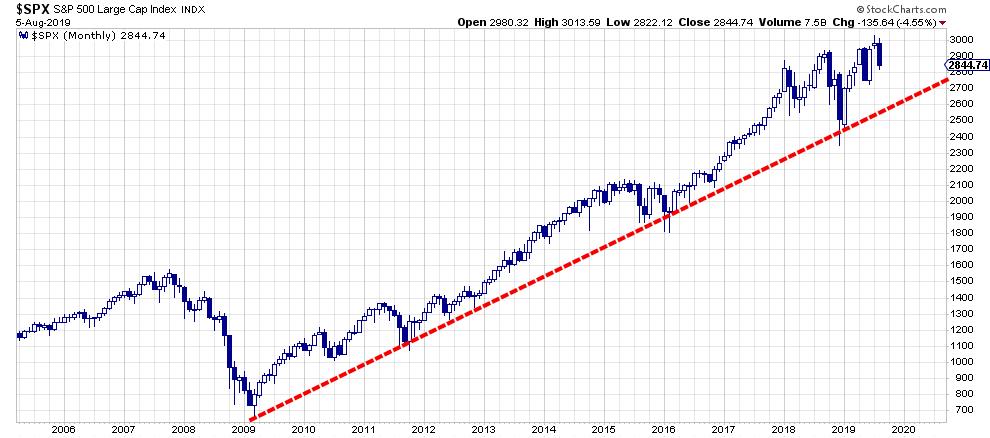
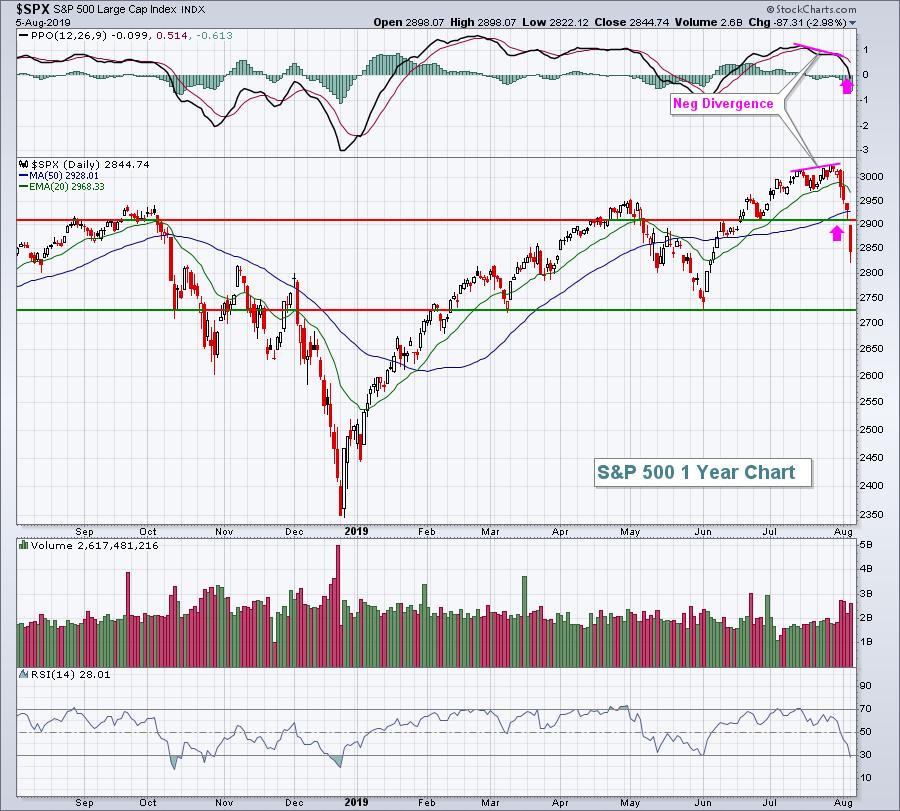
MEMBERS ONLY
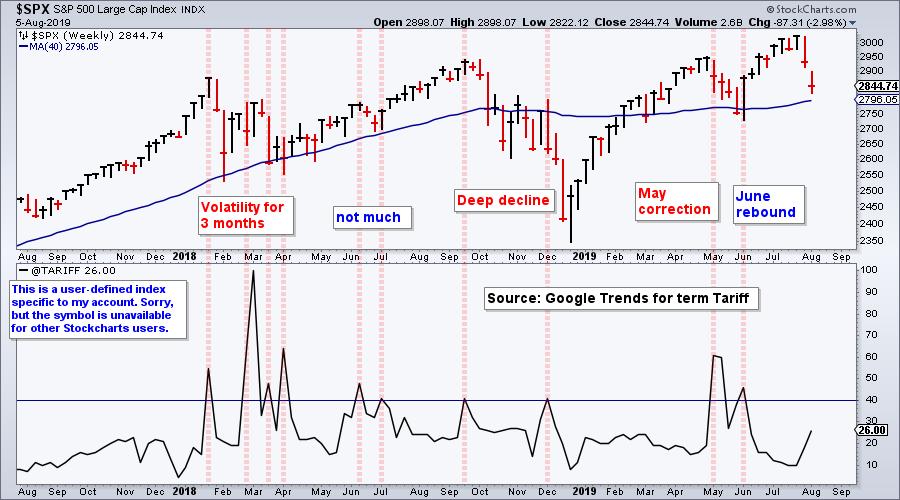
Charting Tariffs, Putting the Decline into Perspective and Considering a Mean-Reversion Bounce
by Arthur Hill,
Chief Technical Strategist, TrendInvestorPro.com
Stocks were pummeled on Monday with the S&P 500 falling the most (2.98%) since December 2018. The Russell 2000 and Nasdaq 100 also fell more than 3% with widespread selling pressure. I am not going to start the blame game (tariffs, the Fed, early August seasonal patterns,...
READ MORE
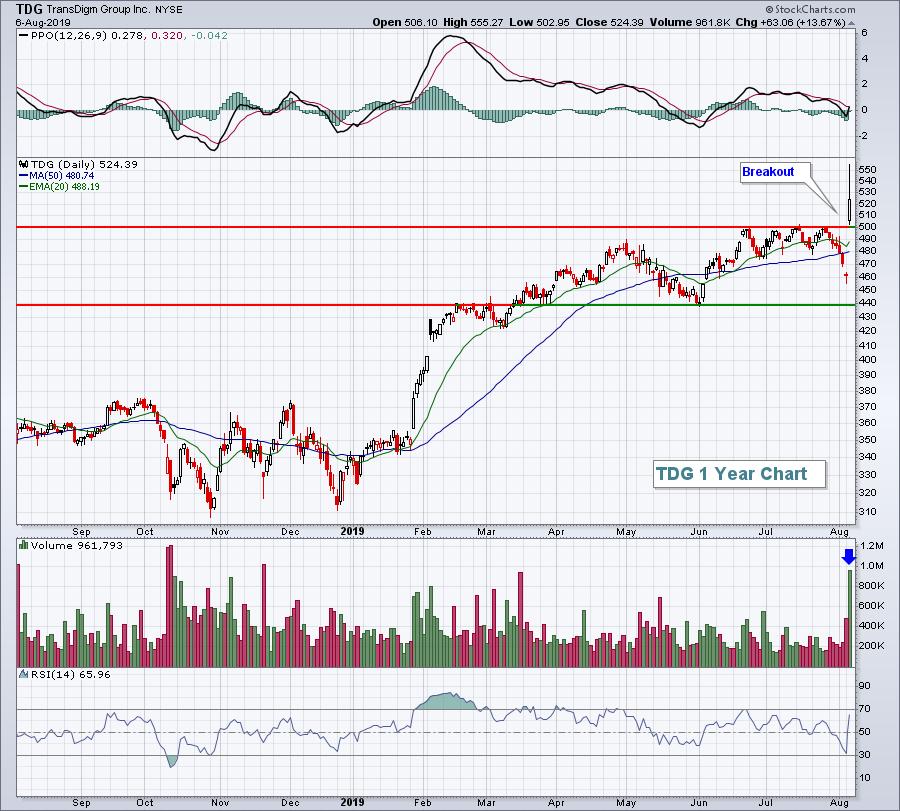
MEMBERS ONLY
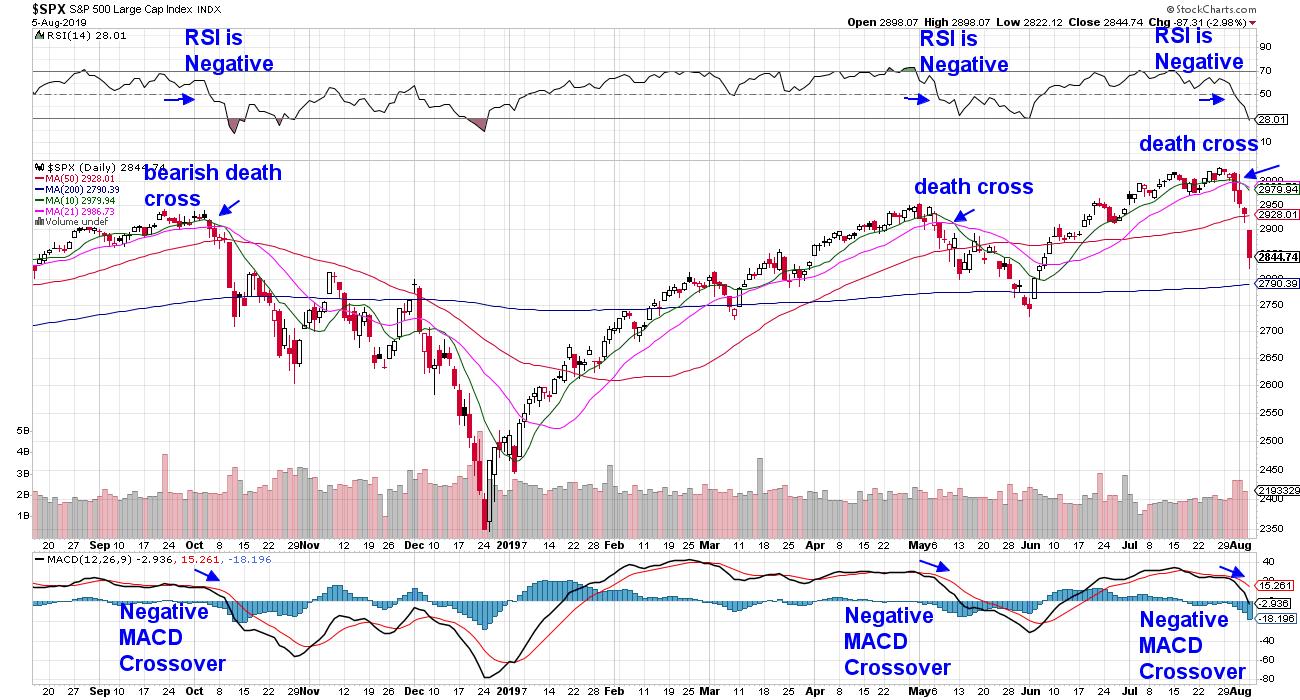
Momentum Shift: Death Cross Is Pointing To More Downside
by Mary Ellen McGonagle,
President, MEM Investment Research
The broader markets have taken quite a hit over the last several days. While some indicators are close to being in oversold positions, the upside momentum may well have shifted.
One signal that identifies this is the Death Cross, as it is called. A death cross is generated when a...
READ MORE