MEMBERS ONLY
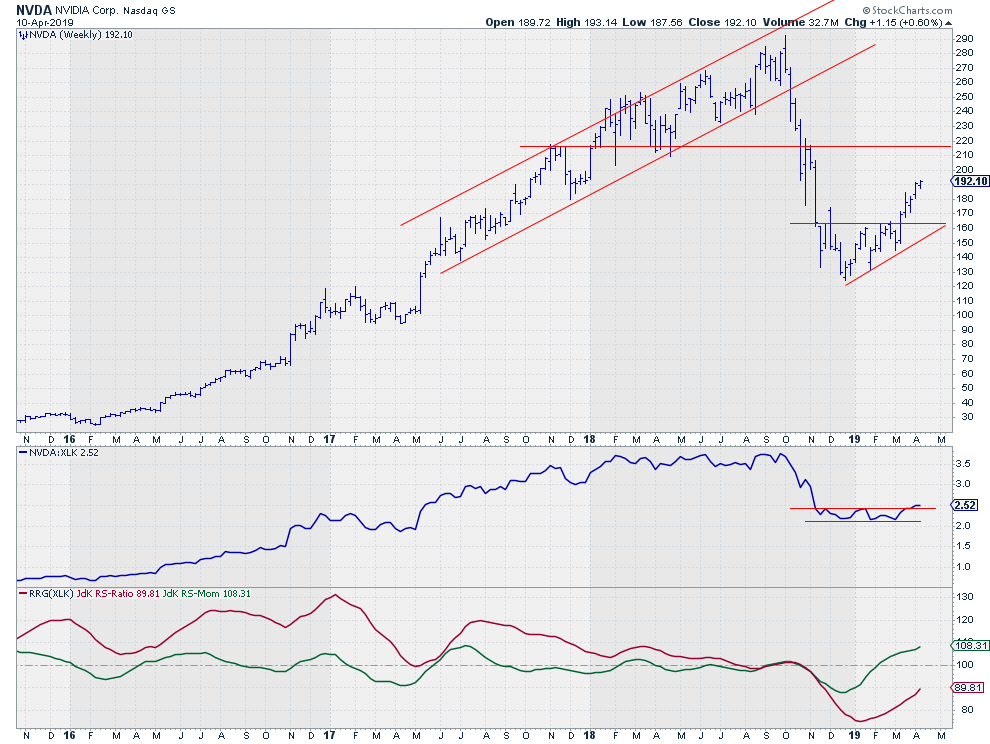
Is NVDA The Strongest Stock In The Strongest Sector?

by Julius de Kempenaer,
Senior Technical Analyst, StockCharts.com
Looking over some Relative Rotation Graphs this morning showed me that the Information Technology sector is currently the strongest sector in the S&P 500 universe.
XLK is positioned well inside the leading quadrant and is being powered further into that space by a long tail. It is difficult...
READ MORE
MEMBERS ONLY

DP Alert: New BUY Signal for Gold - TLT Rallies Off Support Despite PMO SELL Signal

by Erin Swenlin,
Vice President, DecisionPoint.com
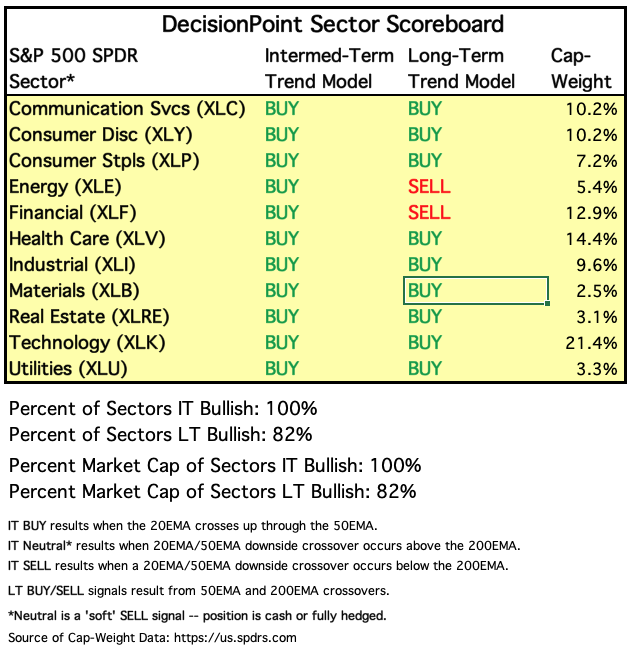
There are no changes this week on the DecisionPoint Scoreboards or on the DecisionPoint Sector Scoreboard. The market appears strong, but there are a few items under the hood I'm concerned about. Good news for Gold as it just triggered a Price Momentum Oscillator (PMO) BUY signal today....
READ MORE
MEMBERS ONLY

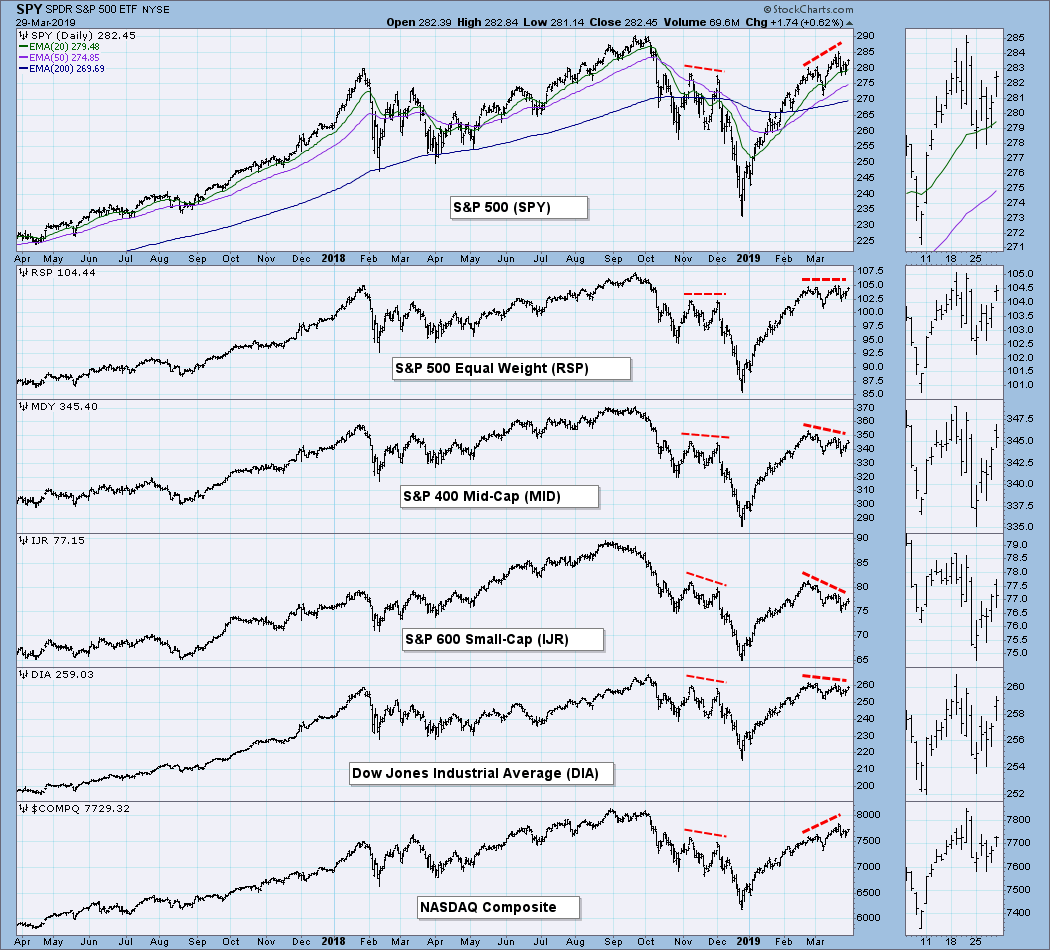
RUSSELL 2000 IS TRYING TO CLEAR ITS 200-DAY AVERAGE -- SO ARE AIRLINES AND ENERGY STOCKS -- BANKS ARE HOLDING FINANCIALS BACK -- WHILE MORTGAGE FINANCE STOCKS ARE LEADING THEM HIGHER -- MEXICO AND SOUTH KOREA ETFS CLEAR THEIR 200-DAY LINE

by John Murphy,
Chief Technical Analyst, StockCharts.com
RUSSELL 2000 SMALL CAP INDEX IS TRYING TO CLEAR ITS 200-DAY AVERAGE... Last Wednesday's message showed the S&P 400 Mid Cap Index clearing its 200-day average; and suggested that left only the small caps to join the market rally. That may be about to happen. Chart...
READ MORE
MEMBERS ONLY

WYNN Win

by Bruce Fraser,
Industry-leading "Wyckoffian"
Wynn Resorts is a favorite stock to study. WYNN tends to have big cyclical trends which repeat over and over again. These trends are wonderfully persistent in their upward and downward movements. Also prior to a major change of trend, a Cause builds for either Accumulation or Distribution. And these...
READ MORE
MEMBERS ONLY
Financials Do Have Pockets Of Strength

by Tom Bowley,
Chief Market Strategist, EarningsBeats.com
Market Recap for Tuesday, April 9, 2019
Profit taking dominated Tuesday's action with the small cap Russell 2000 leading the list of losers, dropping 1.22%. But sellers were most everywhere as the Dow Jones, S&P 500 and NASDAQ fell 0.72%, 0.61% and 0....
READ MORE
MEMBERS ONLY

Overbought Means Up A Lot

by David Keller,
President and Chief Strategist, Sierra Alpha Research
I was once asked the classic “trapped on a desert island” question, with a technical analysis twist: If you could only have one technical indicator (except price), which would it be?
For me, that’s an easy one. RSI.
As part of my training experience at Bloomberg, I was introduced...
READ MORE
MEMBERS ONLY
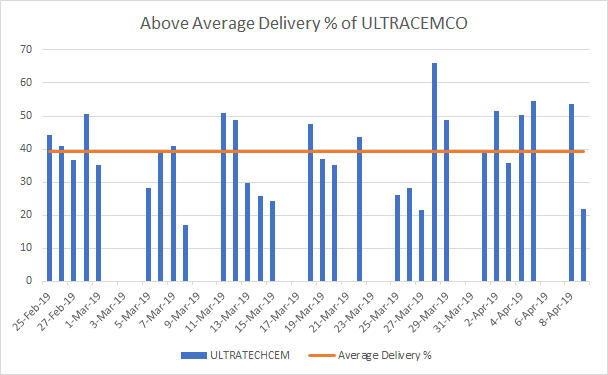
Complex Inverted H&S Formation on ULTRACEMCO; Higher Delivery Percentage May Give Directional Clues

by Milan Vaishnav,
Founder and Technical Analyst, EquityResearch.asia and ChartWizard.ae
A couple of days back, the NIFTY marked a classical Double Top at the 11760 level. The benchmark index has halted its up move and can be seen consolidating just below that level. Over the coming days, the markets are expected to remain highly stock-specific. Right now, ULTRACEMCO.IN deserves...
READ MORE
MEMBERS ONLY

Global Stocks and Bitcoin are Breaking to the Upside

by Martin Pring,
President, Pring Research
* Global Stocks Join Global A/D Line Above Key Trend Lines
* Bitcoin Looking Better After an 80% Drop
* Inflation vs. Deflation
Global Stocks Join Global A/D Line Above Key Trend Lines
Global stocks, represented in the form of the MSCI World Stock ETF (ACWI), peaked in January of last...
READ MORE
MEMBERS ONLY
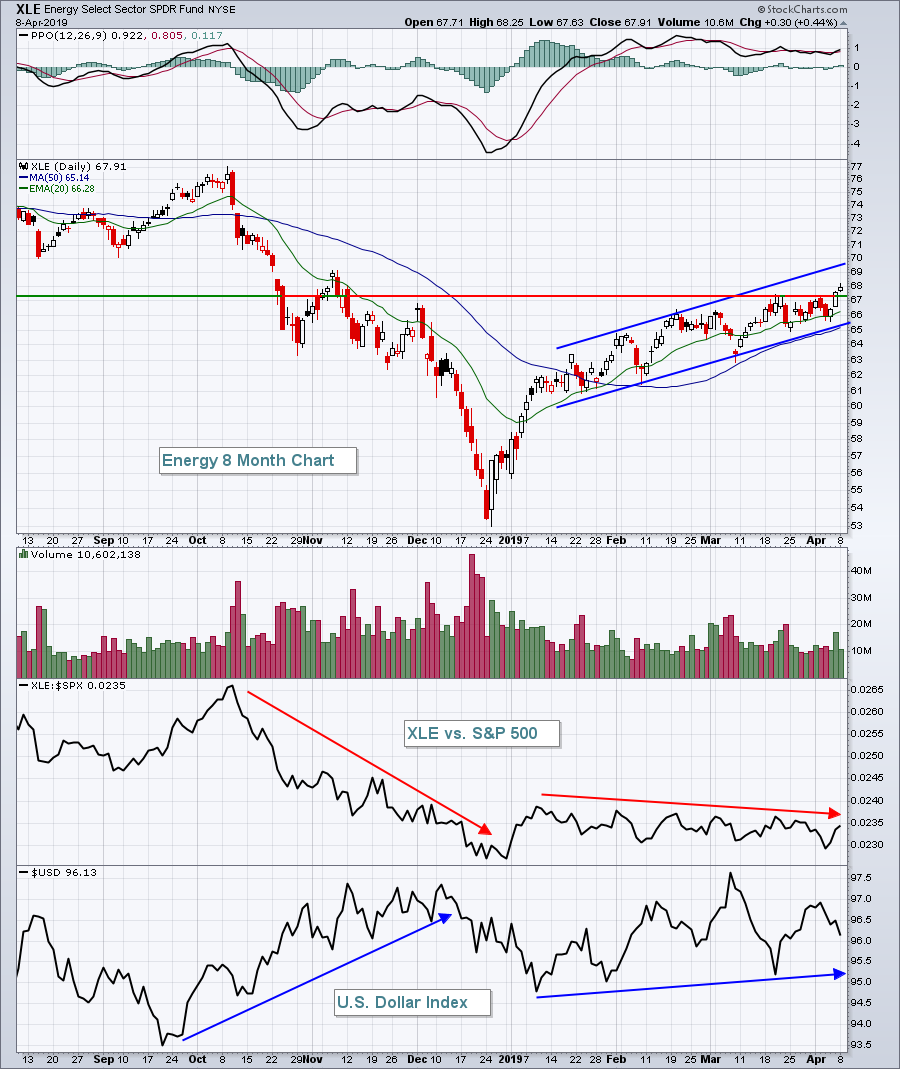
Energy At 5 Month High As Crude Prices Surge
by Tom Bowley,
Chief Market Strategist, EarningsBeats.com
Market Recap for Monday, April 8, 2019
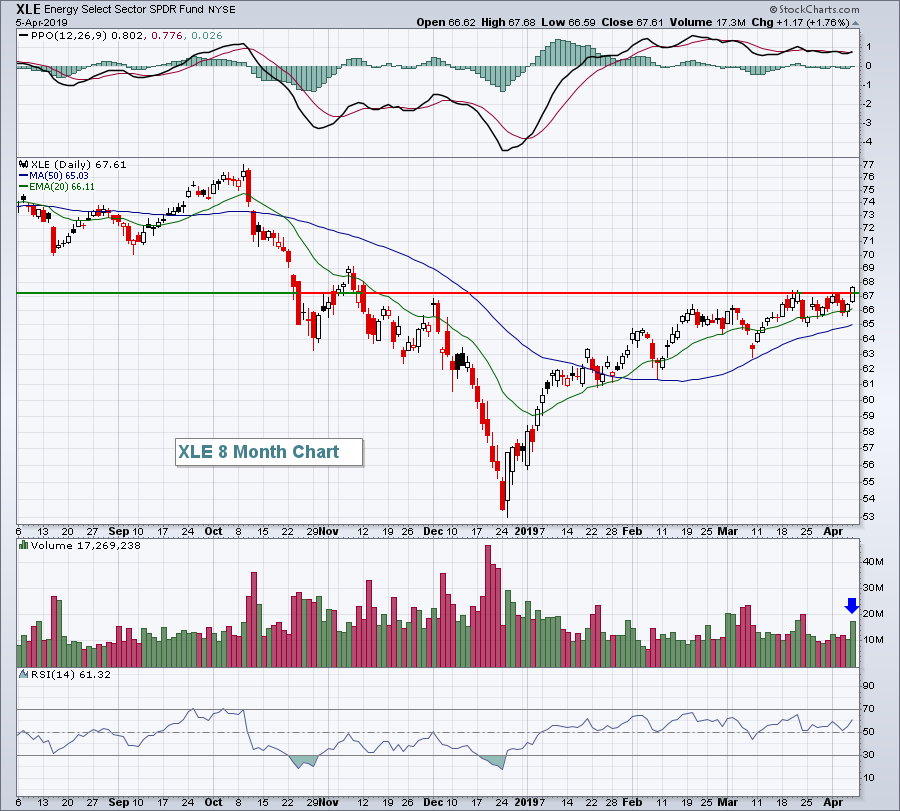
Crude oil prices ($WTIC, +2.09%) surged once again on Monday, and have now climbed 50% off their December low. While energy (XLE, +0.44%) has been a major beneficiary, as we would expect, the XLE has been mired in a downtrend vs....
READ MORE
MEMBERS ONLY
Relative Performance

by Greg Morris,
Veteran Technical Analyst, Investor, and Author
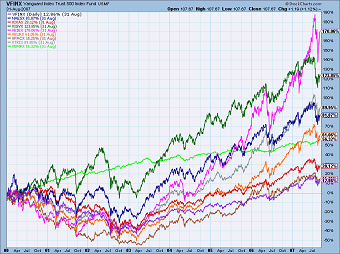
First of all, you cannot retire on relative performance. Relative performance is often a valuable tool, but is also a marketing concept dreamed up by financial pundits who rarely outperform the market. Table A is a table of various asset classes and their relative performance since 2009, with the last...
READ MORE
MEMBERS ONLY
Energy Rebounds Plus 10 Trade Setups For Today
by Tom Bowley,
Chief Market Strategist, EarningsBeats.com
Market Recap for Friday, April 5, 2019
Energy stocks (XLE, +1.76%) were the clear leader on Friday as Wall Street climbed once again. Recently, crude oil prices ($WTIC, +1.58%) opened April by posting new 2019 highs, but the XLE failed to follow suit, instead falling back to test...
READ MORE
MEMBERS ONLY

RSI for Trend-Momentum Strategies

by Arthur Hill,
Chief Technical Strategist, TrendInvestorPro.com
This post will provide a resource link and scan code from the On Trend episodes focusing on RSI for trend-following and momentum strategies. This is a two-part series that goes from RSI basics to a twenty year backtest on stocks in the S&P 500. These episodes will show...
READ MORE
MEMBERS ONLY
The 60/40 Balanced Portfolio Just Broke To New Highs - What About Stocks vs Bonds?
by Julius de Kempenaer,
Senior Technical Analyst, StockCharts.com
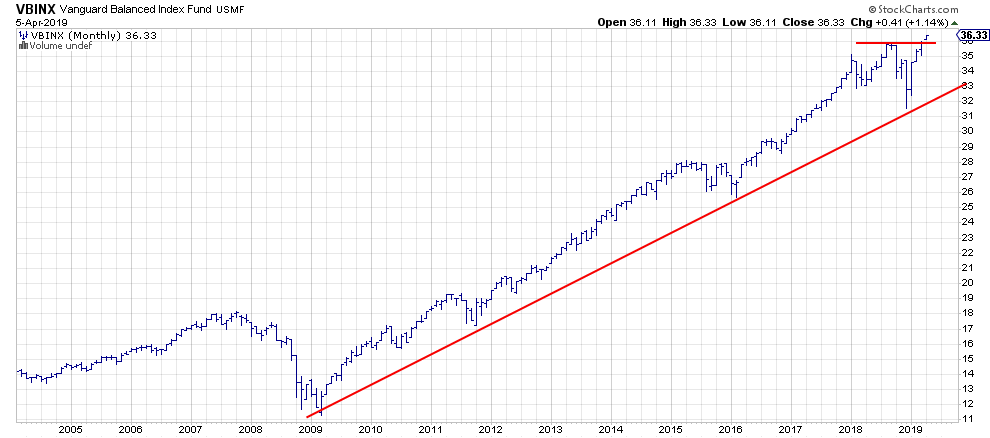
For asset allocation analysis, I generally use VBINX, a balanced index fund by Vanguard that holds 60% in stocks and 40% in a mix of different bonds.
This balanced portfolio (total return basis) just broke to new highs this week. Meanwhile, neither stocks (SPY) or bonds (IEF) have accomplished that,...
READ MORE
MEMBERS ONLY
Materials Sector (XLB) Bursts Through Resistance with Confirming LT Buy Signal
by Erin Swenlin,
Vice President, DecisionPoint.com
While I maintain the DecisionPoint Scoreboard for the large-cap SPX, OEX, NDX and Dow, Carl maintains a DecisionPoint "Sector" Scoreboard. On Friday's DecisionPoint show (which airs Fridays at 4:30p EST on StockCharts TV), Carl and I pointed out that the Materials sector triggered a new...
READ MORE
MEMBERS ONLY

RISING CHINESE STOCK MARKET IS BOOSTING INDUSTRIAL METALS AND STOCKS TIED TO THEM - THE GLOBAL METALS AND MINING PRODUCERS ISHARES HAVE TURNED UP -- RISING COMMODITY PRICES HELPED MAKE MATERIALS THE WEEK'S STRONGEST SECTOR
by John Murphy,
Chief Technical Analyst, StockCharts.com
POSITIVE IMPLICATIONS FROM A STRONGER CHINA... My Thursday message showed an index of foreign stocks turning higher, which relieved concerns that weaker foreign stocks could start to weigh on U.S. stocks (as they did near the end of last year). To the contrary, rising foreign stocks are now supporting...
READ MORE
MEMBERS ONLY
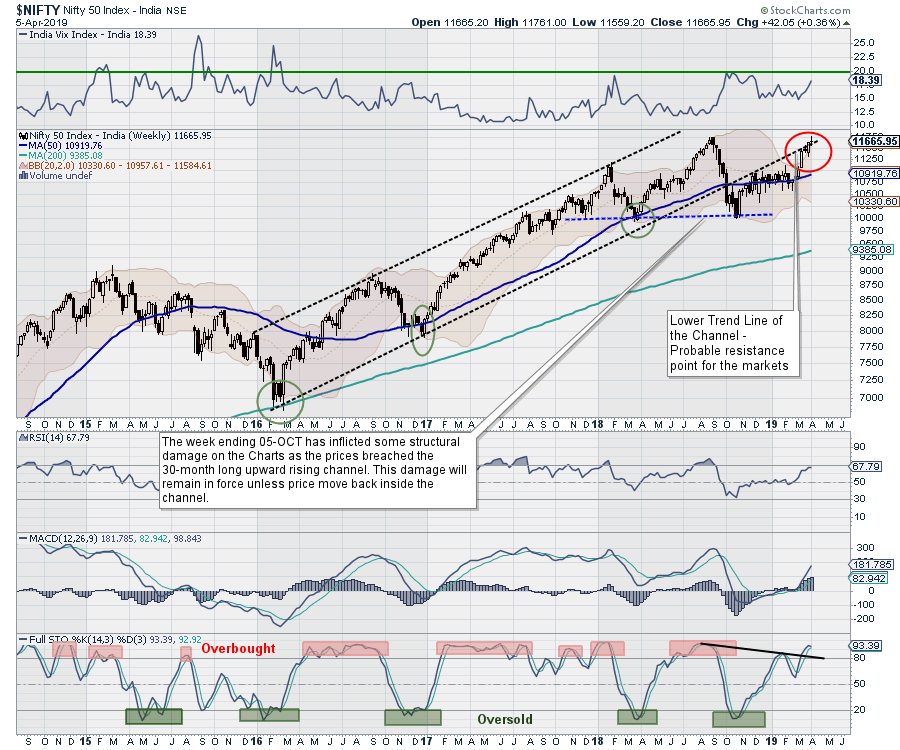
Week Ahead: Markets Placed On Tricky Turf; Would Be Sensible To Stick To Defensive Stocks
by Milan Vaishnav,
Founder and Technical Analyst, EquityResearch.asia and ChartWizard.ae
The Indian equity markets had a volatile week, ultimately ending on a flat note. In our previous weekly outlook, we had mentioned the possibility of the market stalling its up-move and showing some corrective intent. After volatile trading throughout the week, it was the last hour of trade on Friday...
READ MORE
MEMBERS ONLY
Earnings Season Can Produce Real Sizzle

by John Hopkins,
President and Co-founder, EarningsBeats.com
As earnings season gets ready to kick off this week once JPM, PNC and WFC report their results on Friday, here's a reminder that those stocks that come up big on the top and bottom line could ultimately become high reward-to-risk trading candidates, possibly multiple times. There are...
READ MORE
MEMBERS ONLY

RSI Shifts from Bearish to Bullish for EEM
by Arthur Hill,
Chief Technical Strategist, TrendInvestorPro.com
The Emerging Markets ETF (EEM) experienced a trend-momentum shift over the last few months as RSI moved from its bear range to its bull range. In addition, RSI came close to 70 (69.5) twice and EEM broke above its 200-day SMA. The downtrend reversed and I expect higher prices...
READ MORE
MEMBERS ONLY
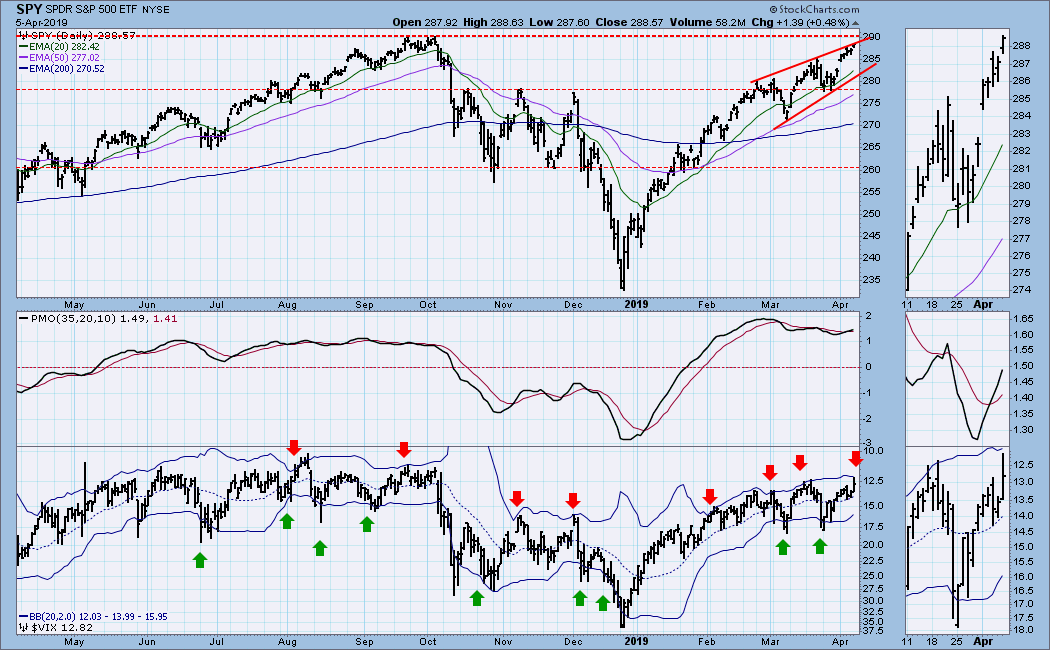
DP WEEKLY WRAP: Overhead Resistance Near; VIX Overbought

by Carl Swenlin,
President and Founder, DecisionPoint.com
An inverted VIX with Bollinger Bands is a pretty good overbought/oversold indicator, and it is overbought when the VIX hits the upper band as it almost did today. "Almost" might be good enough this time, or we may have to wait a few days for the real...
READ MORE
MEMBERS ONLY
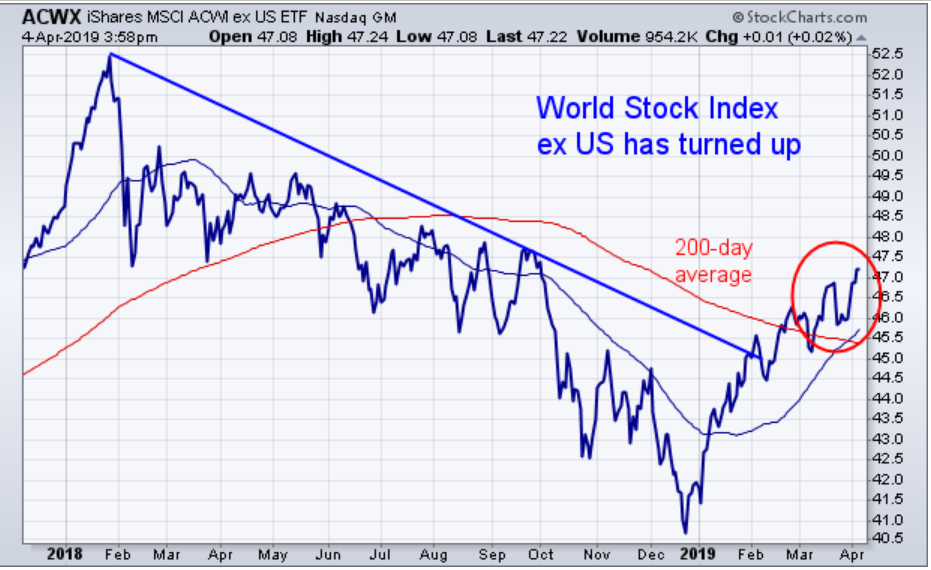
Foreign Stocks are Now Rising
by John Murphy,
Chief Technical Analyst, StockCharts.com
Editor's Note: This article was originally published in John Murphy's Market Message on Thursday, April 4th at 4:16pm ET.
Much of the concerns over the past year have centered around weakness in foreign stocks, and whether that would eventually pull U.S. stocks lower. The...
READ MORE
MEMBERS ONLY

Video Recap: My Favorite Investment Tools, Tricks and Tips on StockCharts

by Gatis Roze,
Author, "Tensile Trading"
As I announced last week, I had the pleasure of joining Tom and Erin on Wednesday morning for a special StockCharts TV guest appearance. It was a treat to be on the program, but most importantly, it was a unique joy to help celebrate StockCharts' 20th anniversary.
As a...
READ MORE
MEMBERS ONLY
Nonfarm Payrolls Hit A Sweet Spot This Morning
by Tom Bowley,
Chief Market Strategist, EarningsBeats.com
Market Recap for Thursday, April 4, 2019
Our major indices rallied again on Thursday with the benchmark S&P 500 rising for a 6th consecutive session and closing at a 2019 high. The S&P 500's close of 2879 was just 61 points shy of the...
READ MORE
MEMBERS ONLY

FOREIGN STOCKS ARE NOW RISING -- CHINESE STOCKS HAVE RISEN TWICE AS FAST AS THE U.S. THIS YEAR -- THAT'S BOOSTING STOCKS IN ASIA AND AUSTRALIA -- ALONG WITH COPPER PRICES AND SEMICONDUCTORS -- EUROZONE STOCKS ARE ALSO LOOKING STRONGER
by John Murphy,
Chief Technical Analyst, StockCharts.com
FOREIGN STOCKS ARE RISING ... Much of the concerns over the past year have centered around weakness in foreign stocks, and whether that would eventually pull U.S. stocks lower. The general feeling seemed to be that sooner or later the discrepancy between strong U.S. stocks and weak foreign stocks...
READ MORE
MEMBERS ONLY
Financials Are Not Looking Very Strong But In That Sector Regional Banks Should Really Be Watched
by Julius de Kempenaer,
Senior Technical Analyst, StockCharts.com
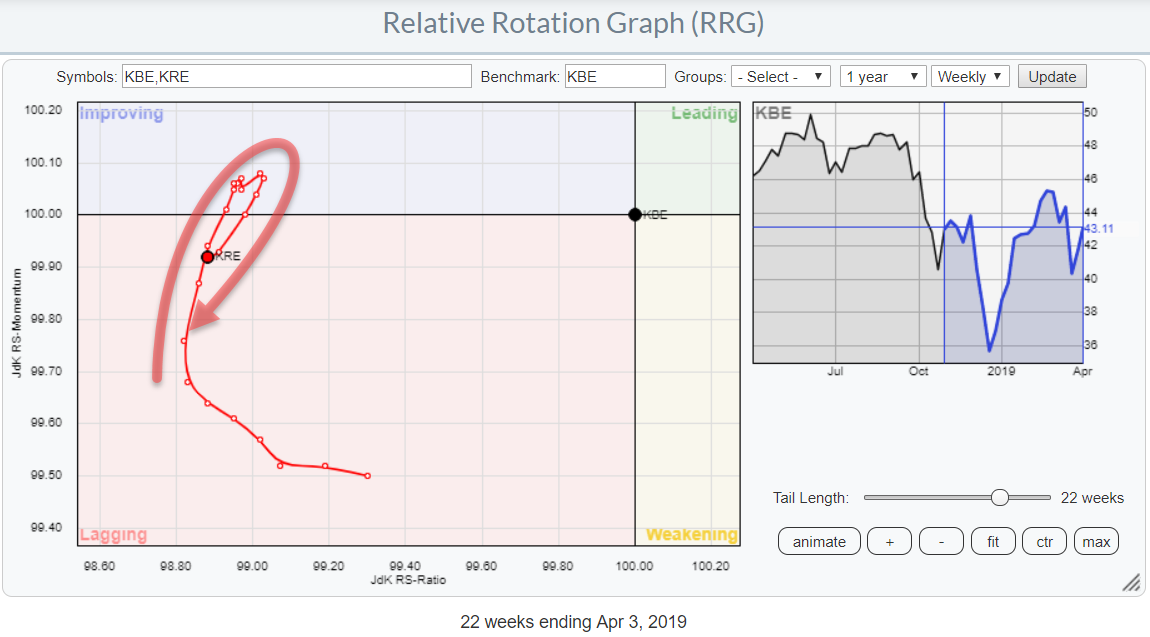
On the Relative Rotation Graph for US sectors, the Financials sector (XLF) is not in the best shape at the moment. It is positioned inside the lagging quadrant and heading lower on both axes. So, not much good there.
At the moment I am in New York City to attend...
READ MORE
MEMBERS ONLY
REITs Have Been Strong And This Group Loves April
by Tom Bowley,
Chief Market Strategist, EarningsBeats.com
Market Recap for Wednesday, April 3
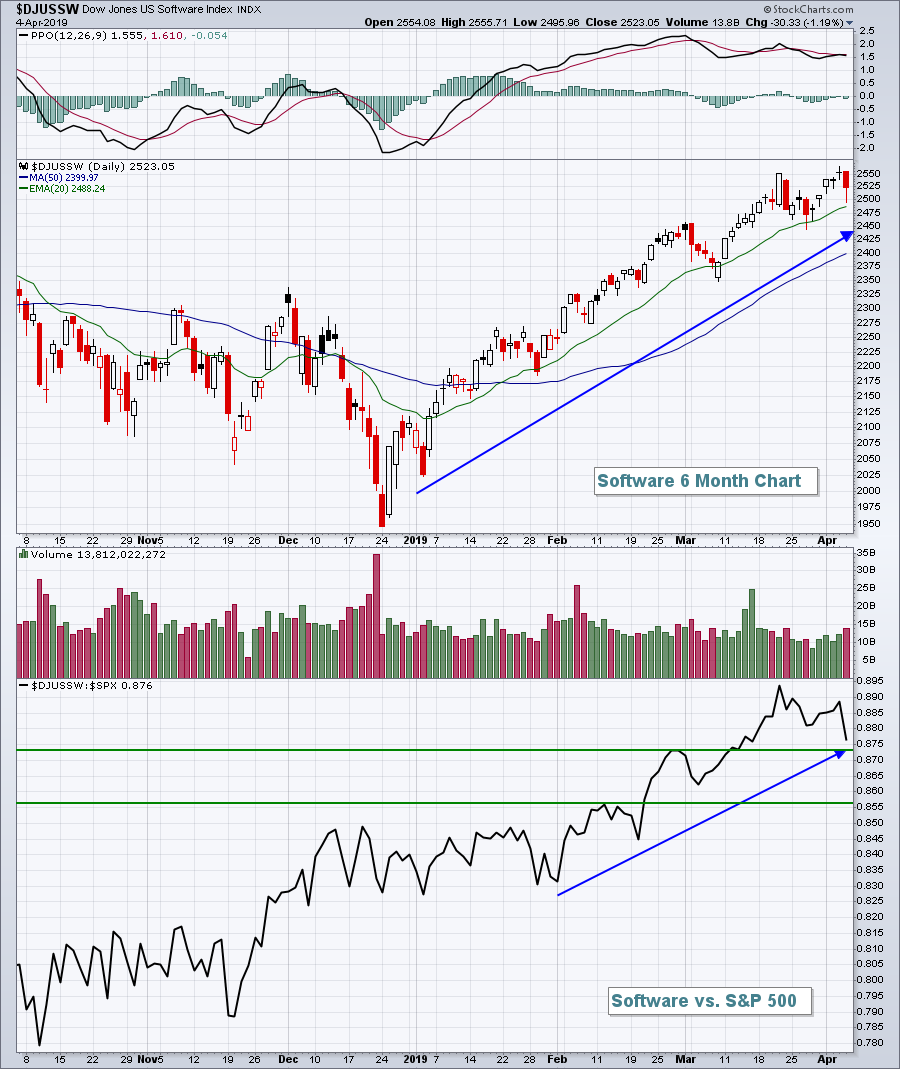
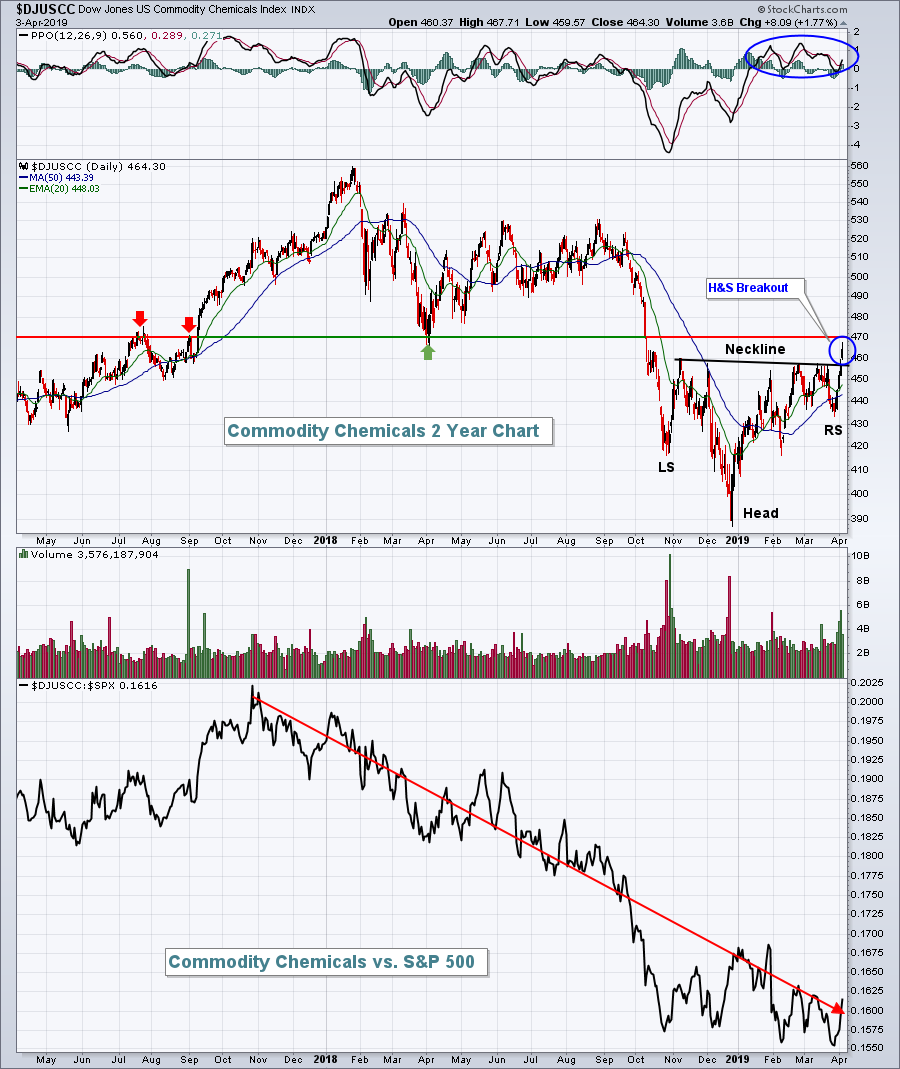
Stocks rallied again on Wednesday, primarily on the heels of materials (XLB, +1.31%) and technology (XLK, +0.81%). The former saw relative strength in both commodity chemicals ($DJUSCC, +1.77%) and specialty chemicals ($DJUSCX, +1.39%). The strength in the DJUSCC was very...
READ MORE
MEMBERS ONLY
DP Alert: ST PMO BUY Signals on All Four Scoreboard Indexes
by Erin Swenlin,
Vice President, DecisionPoint.com
Yesterday, the NDX started the PMO BUY signal party by adding the first Short-Term PMO BUY signal. Today, the other three indexes clicked ST PMO BUY signals as well. Below the Scoreboard are the charts of each signal. The Dow is struggling with overhead resistance. The NDX had a convincing...
READ MORE
MEMBERS ONLY

Yields Flatten
by Bruce Fraser,
Industry-leading "Wyckoffian"
The Yield Curve recently flipped negative (10 year compared to 3 month treasury yields). A negative Yield Curve is typically a ‘Tight Money’ indication which often leads to economic recession and weaker stock prices. The December 10, 2018 Wyckoff Power Charting blog was devoted to this subject. The conclusion was...
READ MORE
MEMBERS ONLY

MAJOR STOCK INDEXES NEAR TEST OF 2018 HIGHS -- TRANSPORTS CLEAR THEIR 200-DAY AVERAGE -- DELTA AIR LINES TURNS UP -- THE TRANSPORTS ARE STARTING TO GAIN GROUND ON THE DOW INDUSTRIALS AND UTILITIES -- S&P 400 MID CAP INDEX CLEARS ITS 200-DAY LINE
by John Murphy,
Chief Technical Analyst, StockCharts.com
U.S. STOCK INDEXES HEADING TOWARD TEST OF LAST YEAR'S HIGH... Major stock indexes in the U.S. appear on track to test their all-time highs reached during the second half of 2018. Chart 1 shows the Nasdaq Composite Index trading today at the highest level since early...
READ MORE
MEMBERS ONLY
Internet Stocks Looking Good In A Variety Of Relative Strength Ways
by Tom Bowley,
Chief Market Strategist, EarningsBeats.com
Market Recap for April 2, 2019
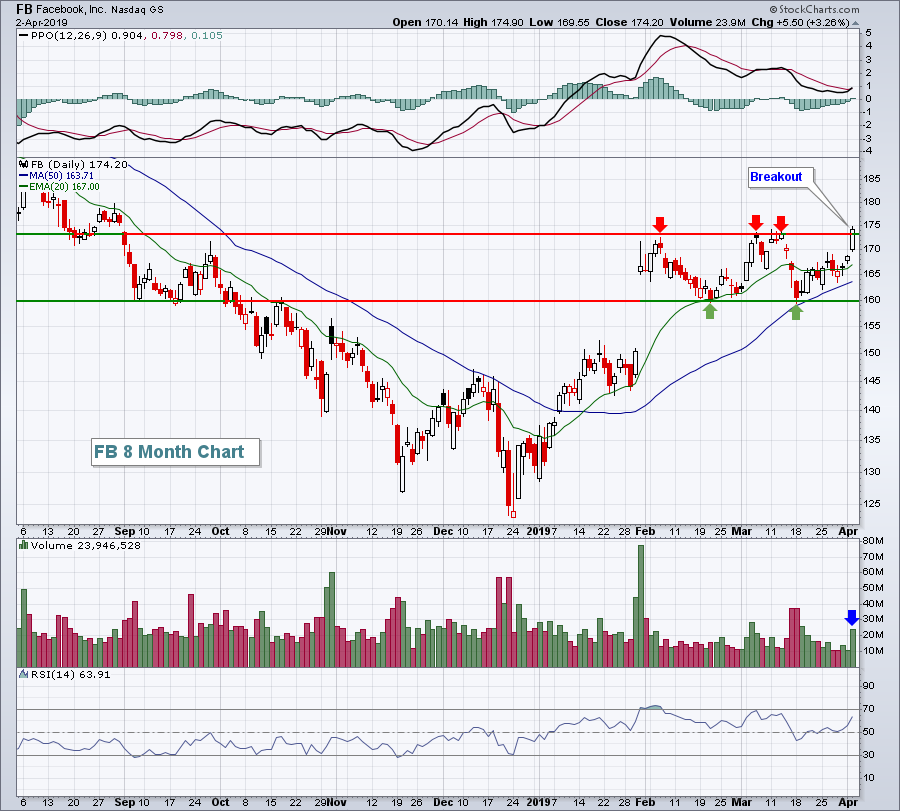
The NASDAQ was mostly higher and strengthening throughout the session on Tuesday as internet stocks ($DJUSNS, +1.41%) continued their recent advance to challenge 2019 highs. Facebook (FB, +3.26%) led internet stocks higher and broke out to close at its 2019 high on...
READ MORE
MEMBERS ONLY
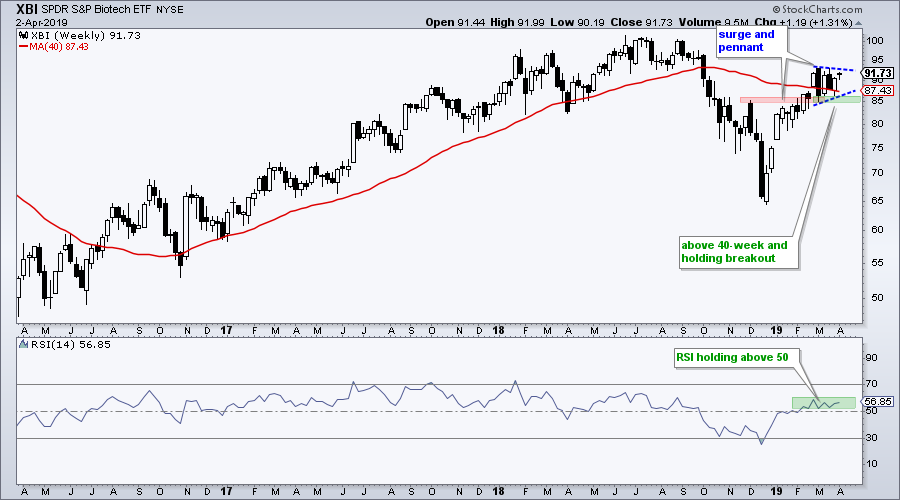
Is there a Biotech Breakout in the Making?
by Arthur Hill,
Chief Technical Strategist, TrendInvestorPro.com
The Biotech SPDR (XBI) is trading at a make-or-break point as it consolidates near the 40-week SMA. Traders should watch for the resolution of this consolidation because it will dictate the next directional move.
The chart below shows XBI surging from the mid 60s to the lower 90s and then...
READ MORE
MEMBERS ONLY

Are US Equities About to Break Out Against The Rest of The World?
by Martin Pring,
President, Pring Research
* S&P Relative Action Edging Through Resistance
* British Pound Going Wobbly Before Brexit?
* Mega Buy Signal Could be in Store for the Shanghai Composite
* Gold at a Momentum Downtrend Line as Well
S&P Relative Action Edging Through Resistance
We have all heard about the US economy being...
READ MORE
MEMBERS ONLY
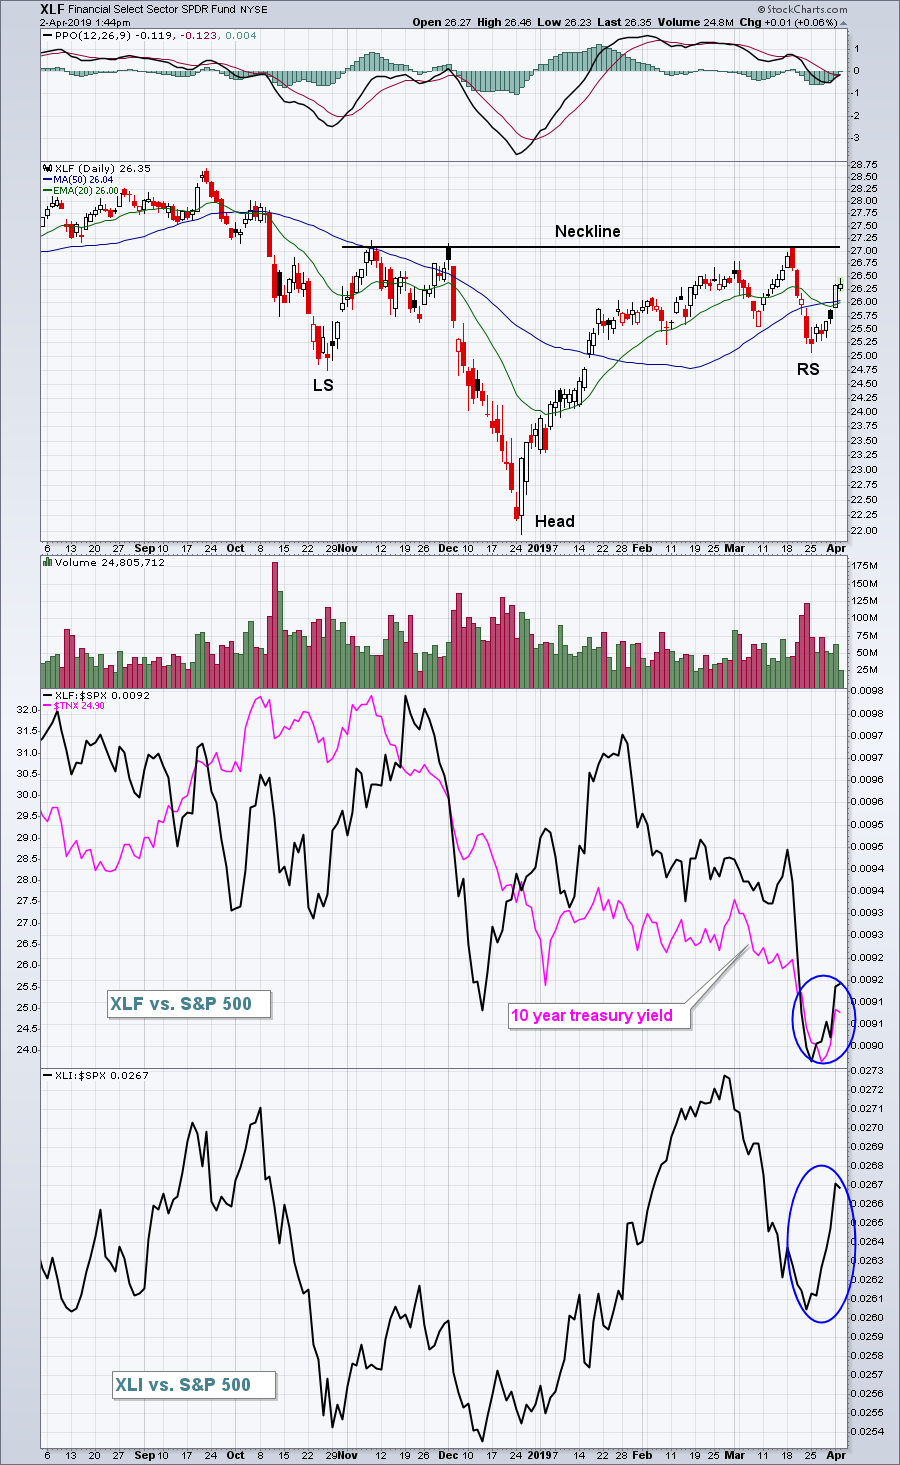
Financials Benefiting From Rising Treasury Yields
by Tom Bowley,
Chief Market Strategist, EarningsBeats.com
Market Recap for Monday, April 1, 2019
U.S. equities had a stunning first quarter and Monday was an encore to open up Q2. Keep in mind that we’ve entered the most bullish period within April historically as the NASDAQ has produced annualized returns of +21.45% from April...
READ MORE
MEMBERS ONLY

AT&T Makes a Break for It
by Arthur Hill,
Chief Technical Strategist, TrendInvestorPro.com
AT&T (T) was one of the worst performing stocks in 2018 with a 20% decline and 52-week low in late December. 2019 is starting out much better with a double-digit gain and a break above the November-February highs, which also mark neckline resistance of an inverse head-and-shoulders pattern....
READ MORE
MEMBERS ONLY
Key Relative Strength Signs Pointing To Higher Equity Prices
by Tom Bowley,
Chief Market Strategist, EarningsBeats.com
Market Recap for Friday, March 29, 2019
The U.S. stock market rallied on Friday, putting an exclamation point on its best calendar quarter in 10 years. Of course, this strength came on the heels of an incredibly dismal quarter to end 2018. Healthcare (XLV, +1.20%) and industrials (XLI,...
READ MORE
MEMBERS ONLY

Martin Pring's Monthly Market Roundup 2019-04-01
by Martin Pring,
President, Pring Research
The monthly Market Roundup video for April is now available.
Good luck and good charting,
Martin J. Pring
The views expressed in this article are those of the author and do not necessarily reflect the position or opinion of Pring Turner Capital Group of Walnut Creek or its affiliates....
READ MORE
MEMBERS ONLY
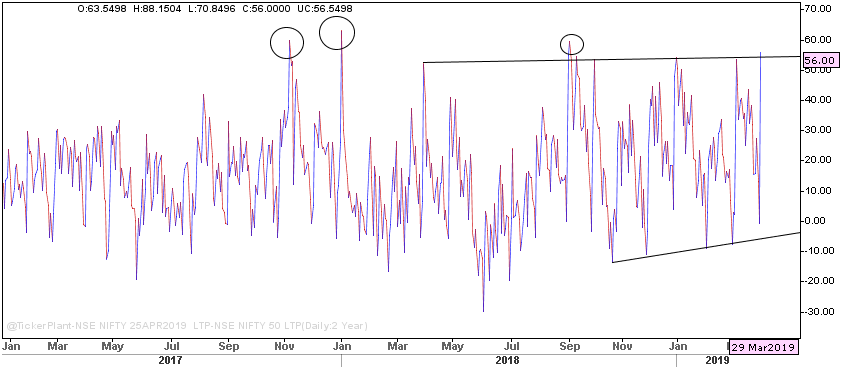
Some Insights From The NIFTY Premiums
by Milan Vaishnav,
Founder and Technical Analyst, EquityResearch.asia and ChartWizard.ae
As we know, a futures instrument derives its value from its respective underlying asset. For example, the NIFTY futures instrument derives its value from the NIFTY's spot price. Though the futures price and the price of its underlying move in the same direction, they do not maintain the...
READ MORE
MEMBERS ONLY
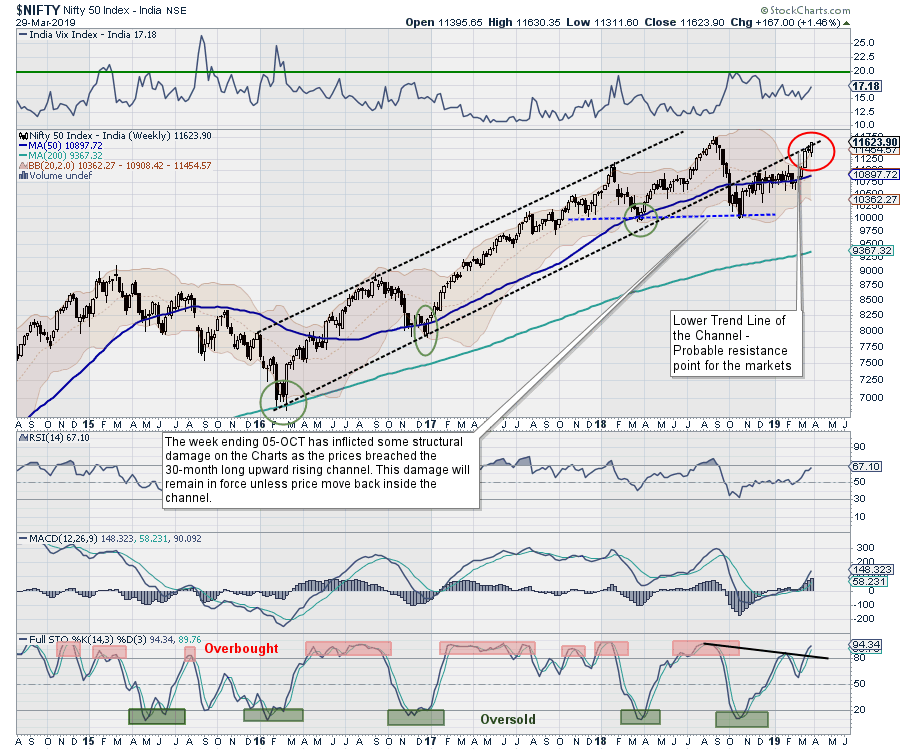
Week Ahead: Caution Advised for Momentum-Chasers; Stalling Of Up-Move Should Not Come As A Surprise
by Milan Vaishnav,
Founder and Technical Analyst, EquityResearch.asia and ChartWizard.ae
With the session that ended Friday, March 29, 2019, the markets ended a remarkable month which remained one of the best out of the past several quarters. NIFTY ended the month on a strong note, posting a monthly gain of 831.40 points (+7.70). After taking a breather in...
READ MORE
MEMBERS ONLY
DP WEEKLY/MONTHLY WRAP: Broad Market Divergences
by Carl Swenlin,
President and Founder, DecisionPoint.com
This is a new chart I will be adding to my weekly commentary. My concentration has always been on the S&P 500 Index, but I realized that I needed to broaden my scope somewhat to include other segments of the the broad market, and this is my first...
READ MORE
MEMBERS ONLY

My Favorite Investment Tools On StockCharts.com
by Gatis Roze,
Author, "Tensile Trading"
Time truly flies, and boy oh boy do I realize it when I think back on the nearly 20 years that I’ve been using StockCharts.com to make money as an investor.
I was planning to write this week’s blog as a “homage" to all those years...
READ MORE
MEMBERS ONLY
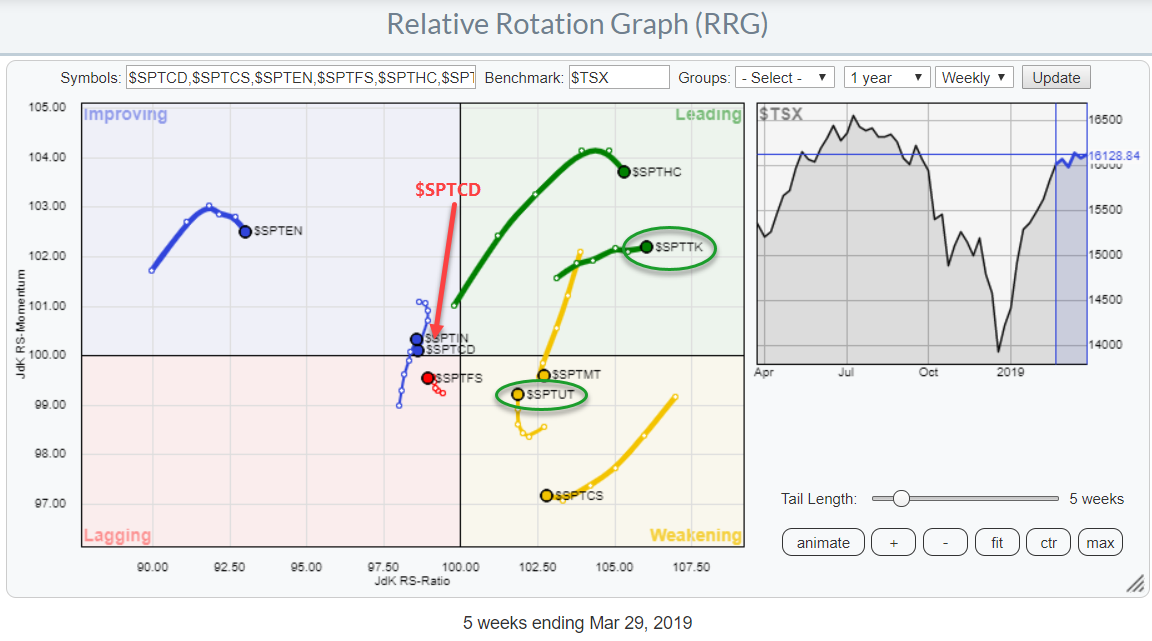
When In Canada.. Do As The Canadians, And Avoid The Consumer Discretionary Sector..
by Julius de Kempenaer,
Senior Technical Analyst, StockCharts.com
Last night I arrived in Toronto for a weekend with my son and his family, before heading towards New York to attend the CMTA symposium next week.
So for this article, it only seems appropriate to have a look at the Canadian sector landscape from an RRG perspective.
The Relative...
READ MORE