MEMBERS ONLY
Dollar Cost Averaging

by Greg Morris,
Veteran Technical Analyst, Investor, and Author
Dollar cost averaging is simply the act of making like dollar investments on a periodic basis, say every month or every quarter. It is sold as a technique because they want you to believe that no one can outperform the market. There are many papers written on this subject and...
READ MORE
MEMBERS ONLY

STOCKS ARE ENDING WEEK AND QUARTER ON A FIRM NOTE -- ALL THREE MAJOR STOCK INDEXES HAVE KEPT THEIR 2019 UPTRENDS INTACT -- THE DOW TRANSPORTS MAY MAKE ANOTHER RUN AT THEIR 200-DAY LINE

by John Murphy,
Chief Technical Analyst, StockCharts.com
MAJOR STOCK INDEXES MAINTAIN THEIR 2019 UPTRENDS ... Major U.S. stock indexes appear on track to end the week and quarter with their 2019 uptrends intact. Chart 1 shows the Dow Industrials in a sideways trading pattern over the last month. This week's pullback bounced off its (blue)...
READ MORE
MEMBERS ONLY

Weekly Market Review & Outlook - It is What it Is

by Arthur Hill,
Chief Technical Strategist, TrendInvestorPro.com
* S&P 500 Stalls within Uptrend.
* Upswing Dominates Weekly SPX Chart.
* Index Breadth Table Remains Bullish.
* IJR: Failure at 200-day or Mere Correction?
* Sector Table - Staples Get a Lift.
* XLI Hits Make-or-break Zone.
* UTX Consolidates around the 200-day.
* MMM Consolidates above 200-day.
* Palladium Takes a Tumble.
* ChartList Updates....
READ MORE
MEMBERS ONLY
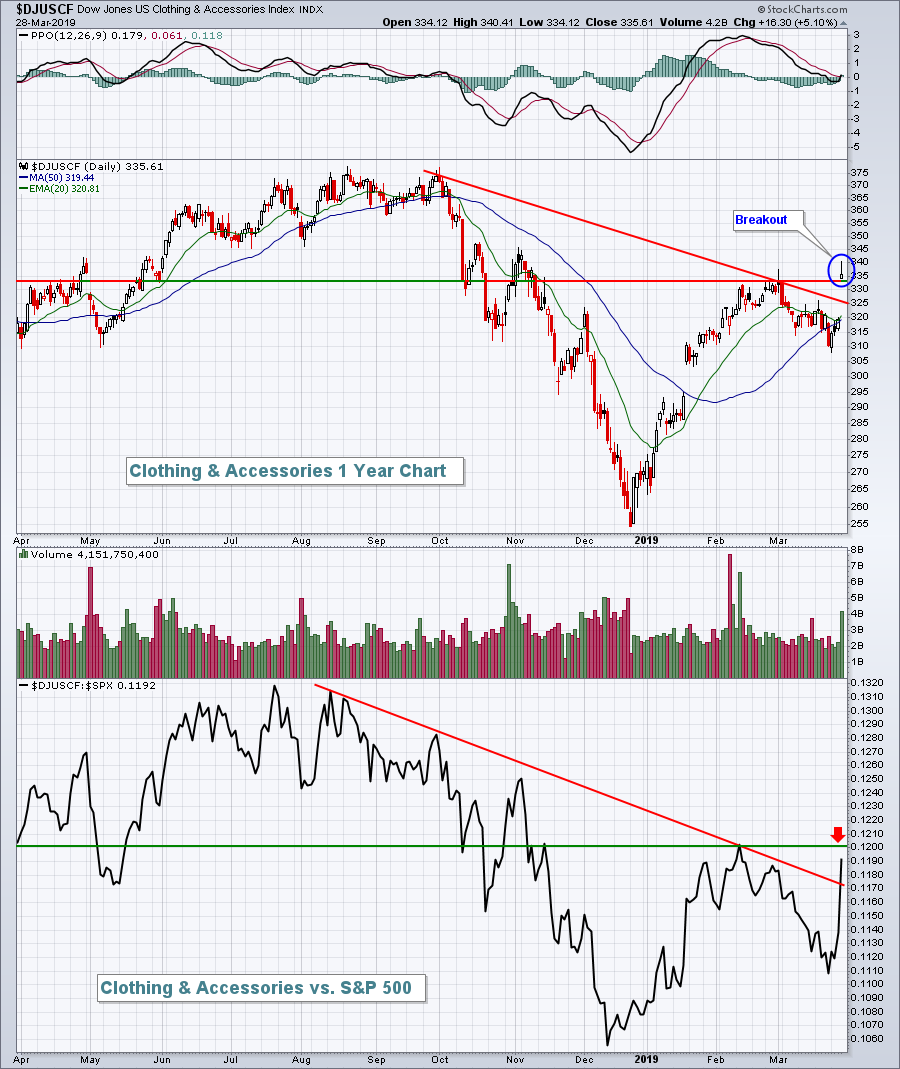
Strong Earnings Lift Clothing Stocks

by Tom Bowley,
Chief Market Strategist, EarningsBeats.com
Market Recap for Thursday, March 28, 2019
Lululemon Athletica (LULU, +14.13%), PVH Corp (PVH, +14.76%), and Movado Group (MOV, +22.77%) all surged after the clothing & accessories retailers all posted much better than expected quarterly earnings. The Dow Jones U.S. Clothing & Accessories Index ($DJUSCF, +5....
READ MORE
MEMBERS ONLY
Home Construction Is Loving This Treasury Yield Decline
by Tom Bowley,
Chief Market Strategist, EarningsBeats.com
Market Recap for Wednesday, March 27, 2019
Wall Street rebounded from steep intraday losses, but still ended the session in negative territory. The NASDAQ was the weakest index, falling 0.63%. The S&P 500, Russell 2000 and Dow Jones dropped 0.46%, 0.39%, and 0.13%, respectively....
READ MORE
MEMBERS ONLY
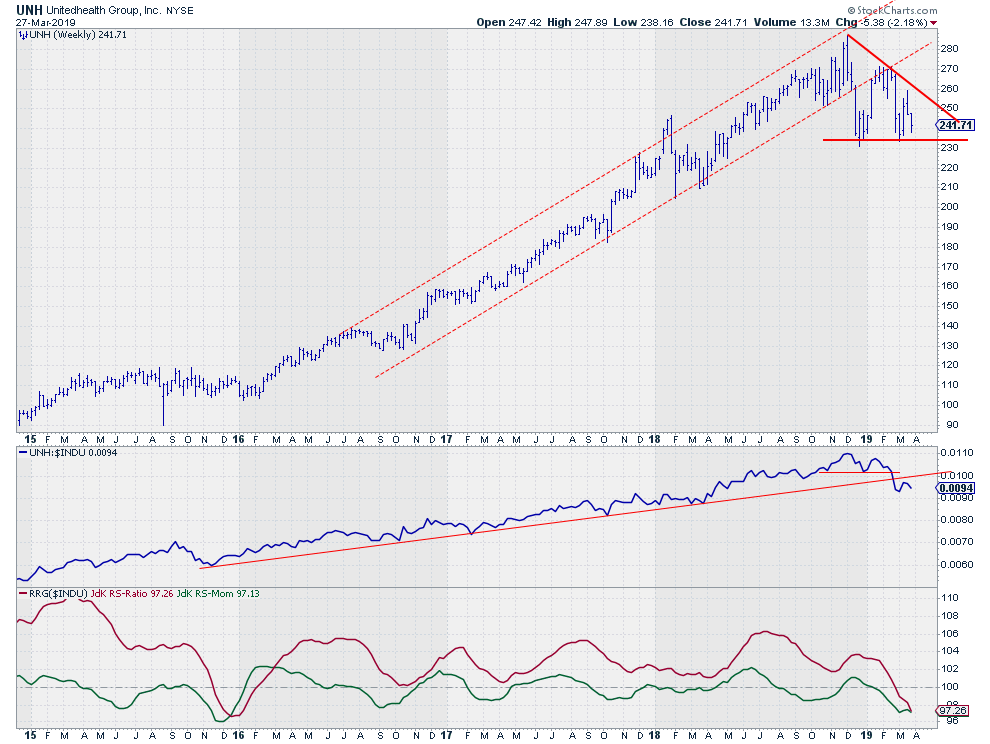
Triple whammy for UNH suggests more weakness ahead!

by Julius de Kempenaer,
Senior Technical Analyst, StockCharts.com
The weekly chart for UnitedHealth (UNH) shows a steady uptrend in both price and relative (vs $INDU) since the start of 2016.
That three-year move just came to an end.
The uptrend in relative strength emerged out of the low that was set in late 2015. Since then, UNH is...
READ MORE
MEMBERS ONLY

DP Alert: Short-Term Shake Up on Scoreboards - Bearish Wedge Nearly Executes

by Erin Swenlin,
Vice President, DecisionPoint.com
The OEX and Dow lost short-term BUY signals on Monday and the NDX followed today, having switched out of a ST PMO BUY signal. I thought it was time to do a review of the Scoreboard indexes, so their charts are below. Additionally, you'll find my regular mid-week...
READ MORE
MEMBERS ONLY

DROP IN BOND YIELDS HERE AND IN GERMANY WEIGH ON STOCKS -- MAJOR STOCK INDEXES MAY RETEST THEIR 200-DAY AVERAGES -- THE BOND/STOCK RATIO IS RISING AGAIN WHICH SUGGESTS THAT INVESTORS ARE HEDGING THEIR BETS ON A STRONGER ECONOMY
by John Murphy,
Chief Technical Analyst, StockCharts.com
TREASURY YIELDS FOLLOW BUNDS LOWER ... German 10-year bunds were sold below zero at today's auction which is keeping downside pressure on Treasury yields. The daily bars in Chart 1 show the 10-Year Treasury yield falling today to the lowest level since the end of 2017. That's...
READ MORE
MEMBERS ONLY
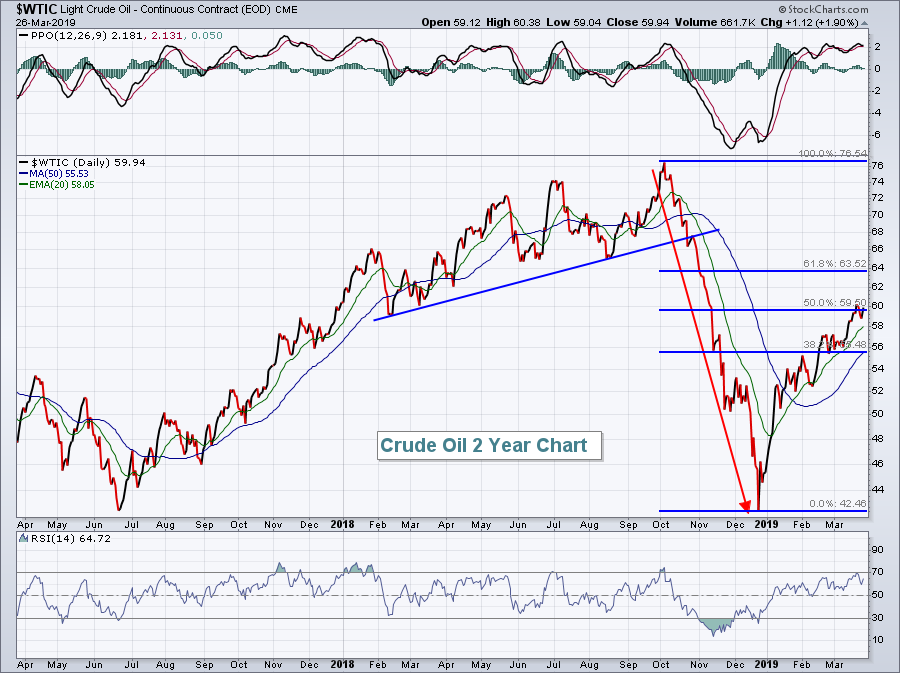
Crude Oil, Energy Lead Wall Street Higher
by Tom Bowley,
Chief Market Strategist, EarningsBeats.com
Market Recap for Tuesday, March 26, 2019
Strength in global markets seemed to influence the U.S. market at the open as equities surged higher. But sellers dominated most of the balance of the day as gains evaporated. A final 30 minute surge just before the close restored some of...
READ MORE
MEMBERS ONLY
Bull, Bear or Neither? - Plus ChartList Update
by Arthur Hill,
Chief Technical Strategist, TrendInvestorPro.com
* S&P 500 Holds as Russell Rolls Over.
* Plenty of New Highs in $SPX.
* ChartList Updates - 3 Additions.
Are we in a bull market, a bear market or neither? At this point, the evidence is still more bullish than bearish, but there are clearly some pockets of weakness...
READ MORE
MEMBERS ONLY
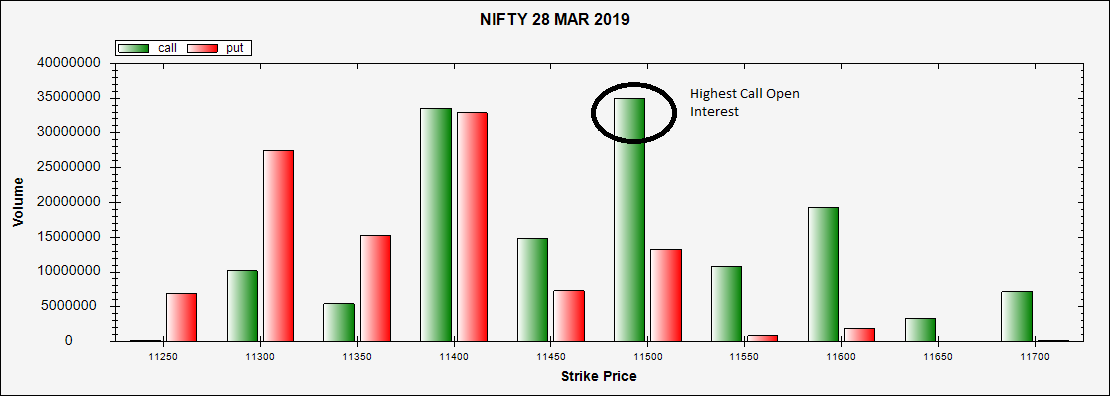
Derivative Expiry: Options Data Point Towards This Level Being An Inflection Point For The Markets

by Milan Vaishnav,
Founder and Technical Analyst, EquityResearch.asia and ChartWizard.ae
The NIFTY50 ($NIFTY) saw an unexpected surge in trading on Tuesday, ultimately ending the session with decent gains. The expiry of the current derivative series is to come up on Thursday, March 28; the Options data on NIFTY throws up some useful insights.
Let's examine the 10 ATM...
READ MORE
MEMBERS ONLY
Seasonality And Price Support Suggest TSLA Is A Buy
by Tom Bowley,
Chief Market Strategist, EarningsBeats.com
Market Recap for Monday, March 25, 2019
U.S. stocks finished in bifurcated fashion on Monday as the S&P 500 and NASDAQ lost 0.08% and 0.07%, respectively, while the Dow Jones tacked on 0.06%. The small cap Russell 2000 was a relative outperformer, gaining 0....
READ MORE
MEMBERS ONLY

TJX Bucks the Selling Pressure
by Arthur Hill,
Chief Technical Strategist, TrendInvestorPro.com
TJX Companies (TJX) is part of the S&P 500 and the Consumer Discretionary SPDR (XLY). It is also part of two growth ETFs (PWB and PXLG). Even though TJX is part of an economically sensitive sector, I would put them in a different category because they are known...
READ MORE
MEMBERS ONLY
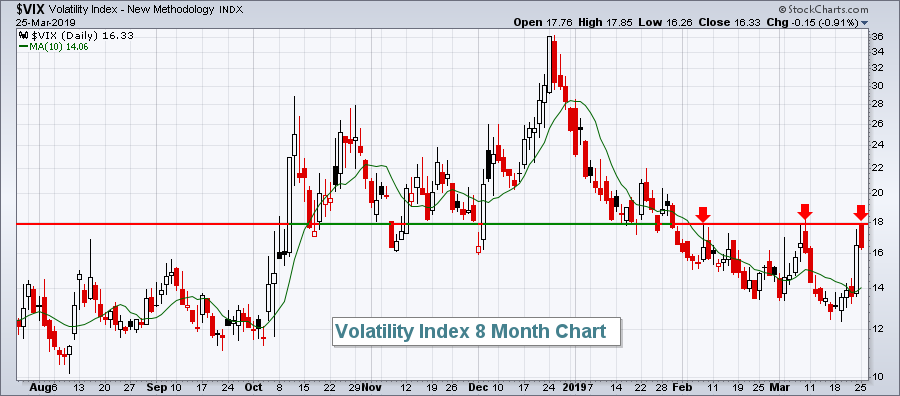
The VIX And S&P 500 Positive Correlation Predicted Friday's Drop
by Tom Bowley,
Chief Market Strategist, EarningsBeats.com
Market Recap for Friday, March 22, 2019
Investors were worried on Friday and it was reflected in the Volatility Index ($VIX), which rose more than 20%, and sharply lower U.S. equity prices. The small cap Russell 2000 was hit hardest, dropping 3.62%. The weakness, however, was felt just...
READ MORE
MEMBERS ONLY
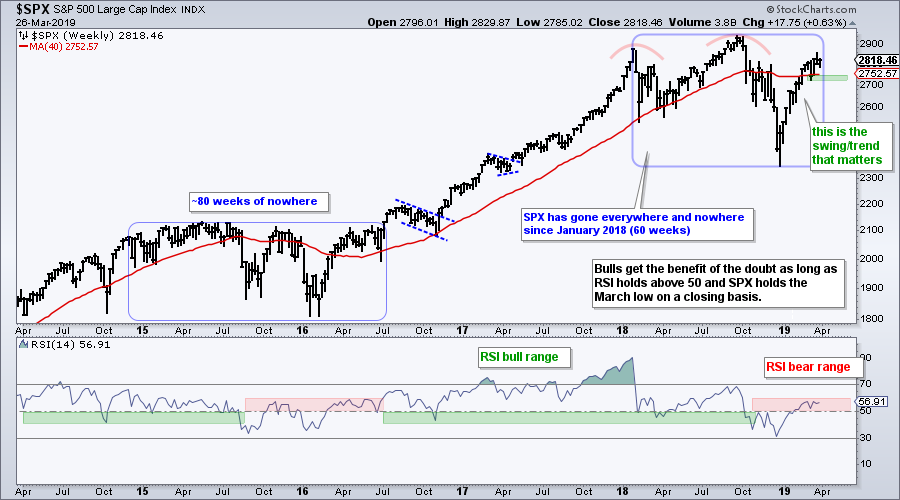
RSI Bear Ranges for S&P 500 and Russell 2000 - ChartList Update
by Arthur Hill,
Chief Technical Strategist, TrendInvestorPro.com
* RSI Holds Bear Range for S&P 500
* A Classical Reversal Area for Russell 2000
* Small-cap Breadth Indicators Flip
* Selling Pressure in Key Groups
* ChartList Updates
RSI Holds Bear Range for S&P 500
The S&P 500 remains above its slightly rising 40-week SMA, but this...
READ MORE
MEMBERS ONLY

US Stocks Looking Vulnerable Again

by Martin Pring,
President, Pring Research
* Long-Term Picture Remains Finely Balanced
* Short-Term Indicators Still Showing Weakness
* Confidence is Starting to Erode Again
* Financials Break Down from a Broadening Wedge
Earlier in the month, I wrote about the Ides of March and the fact that the market looked overstretched, apparently in need of some mean reversal corrective...
READ MORE
MEMBERS ONLY
Europe vs The USA... And The Winner Is ....
by Julius de Kempenaer,
Senior Technical Analyst, StockCharts.com
I like to keep an eye on what's going on in the world around us. That means also monitoring what's happening in markets that are maybe not directly of interest when it comes to trading or investing.
For stock markets around the world I like to...
READ MORE
MEMBERS ONLY

PLUNGE IN GLOBAL BOND YIELDS AND INVERTED YIELD CURVE PUSHES BOND PRICES HIGHER AND STOCKS LOWER -- FALLING BOND YIELDS REWARD UTILITIES WHILE HURTING BANKS -- WEAKNESS IN SMALL CAPS AND TRANSPORTS MAY BE WARNING OF MORE PROFIT-TAKING TO COME
by John Murphy,
Chief Technical Analyst, StockCharts.com
PLUNGE IN BOND YIELDS CAUSES YIELD CURVE TO INVERT ... Weak economic numbers from the eurozone and the U.S. on Friday pushed bond yields here and in Europe sharply lower and caused heavy profit-taking in global stocks. The 10-Year German bond yield fell into negative territory (below zero) for the...
READ MORE
MEMBERS ONLY
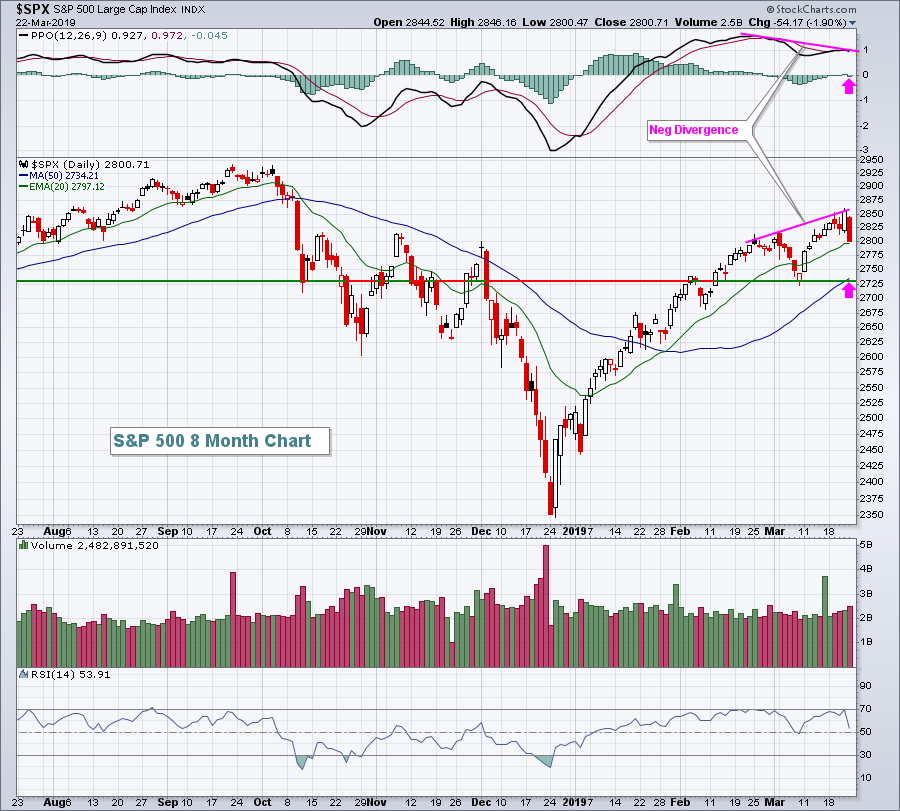
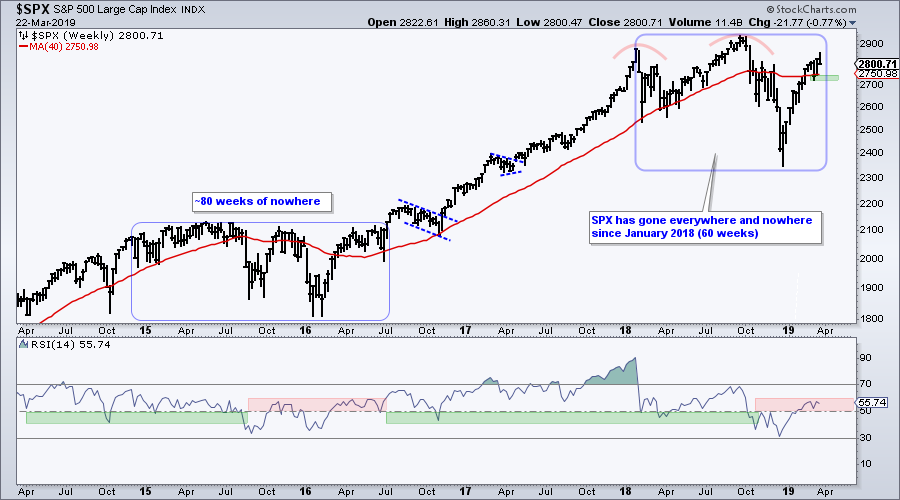
DP WEEKLY WRAP: Fakeout Breakout; Bond Blastoff

by Carl Swenlin,
President and Founder, DecisionPoint.com
Last week certain indicators had me looking for a short-term market top, and on Wednesday it looked as if it had arrived. But no. On Thursday the market moved to new rally highs on volume that wasn't too little or too much, so I thought that looked like...
READ MORE
MEMBERS ONLY
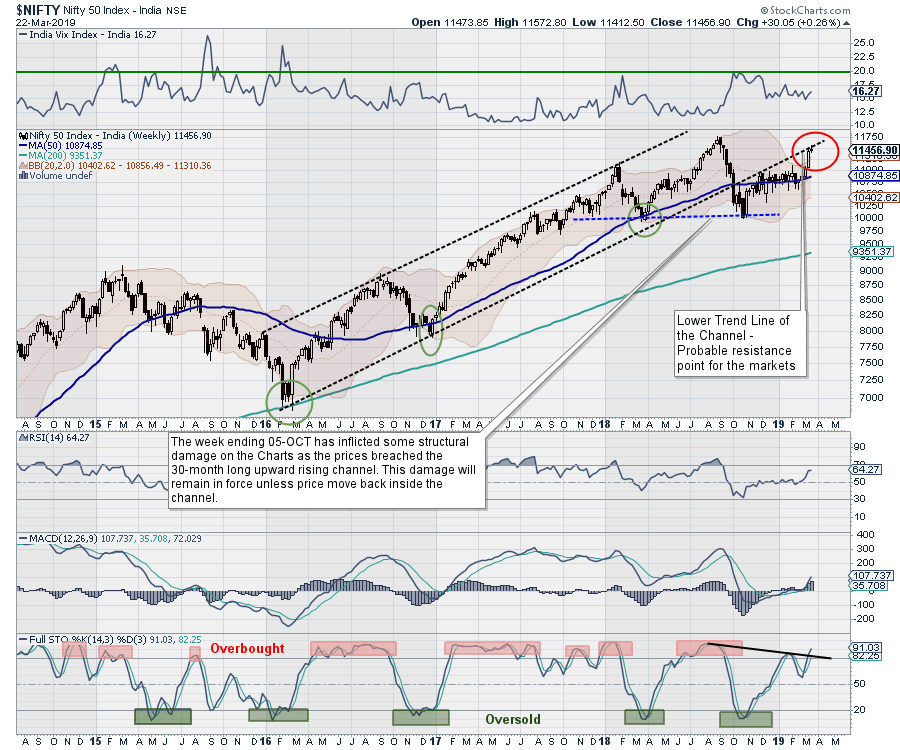
Week Ahead: Upsides May Remain Limited; Corrective Moves Likely From Higher Levels
by Milan Vaishnav,
Founder and Technical Analyst, EquityResearch.asia and ChartWizard.ae
Following an unabated up move over the last several days, the markets finally took a breather on the last trading day of the week. After the session on Friday, the NIFTY has displayed visible signs of consolidation creeping in to the markets, which had become steeply overbought on the daily...
READ MORE
MEMBERS ONLY

Weekly Market Review & Outlook - Crosscurrents, Undercurrents and Weight of the Evidence
by Arthur Hill,
Chief Technical Strategist, TrendInvestorPro.com
* Bigger Downtrends or Simply Resting?
* Bank ETFs Fail at 200-day SMAs.
* Small-cap Indexes Fail near Retracements.
* Oil Nears Potential Reversal Zone.
* Focus on the True Leaders.
* S&P 500 Maintains Uptrend.
* Index Breadth Table Remains Bullish.
* Sector Breadth Table is More Mixed.
* Staples, Utilities, REITs and Tech.
* Bonds Extend...
READ MORE
MEMBERS ONLY
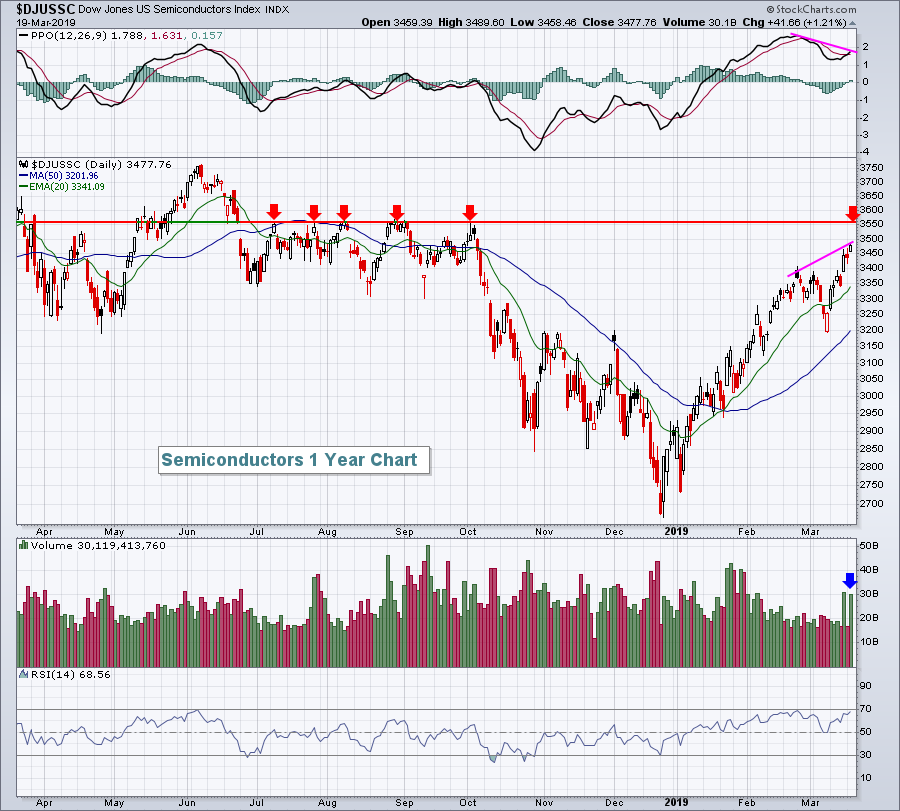
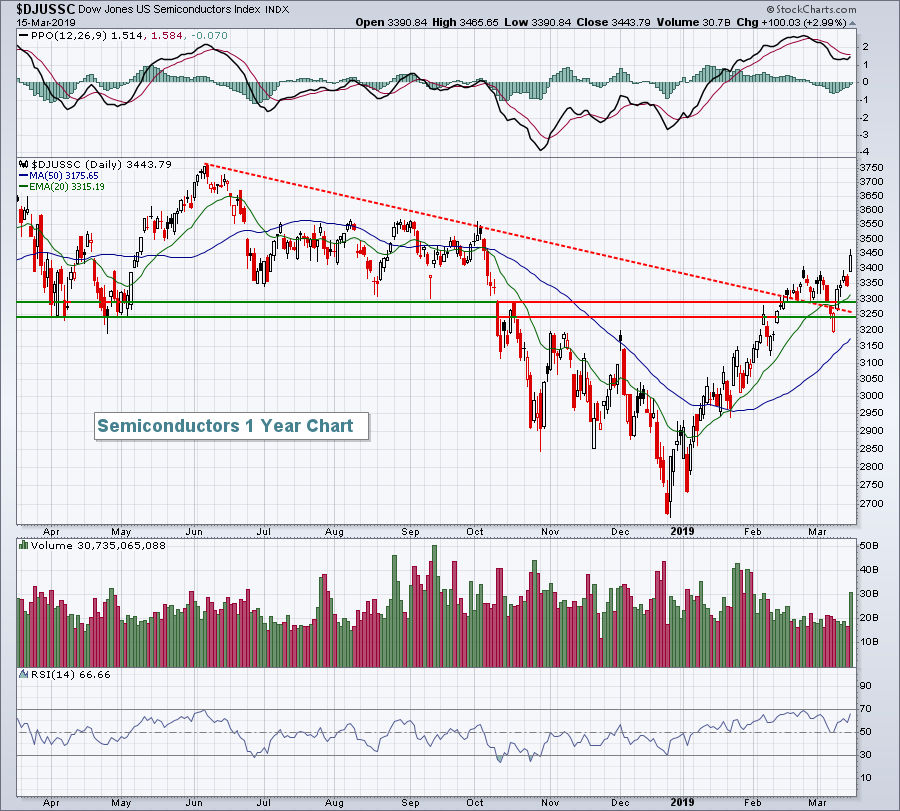
Apple Leads Big Technology Rally
by Tom Bowley,
Chief Market Strategist, EarningsBeats.com
Market Recap for Thursday, March 21, 2019
Technology stocks (XLK, +2.51%) carried Wall Street higher on Thursday as computer hardware ($DJUSCR, +3.56%), semiconductors ($DJUSSC, +3.13%), and software ($DJUSSW, +2.20%) all surged to fresh 2019 highs. Apple, Inc. (AAPL, +3.68%), which has regained its title of...
READ MORE
MEMBERS ONLY
The Bond Market Is Sending Us The Most Bearish Signal
by Tom Bowley,
Chief Market Strategist, EarningsBeats.com
Market Recap for Wednesday, March 20, 2019
Yesterday was all about the Fed and what it might say. It was essentially a foregone conclusion that there'd be no rate hike, so traders were on edge anticipating what might change in the Fed's policy statement. Stock traders...
READ MORE
MEMBERS ONLY
March Turns Rough for Small and Mid Caps
by Arthur Hill,
Chief Technical Strategist, TrendInvestorPro.com
The Russell 2000 iShares (IWM) is not only lagging the S&P 500 SPDR (SPY) and the Nasdaq 100 ETF (QQQ) in March, but it is also under selling pressure and down month-to-date. Typically, I am not concerned with relative weakness in small-caps when they are simple up less...
READ MORE
MEMBERS ONLY
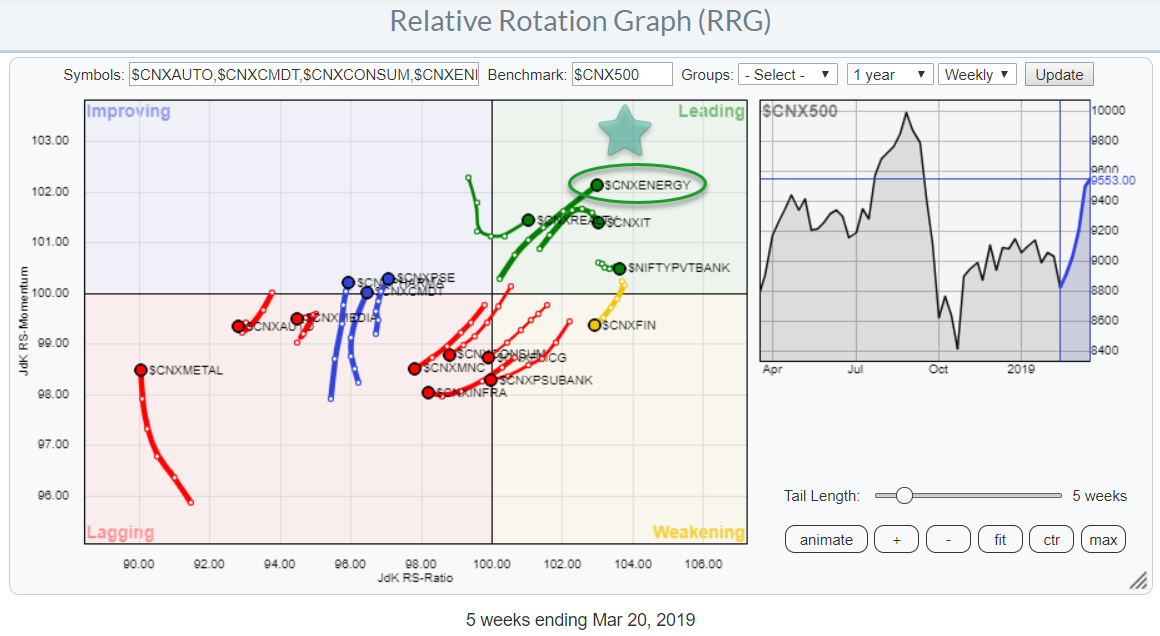
Energy Stands Out on Relative Rotation Graph For Indian Sectors
by Julius de Kempenaer,
Senior Technical Analyst, StockCharts.com
The list of pre-defined groups in the RRG-menu has been expanded with the universe covering Indian sectors against the Nifty 500 index as the benchmark. Very recently also the universe of individual stocks making up the Sensex 30 index was added. With the Nifty 50 group already on the list,...
READ MORE
MEMBERS ONLY
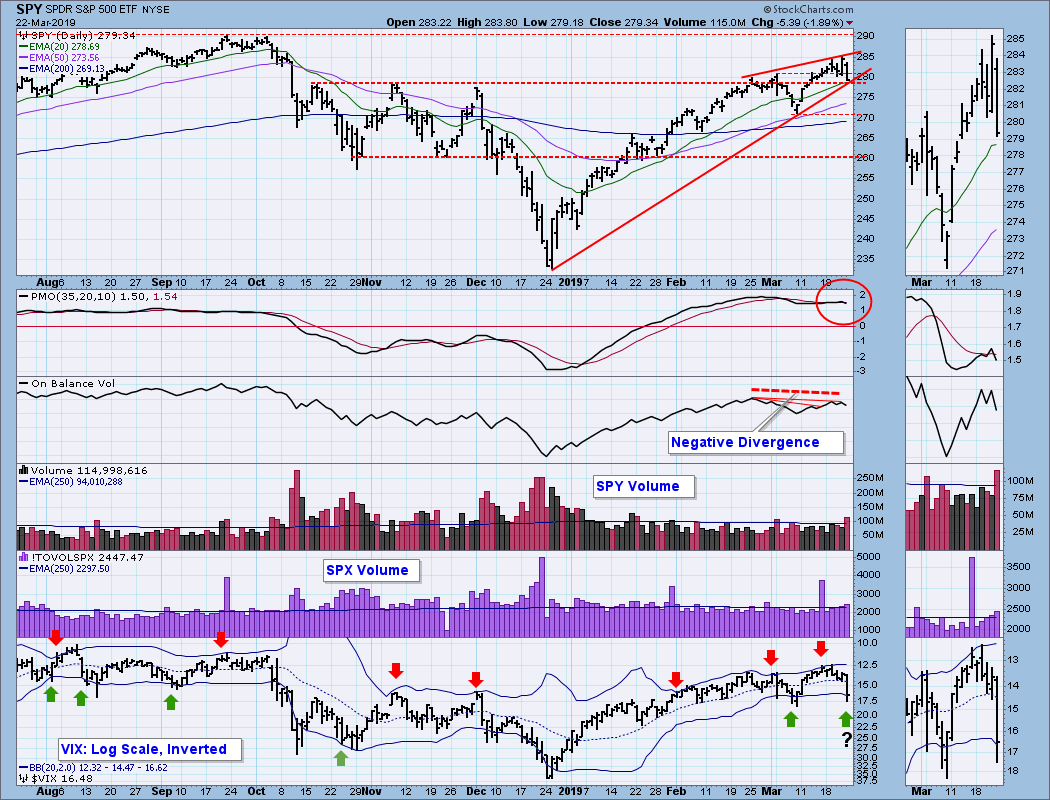
DP Alert: SPX Momentum Failure - Negative Divergence on ST Indicators - Broken Dollar
by Erin Swenlin,
Vice President, DecisionPoint.com
The Price Momentum Oscillator (PMO) has topped underneath the signal line, something I consider especially bearish in the short term. Our short-term indicators have presented another "attention flag" divergence, which could be pointing to a more lasting decline. Today, the Dollar broke down dramatically on the heels of...
READ MORE
MEMBERS ONLY

Trucks. Trains. Airplanes.

by Bruce Fraser,
Industry-leading "Wyckoffian"
The Dow Jones Transportation Average, since its creation, has been considered a sensitive leading indicator of business conditions. The legendary ‘Dow Theory’ was created as a trend confirmation indicator of the Industrial Average to the Transportation Average. When they are both in-gear, upward or downward, the major trend is confirmed....
READ MORE
MEMBERS ONLY
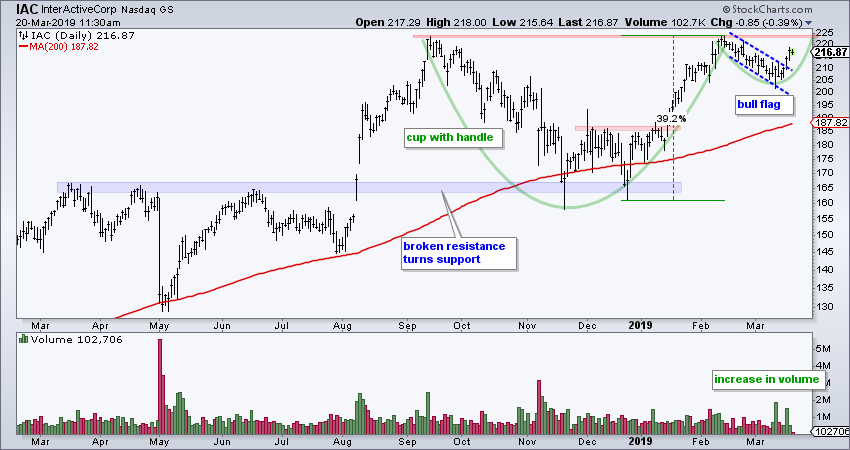
Trading the Pattern within the Pattern
by Arthur Hill,
Chief Technical Strategist, TrendInvestorPro.com
There are often smaller patterns within larger patterns and traders can get a jump on a bigger breakout by acting on the smaller pattern first. For example, a cup-with-handle is a bullish continuation pattern that typically forms over a few months. A falling flag is also a bullish continuation pattern,...
READ MORE
MEMBERS ONLY
U.S. Dollar Index Drops For 8th Straight Day, Awaiting Fed
by Tom Bowley,
Chief Market Strategist, EarningsBeats.com
Market Recap for Tuesday, March 19, 2019
The U.S. stock market finished the day in bifurcated fashion as the NASDAQ (+0.12%) clung to a relatively minor gain, while the aggressive small cap Russell 2000 index lost 0.57%. The Dow Jones and S&P 500 barely finished...
READ MORE
MEMBERS ONLY

Third Time Lucky for Advance Auto Parts?
by Arthur Hill,
Chief Technical Strategist, TrendInvestorPro.com
Advance Auto Parts (AAP) hit a new high in November and then moved into a corrective phase. Keep in mind that a correction can involve a decline or a consolidation, or even a combination of the two. AAP fell back towards the rising 200-day SMA in December and then stalled...
READ MORE
MEMBERS ONLY

The Enemy in the Mirror
by Greg Morris,
Veteran Technical Analyst, Investor, and Author
I am a retired money manager and want to share some thoughts on that profession and investors in general. Portfolio management is as much about managing emotions as it is about correlations, standard deviations and Sharpe ratios. Over the decades much has been written about the “math” of portfolio management...
READ MORE
MEMBERS ONLY

Deflation Sensitive Stocks Are At A New All-Time High
by Martin Pring,
President, Pring Research
* Deflation Index Leading the Market Higher
* Inflation/Deflation Ratio Starting to Break in a Deflationary Direction
* Several Deflation-Sensitive Industry Groups Looking Stronger
Deflation Index Leading the Market Higher
Last week, I wrote about the possibility of an upside price move in the bond market. So far, most areas remain below...
READ MORE
MEMBERS ONLY
Negative Divergences Could Wreak Havoc On U.S. Stocks
by Tom Bowley,
Chief Market Strategist, EarningsBeats.com
Market Recap for Monday, March 18, 2019
U.S. stocks moved modestly higher on Monday, extending Friday breakouts on both the S&P 500 (+0.37%) and NASDAQ (+0.34%). The Russell 2000 gained 0.67% to lead the action. Crude oil prices ($WTIC, +1.47%) topped $59 per...
READ MORE
MEMBERS ONLY
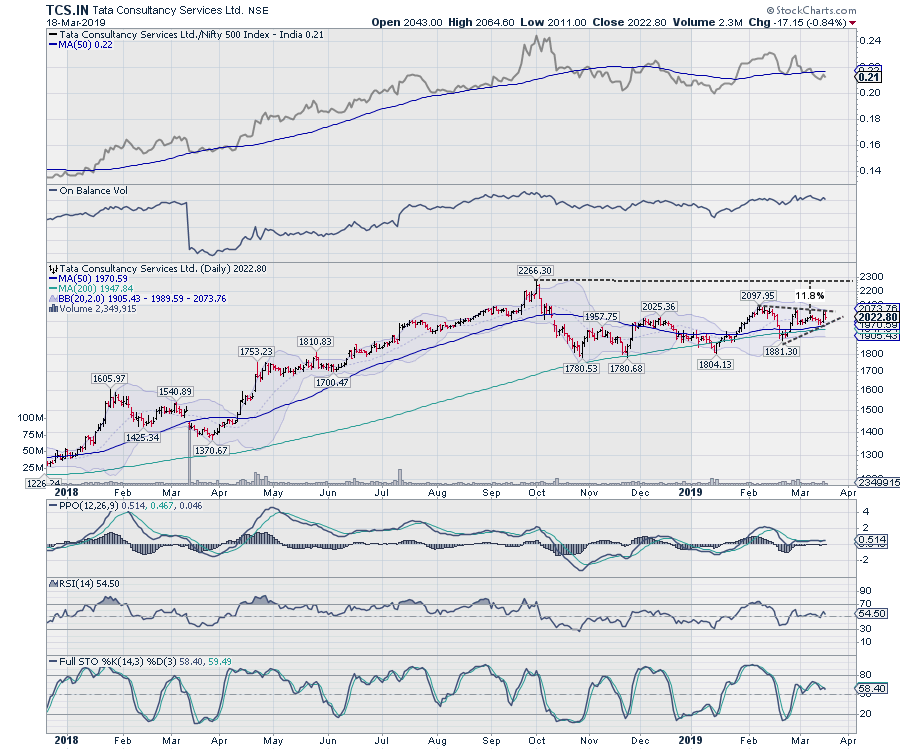
TCS: Likely Shift of Action to IT Pack May See This Stock Relatively Outperform
by Milan Vaishnav,
Founder and Technical Analyst, EquityResearch.asia and ChartWizard.ae
The IT Pack remains firmly placed in the leading quadrant of the Relative Rotation Graph (RRG) as bench-marked against the broader CNX500 index. However, the IT index has relatively under-performed the front-line NIFTY over the past couple of days. With the NIFTY likely to take a breather and consolidate over...
READ MORE
MEMBERS ONLY
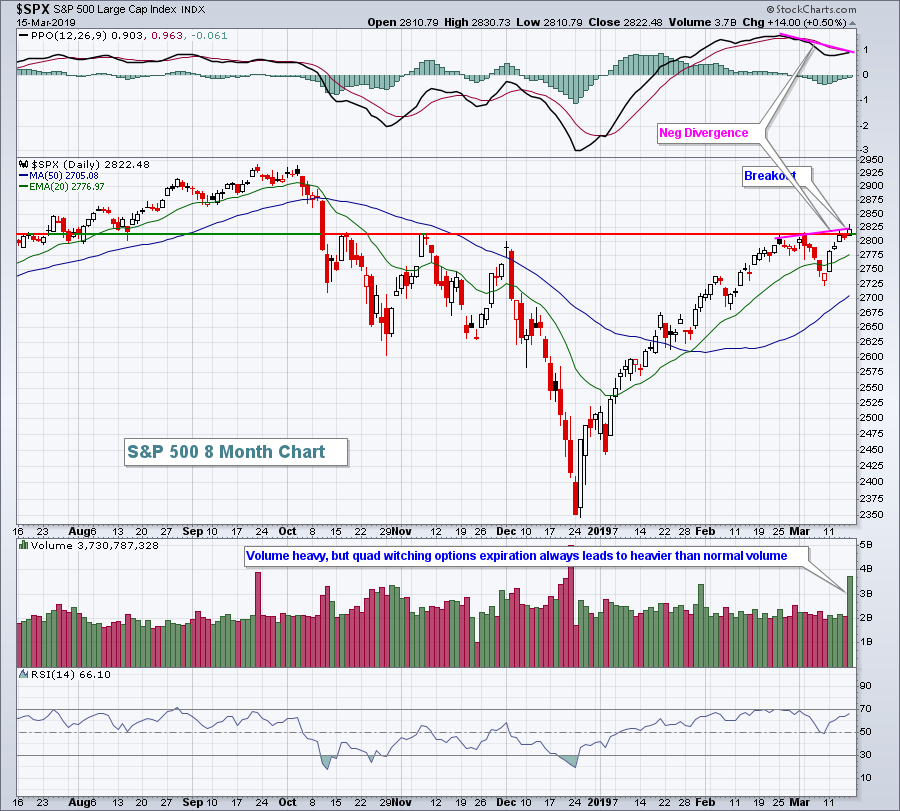
Here's A Gem In Apparel Retail
by Tom Bowley,
Chief Market Strategist, EarningsBeats.com
Market Recap for Friday, March 15, 2019
It was another solid day for the bulls to close out last week. It was also quad-witching options expiration Friday, which typically results in much-heavier-than-usual volume. Volume was certainly heavy on Friday. Leadership was found in the aggressive NASDAQ, which jumped 0.76%...
READ MORE
MEMBERS ONLY

Amazon Makes a Threat
by Arthur Hill,
Chief Technical Strategist, TrendInvestorPro.com
Amazon is lagging the Nasdaq 100 ETF (QQQ) and the broader market over the last two months because it has yet to clear its January high and remains below the 200-day SMA. This is part of the reason the Invesco Momentum ETF (SPMO) is underperforming the Invesco Minimum Volatility ETF...
READ MORE
MEMBERS ONLY
Could The S&P 500 Fall 2.6% Every Year For 16 Straight Years?
by Tom Bowley,
Chief Market Strategist, EarningsBeats.com
In a sense, it already has. Well, maybe not 16 straight years, but play along.
I've done a lot of historical stock market research over the years and several patterns really stand out. But one in particular always keeps me on edge as a short-term trader. The week...
READ MORE
MEMBERS ONLY
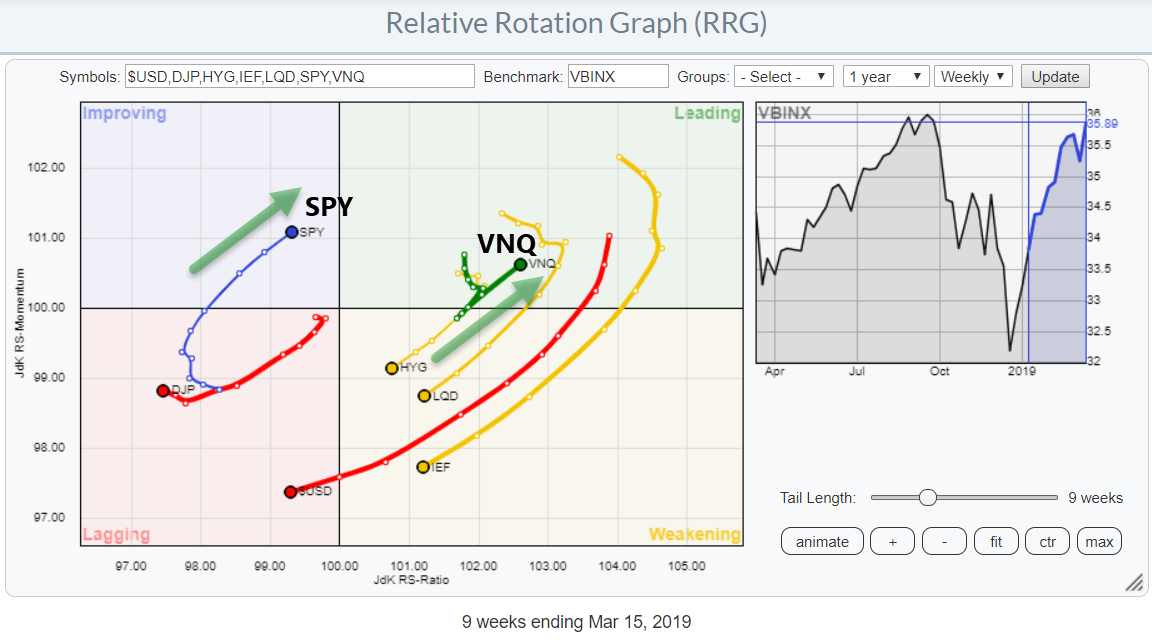
Real Estate Now Leading On Asset Class- And Sector RRGs
by Julius de Kempenaer,
Senior Technical Analyst, StockCharts.com
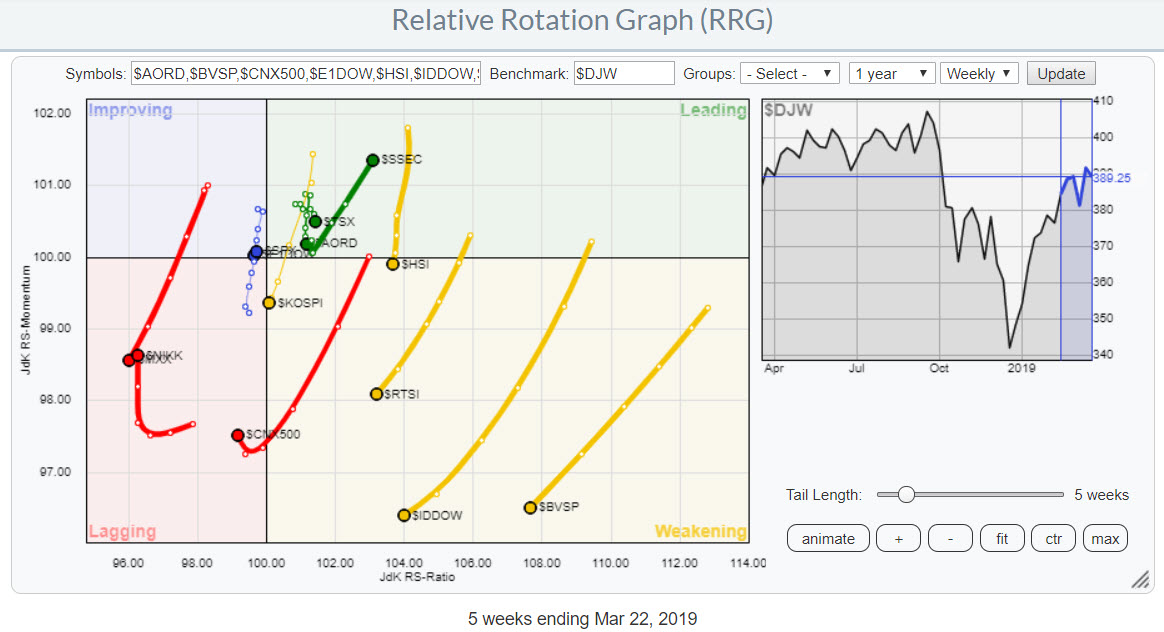
This Relative Rotation Graph shows the rotation for asset classes over the past 9 weeks. The main observation is that fixed income related asset classes are all inside weakening and heading, rapidly, towards lagging.
SPY (stocks) is close to returning into the leading quadrant. The strongest rotation at the moment,...
READ MORE
MEMBERS ONLY

Party Like it's 1999
by Arthur Hill,
Chief Technical Strategist, TrendInvestorPro.com
Anyone recognize these two phones? A good old indestructible Nokia candy bar was the first phone for many of us. I had a few Nokia cellphones over the years and they always worked great, back in the day. And, we all remember the Nokia ring tone, which was the most...
READ MORE
MEMBERS ONLY
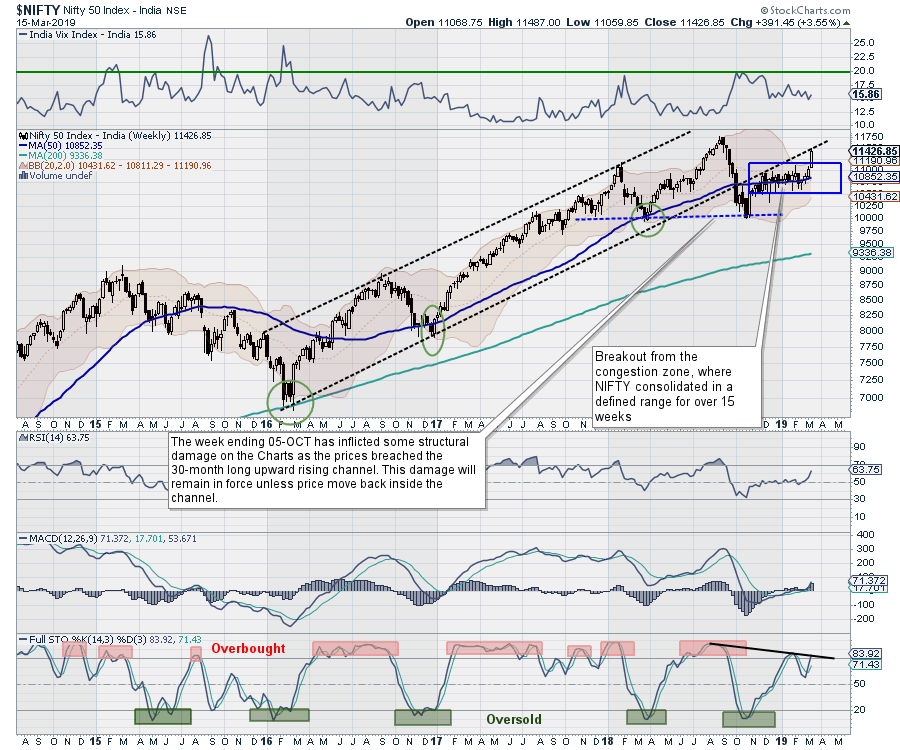
Time To Place Prudence Before Greed in the Coming Week
by Milan Vaishnav,
Founder and Technical Analyst, EquityResearch.asia and ChartWizard.ae
Over the past week, the market performed in striking contrast to what had been expected. For nearly 15 weeks, the markets were consolidating near their 50-Week MA and, last week, were showing signs of further impending consolidation. In spite of this, the markets ended up putting up a very strong...
READ MORE