MEMBERS ONLY
Discretionary Stocks Poised For A Bullish Explosion

by Tom Bowley,
Chief Market Strategist, EarningsBeats.com
Market Recap for Thursday, February 21, 2019
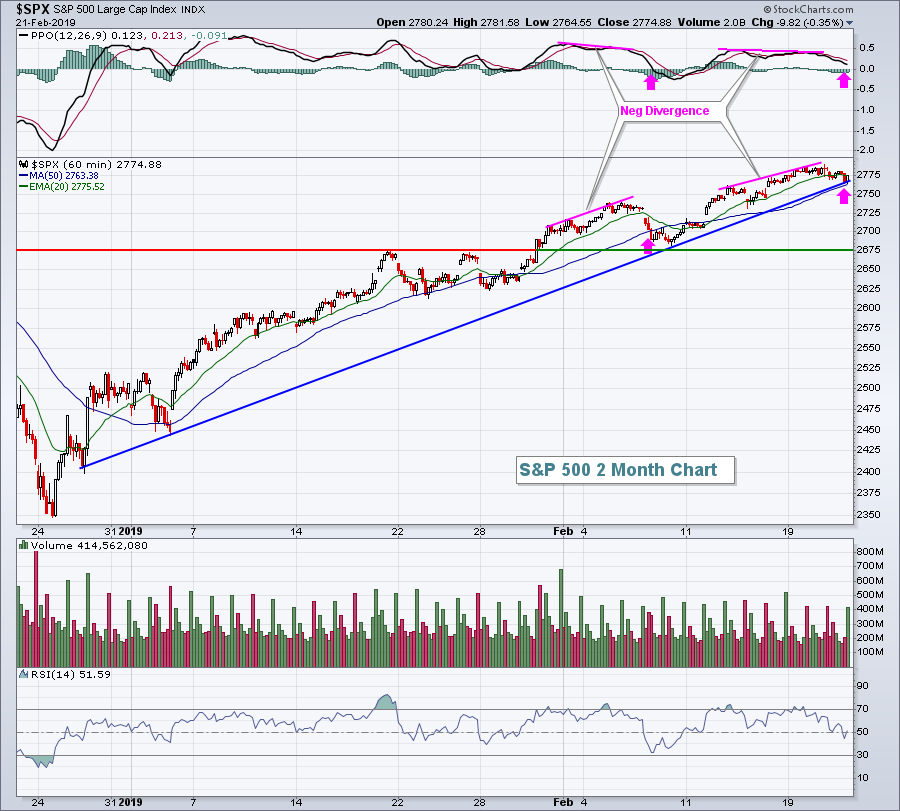
U.S. stocks stalled on Thursday, but a minimum of sideways consolidation this week was to be expected given 60 minute negative divergences that I discussed earlier in the week. Before we talk about yesterday's action, check out how the negative...
READ MORE
MEMBERS ONLY

STOCK INDEXES TEST OVERHEAD RESISTANCE WHILE LOOKING OVEREXTENDED -- FINANCIALS AND MATERIALS TEST 200-DAY LINES -- UTILITIES NEAR A NEW RECORD HIGH -- COPPER ACHIEVES BULLISH BREAKOUT AS COMMODITIES STRENGTHEN

by John Murphy,
Chief Technical Analyst, StockCharts.com
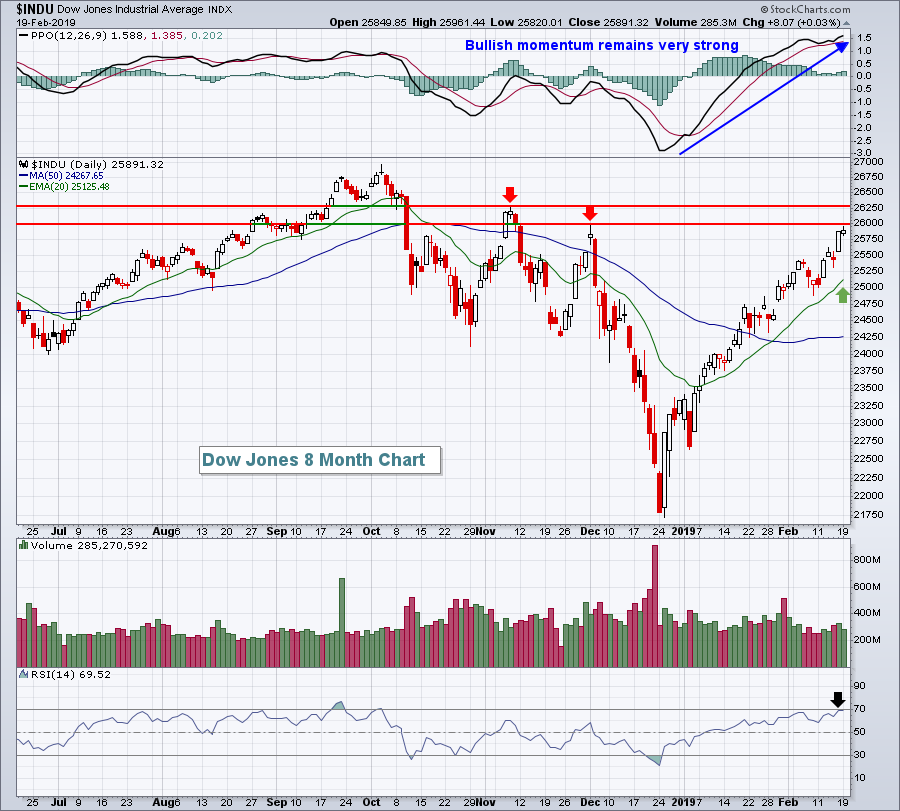
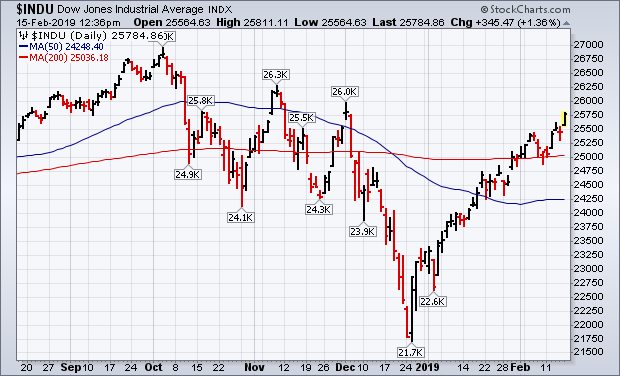
MAJOR STOCK INDEXES TEST OVERHEAD RESISTANCE ... All three major U.S stocks are testing overhead resistance barriers. Chart 1 shows the Dow Industrials right up against their early December peak at 26000. That's the Dow's first test of a previous peak formed during the fourth quarter...
READ MORE
MEMBERS ONLY
A Commodity Bottom? There's Not One In Sight
by Tom Bowley,
Chief Market Strategist, EarningsBeats.com
Market Recap for Tuesday, February 19, 2019
We saw a bit of intraday back and forth action on Wednesday with the same result - another Wall Street gain. I'm really surprised we haven't seen more selling this week. We're at major price resistance levels...
READ MORE
MEMBERS ONLY
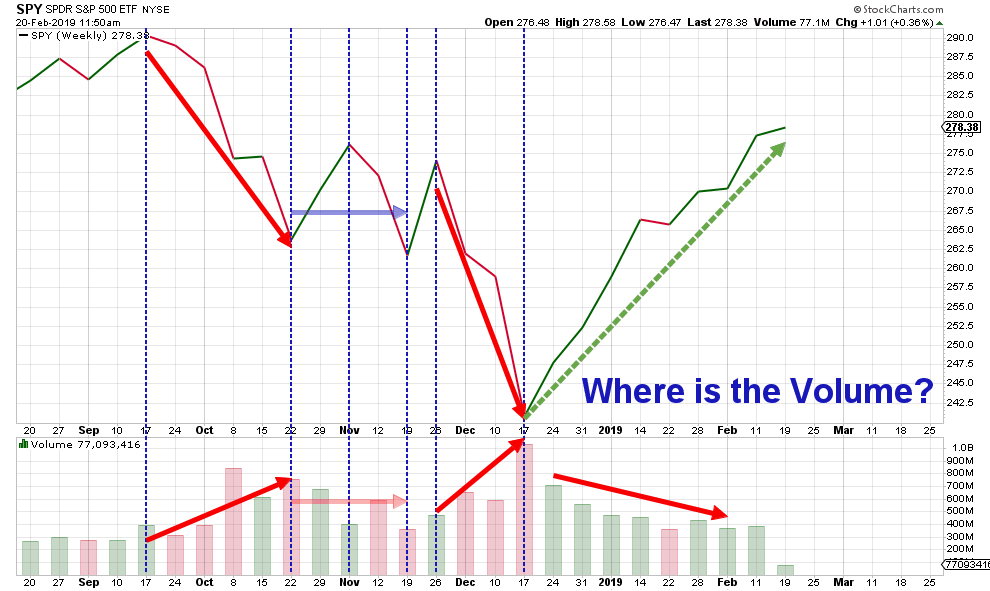
Where Is The Volume?

by Julius de Kempenaer,
Senior Technical Analyst, StockCharts.com
My last article in the RRG blog looks at sector rotation for US sectors and how there are some disconnects between groups of sectors on both the daily and the weekly time frames.
My conclusion from that article was that the current rotational patterns are sending mixed signals which makes...
READ MORE
MEMBERS ONLY

DP Alert: New LT Trend Model BUY Signal for Dow - Oil Looking Good

by Erin Swenlin,
Vice President, DecisionPoint.com
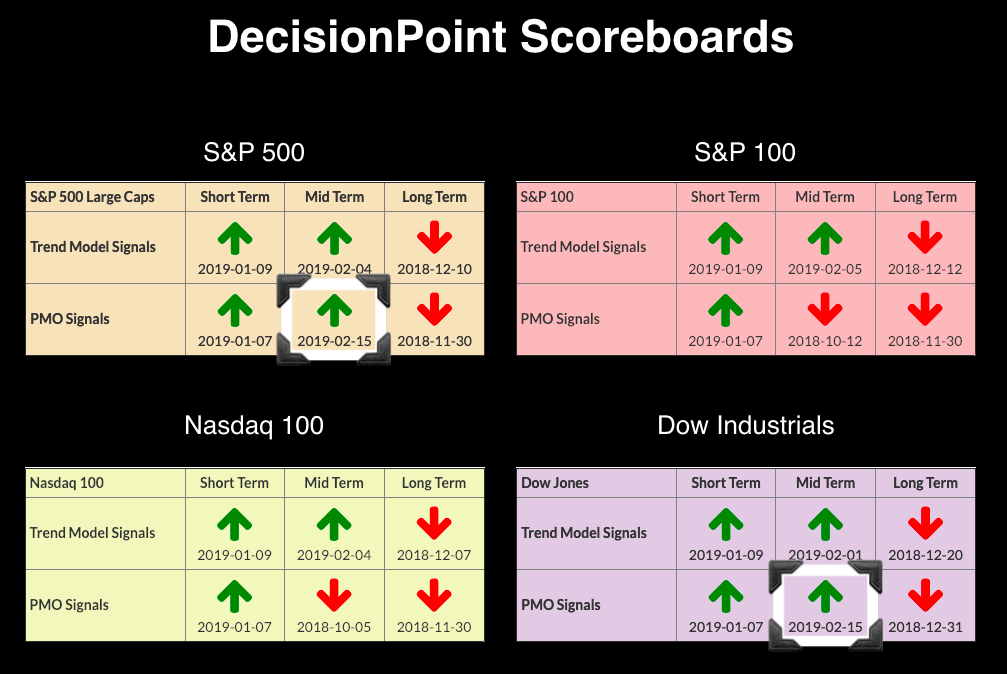
Today, we had two important signal changes. First, on the Dow Industrials, a LT Trend Model BUY signal triggered as the 50-EMA crossed above the 200-EMA. Second, USO generated an IT Trend Model BUY signal.
I imagine the first question that will be asked about this new LT BUY signal...
READ MORE
MEMBERS ONLY

DOVISH FED HAS CONTRIBUTED TO FALLING BOND YIELDS -- FALLING GERMAN YIELDS ARE ALSO HOLDING TREASURY YIELDS DOWN -- FALLING GLOBAL BOND YIELDS MAY ALSO EXPLAIN RECENT BUYING OF GOLD AND MINERS
by John Murphy,
Chief Technical Analyst, StockCharts.com
TEN-YEAR TREASURY YIELD REMAINS WEAK ... Despite renewed optimism in the stock market which has had a spectacular start to the new year, Treasury yields remain surprisingly low. Chart 1 shows the 10-Year Treasury Yield ($TNX) still trading close to its lowest level in a year. The TNX also remains below...
READ MORE
MEMBERS ONLY
U.S. Equities Approach Key Resistance, Expect A Battle
by Tom Bowley,
Chief Market Strategist, EarningsBeats.com
Market Recap for Tuesday, February 19, 2019
Materials (XLB, +0.62%) and utilities (XLU, +0.59%) led another Wall Street rally on Tuesday, although our major indices did see a bit of selling into the close. The XLB and XLU benefited from a falling dollar ($USD, -0.40%) and 10...
READ MORE
MEMBERS ONLY
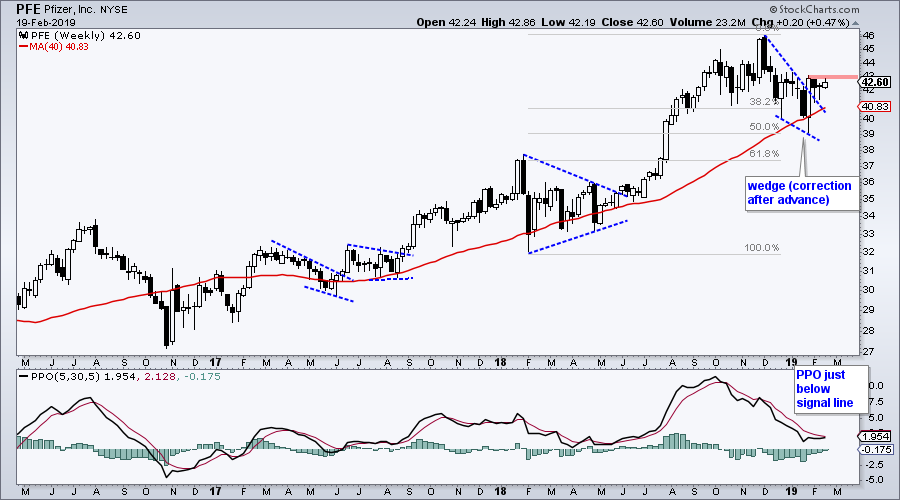
Pfizer Bids to End Correction

by Arthur Hill,
Chief Technical Strategist, TrendInvestorPro.com
When sitting down to a chart, or even standing, establishing the direction of the bigger trend is the first task. The direction of this trend establishes my trading bias and tells me where to focus. My trading bias is bullish when the trend is up and this means I focus...
READ MORE
MEMBERS ONLY
Breadth Indicators Flip as Big Banks Take the Lead
by Arthur Hill,
Chief Technical Strategist, TrendInvestorPro.com
* Six of Nine Breadth Indicators Bullish.
* November 2015 All Over Again?
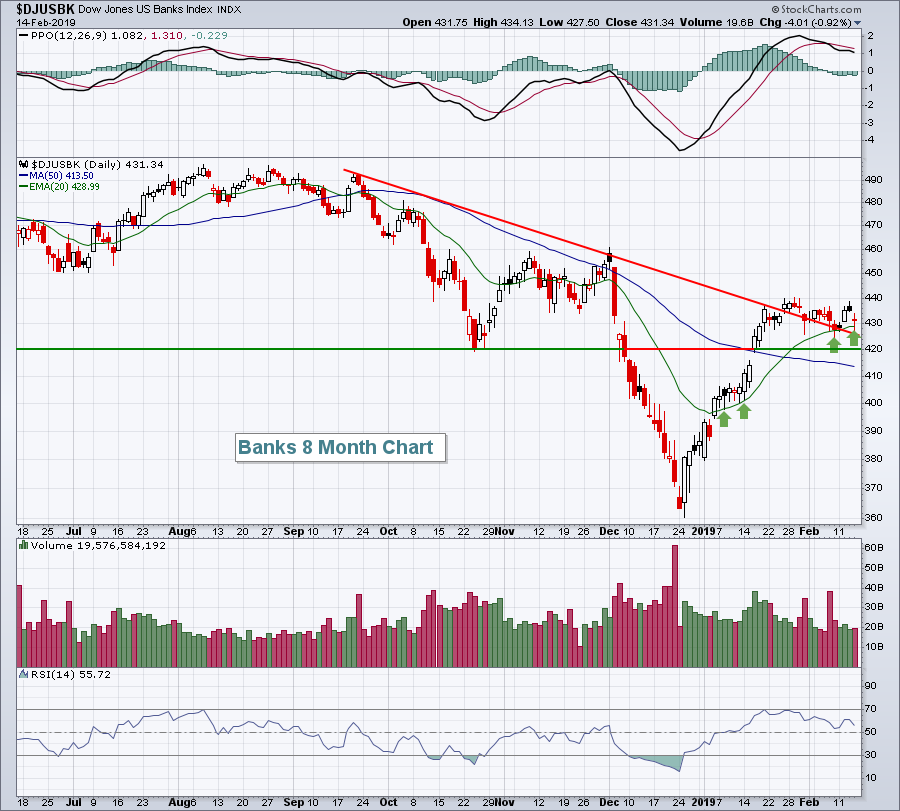
* JP Morgan, Bank of America and Citigroup Break Out.
* A Successful Test for Disney.
* ChartList Addition and Deletion.
* On Trend on YouTube.
Breadth Indicators Flip Back to Bullish
The S&P 500 turned net bullish on February 5th...
READ MORE
MEMBERS ONLY

A New All-Time High In The NYSE A/D Line Is Bullish Until It Isn't

by Martin Pring,
President, Pring Research
* Superior Breadth Over Price Does Not Always Have a Positive Outcome
* Weighted versus Equal Weight
Chart 1 shows that the NYSE A/D Line touched a new high last week and seems to be leading the S&P higher. The textbooks tell us that a broad advance, such as...
READ MORE
MEMBERS ONLY
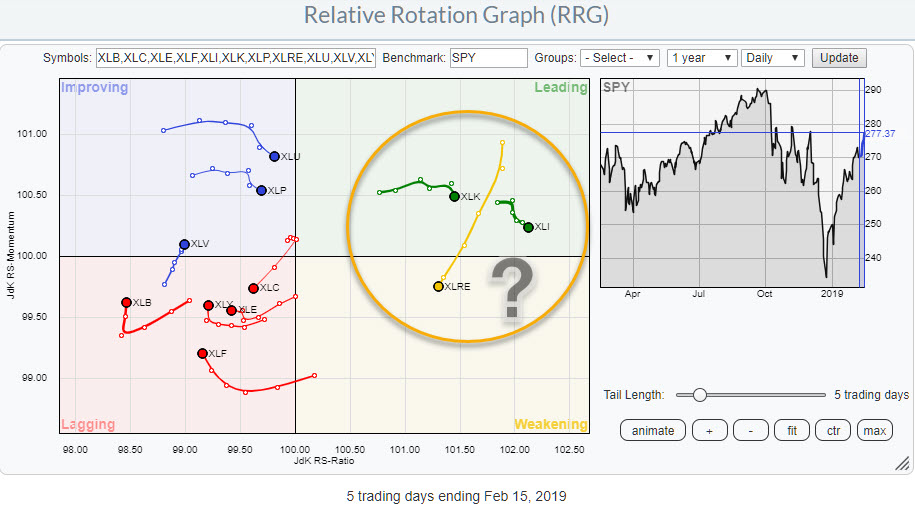
Two Sectors Are Rolling Over Inside The Leading Quadrant On The Daily RRG
by Julius de Kempenaer,
Senior Technical Analyst, StockCharts.com
The Relative Rotation Graphs, both daily and weekly, for US sectors are showing big disconnects between sectors.
The image above holds the US sectors and shows daily rotations.
It is immediately obvious that there is a big gap/disconnect between the right (=positive) side and the left (=negative)side of...
READ MORE
MEMBERS ONLY
T-Mobile (TMUS) Breaks Out, Dialed-In For Spring Ka-Ching!
by Tom Bowley,
Chief Market Strategist, EarningsBeats.com
Market Recap for Friday, February 15, 2019
Friday produced very solid gains as the U.S. government averted a second shutdown as a funding resolution was passed. Also, there was word that US-China trade talks were progressing and any positive developments there are typically well-received by global markets. In an...
READ MORE
MEMBERS ONLY

Pair Analysis - 3

by Greg Morris,
Veteran Technical Analyst, Investor, and Author
The is the third article on Pair Analysis. Here I will show the results for several different pair combinations with reduced commentary. If you have not read the previous two articles on Pair Analysis, I strongly suggest you do so before continuing with this one.
Recall, the pair analysis is...
READ MORE
MEMBERS ONLY
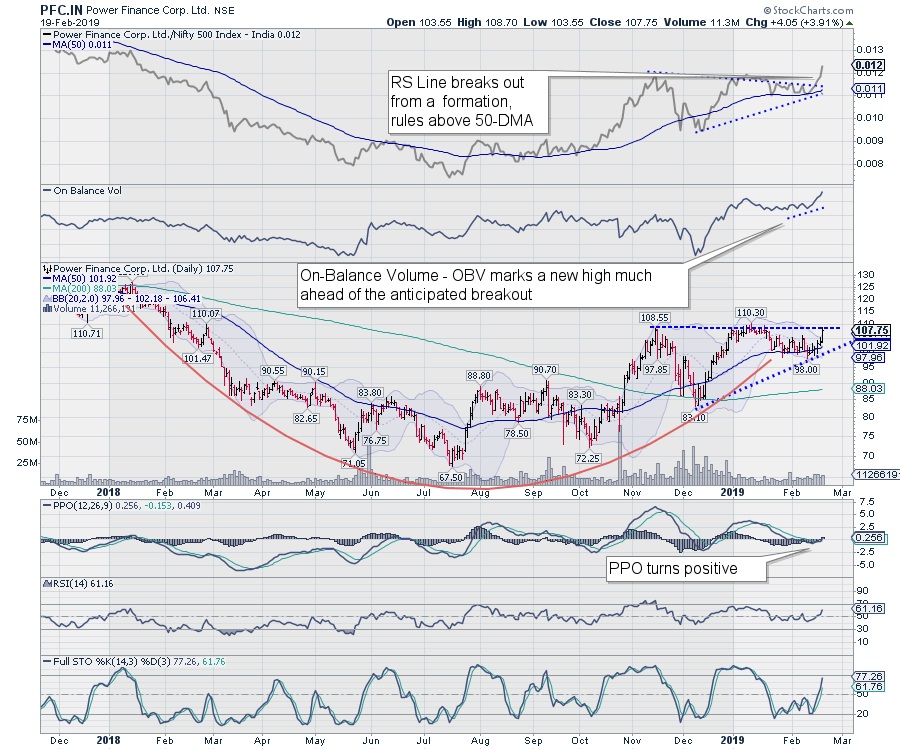
Greater Possibilities Of A Breakout In This Stock

by Milan Vaishnav,
Founder and Technical Analyst, EquityResearch.asia and ChartWizard.ae
With the session that ended on Tuesday, February 19, 2019, the Indian headline index NIFTY50 closed in the red for the eighth consecutive day. Amid such a weak environment, there are certain stocks which are showing great relative strength and are strongly outperforming the broader markets. Once such stock that...
READ MORE
MEMBERS ONLY
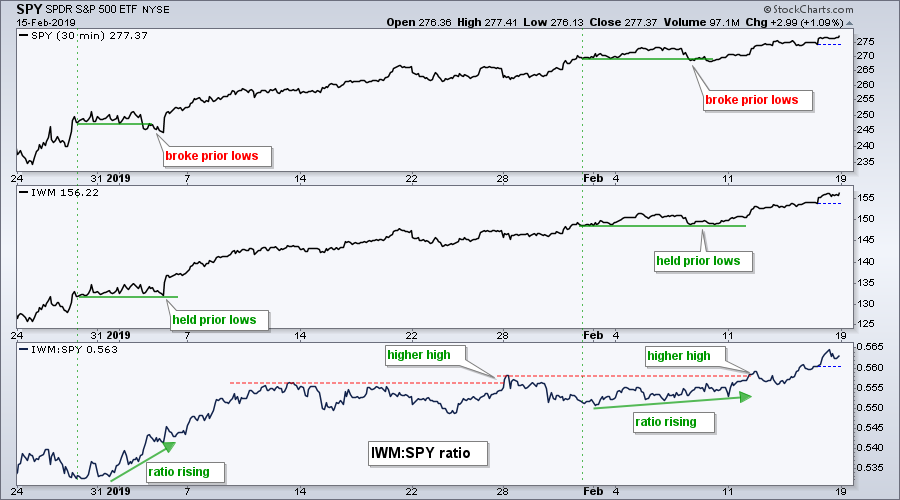
Techniques to Spot Early Signs of Relative Strength
by Arthur Hill,
Chief Technical Strategist, TrendInvestorPro.com
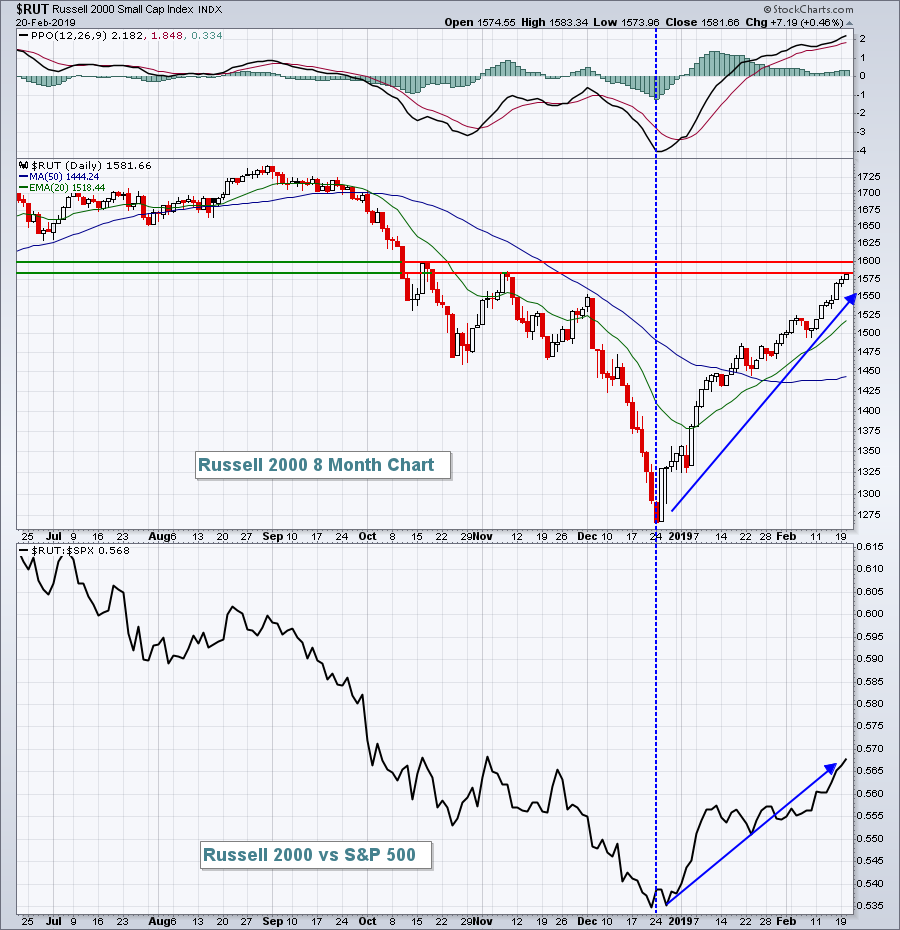
Chartists can compare two price plots to find early signs of relative strength. This can be done by comparing the corresponding peaks or troughs for two names, such as the Russell 2000 iShares (IWM) and the S&P 500 SPDR (SPY). It is a sign of relative strength when...
READ MORE
MEMBERS ONLY
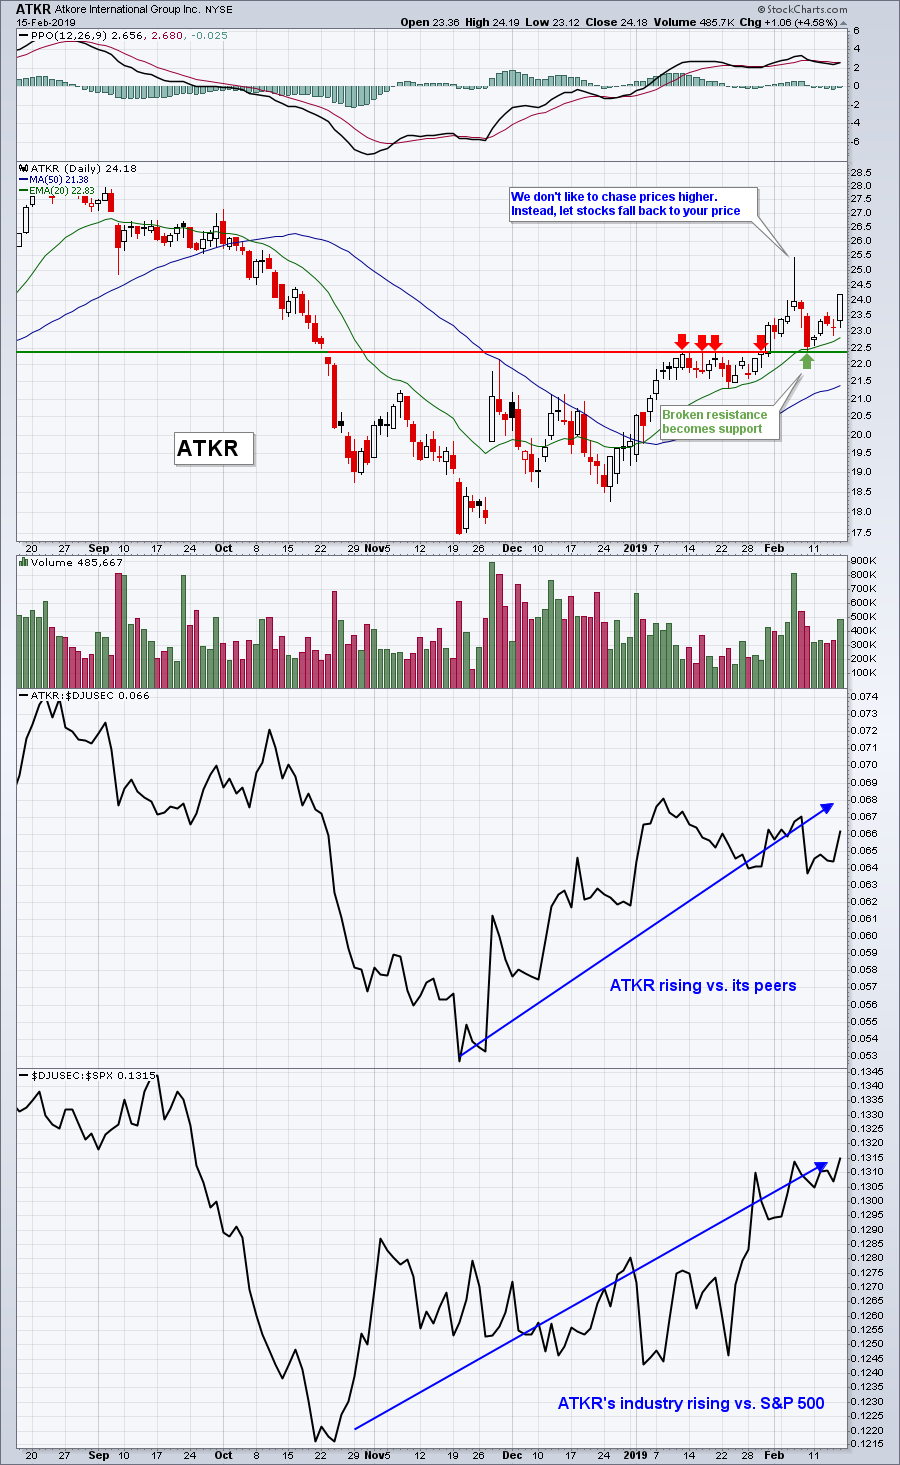
The Secret Combination For Solid Reward To Risk Trades

by John Hopkins,
President and Co-founder, EarningsBeats.com
Well, it's really not a secret, but it's our secret at EarningsBeats.com. Our mantra is "Better Timing. Better Trades." and, for us, that means finding the best stocks, identifying key price and moving average support and then adding.....an extra helping of patience....
READ MORE
MEMBERS ONLY
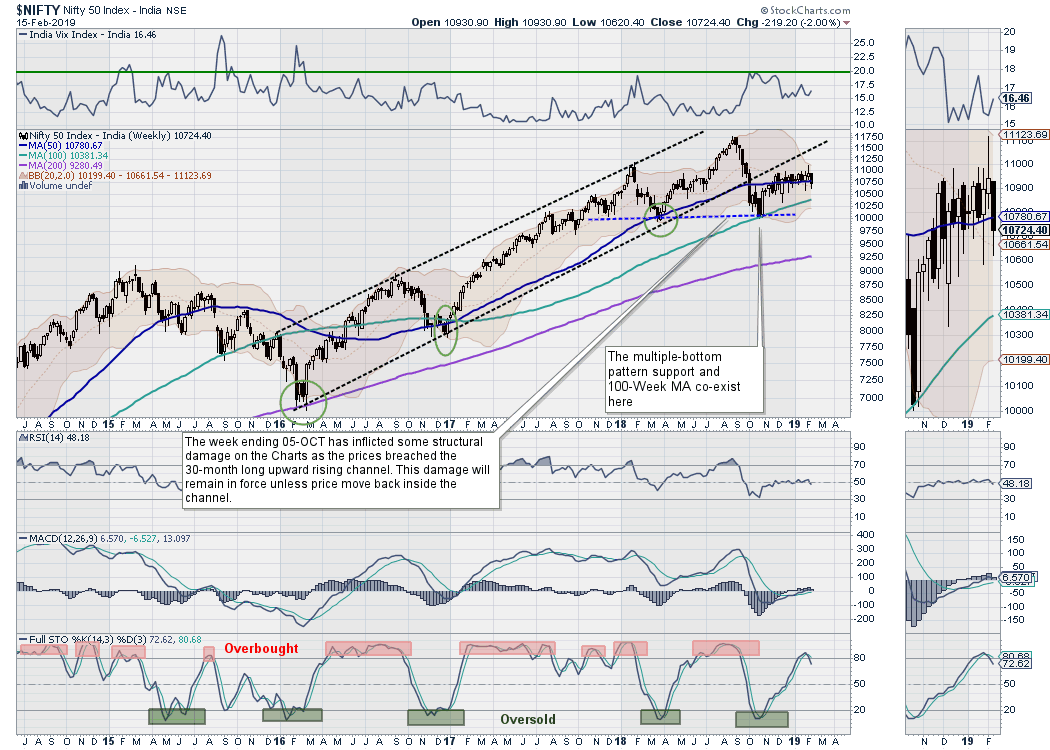
Week Ahead: Stable Start To The Week Expected; Cracks Might Appear If These Levels Are Not Defended
by Milan Vaishnav,
Founder and Technical Analyst, EquityResearch.asia and ChartWizard.ae
The past week remained quite dismal for the market, which ended in the negative on all five days. After a failed breakout on the daily charts, the NIFTY returned inside the broad trading range and subsequently drifted even lower. The index has been defending the 50-Week Moving Average for over...
READ MORE
MEMBERS ONLY
Here's How Relative Strength Will Help Your Trading Right Now
by Tom Bowley,
Chief Market Strategist, EarningsBeats.com
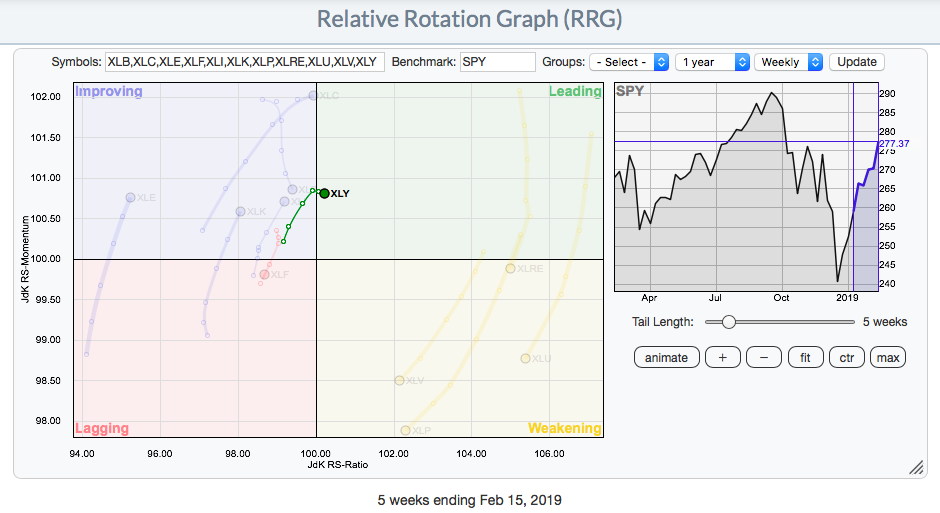
Understanding relative strength is extremely important in outperforming the benchmark S&P 500. As a sector begins to outperform, it tells us that money is rotating towards that particular sector. One way to visualize this is to look at an RRG chart. It will only take one glance to...
READ MORE
MEMBERS ONLY
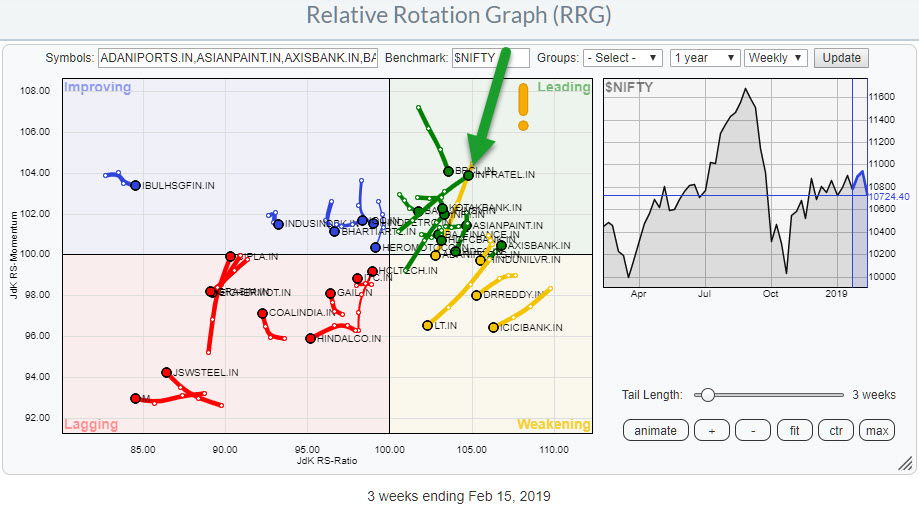
Checking The NIFTY 50 Universe On RRG Results In A Nice Setup For INFRATEL.IN
by Julius de Kempenaer,
Senior Technical Analyst, StockCharts.com
With more and more eyeballs looking at the Indian stock market and data for individual stocks and sectors becoming available on Stockcharts.com I started to keep an eye on developments in that market via Relative Rotation Graphs.
To make it easier (for you but also myself), the NIFTY 50...
READ MORE
MEMBERS ONLY
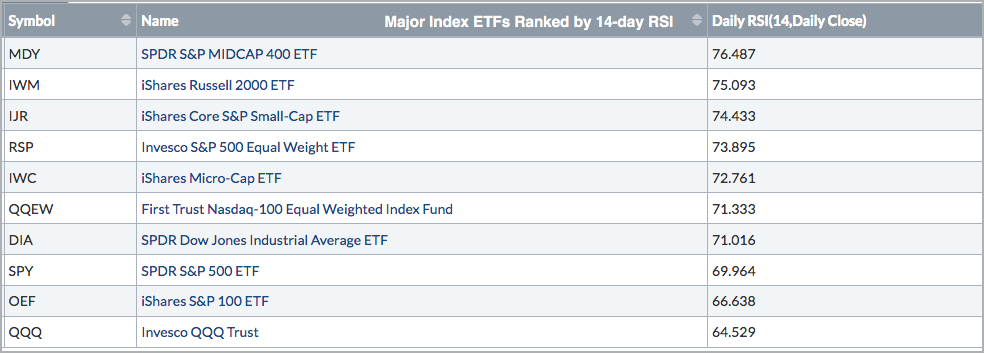
Small and Mid Caps Take the Momentum Lead
by Arthur Hill,
Chief Technical Strategist, TrendInvestorPro.com
The Relative Strength Index (RSI) is a momentum indicator that chartists can use to measure the strength behind a price move. Moreover, chartists can also use RSI values to rank momentum and find the leaders.
As an indicator that measures the magnitude of gains relative to the magnitude of losses,...
READ MORE
MEMBERS ONLY
Dow and SPX Log New IT BUY Signals - Consumer Discretionary (XLY) LT BUY Signal
by Erin Swenlin,
Vice President, DecisionPoint.com
During today's DecisionPoint show on StockCharts TV (airing Fridays at 4:30p EST), Carl and I discussed how, while we're still bearish, there are signs of improvement. The main problem will be getting too overbought. Three signs of definite improvement are the two new IT Price...
READ MORE
MEMBERS ONLY
Nasdaq May Be the Third Major Stock Index to Cross Its Red Line
by John Murphy,
Chief Technical Analyst, StockCharts.com
Editor's Note: This article was originally published in John Murphy's Market Message on Friday, February 15th at 12:40pm ET.
Charts 1 and 2 show the Dow Industrials and S&P 500 building on their gains after rising above their 200-day averages (red lines). Both...
READ MORE
MEMBERS ONLY
DP WEEKLY WRAP: Negative Signs Still Haven't Delivered

by Carl Swenlin,
President and Founder, DecisionPoint.com
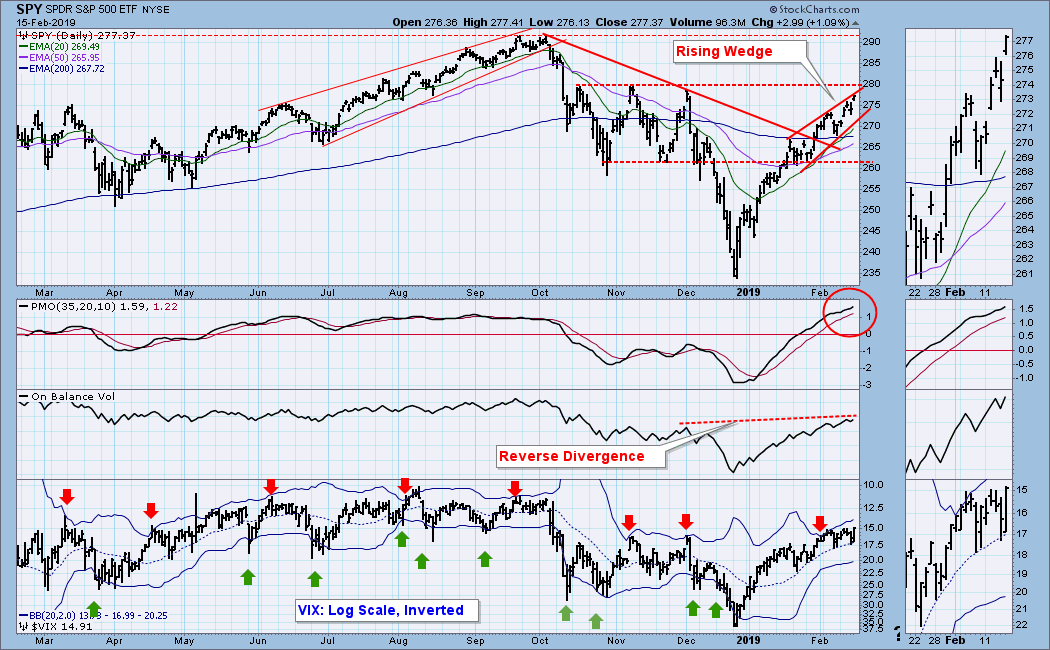
There are some indicators that have been warning of a price top for a couple of weeks, but the market just keeps powering upward. (1) There is an OBV reverse divergence, where the OBV has exceeded its December top well ahead of price. This means that heavy volume hasn'...
READ MORE
MEMBERS ONLY

How To Get The Confidence To Profit From Bullish To Bearish Transitions By Recognizing The Evidence

by Gatis Roze,
Author, "Tensile Trading"
Life can be cruel if change happens and you miss the signs during the transition. I’ll offer up four examples with mild to toxic consequences: Weather, Science, Superstars and finally, the Stock Market.
Pretty much everyone is aware of the predictable and abrupt shift in the weather as the...
READ MORE
MEMBERS ONLY

MARKET RALLY CONTINUES AS NASDAQ TESTS ITS 200-DAY AVERAGE -- FINANCIALS LEAD TODAY'S GAINS -- DRUGS HELP BOOST HEALTHCARE SECTOR -- HOME DEPOT, UNITED TECHNOLOGIES, AND TRAVELERS ARE DOW LEADERS -- SEMICONDUCTORS SHOW NEW LEADERSHIP
by John Murphy,
Chief Technical Analyst, StockCharts.com
NASDAQ MAY BE THE THIRD MAJOR STOCK INDEX TO CROSS ITS RED LINE ... Charts 1 and 2 show the Dow Industrials and S&P 500 building on their gains after rising above their 200-day averages (red lines). Both now appear headed for a test of their early December peaks....
READ MORE
MEMBERS ONLY

Weekly Market Review & Outlook (w/Video) - S&P 500 Tilts Bullish
by Arthur Hill,
Chief Technical Strategist, TrendInvestorPro.com
* Reviewing the Weight of the Evidence
* New Highs Expand in XLK
* Sector Table is Net Bullish (XLK, XLV, XLI Lead)
* What If December-January Never Happened?
* Four Consolidations to Watch (XLF, IAI, XRT, IBB)
* New Additions to the ChartList
* AMD Keeps Flag Alive
* Finisar Holds Breakout
* Intuitive Surgical Breaks Pennant
* Walgreens-Boots...
READ MORE
MEMBERS ONLY
Turn Off CNBC And Turn On StockCharts TV
by Tom Bowley,
Chief Market Strategist, EarningsBeats.com
Market Recap for Thursday, February 14, 2019
Real estate (XLRE, +0.38%) and communications services (XLC, +0.37%) were the leaders yesterday as Wall Street staged a rally attempt after dealing with an early blow - a very weak December retail sales report. There's one thing everyone should...
READ MORE
MEMBERS ONLY

Gathering Evidence

by David Keller,
President and Chief Strategist, Sierra Alpha Research
Humans are emotional beings, generally making decisions based on their emotional state. Consequently, when the market moves against your positions, you will most likely have a visceral reaction to that event. The fear of losing and/or the fear of missing out are often the causes of bad investment decisions....
READ MORE
MEMBERS ONLY
JP Morgan deteriorates further on Relative Rotation Graph
by Julius de Kempenaer,
Senior Technical Analyst, StockCharts.com
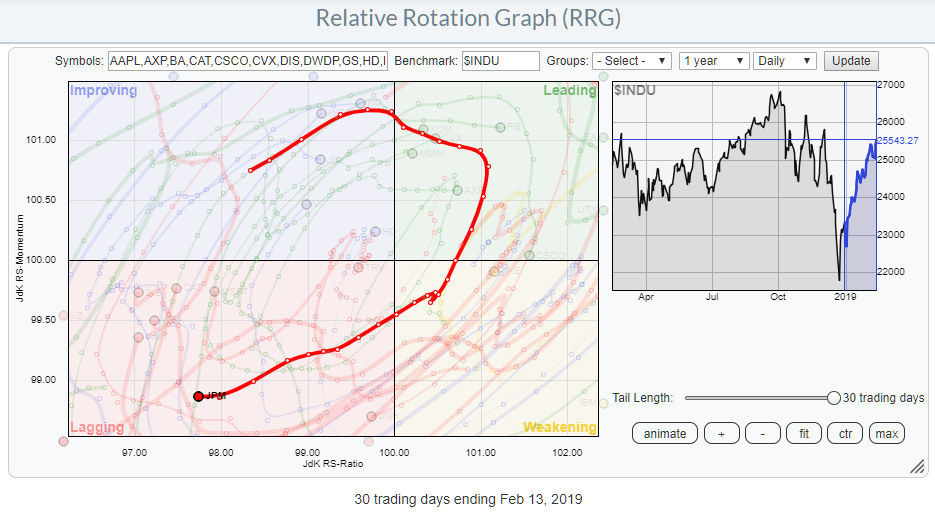
One of the choices in the drop-down selection on the Relative Rotation Graphs page is the DJ-industrials (Dow 30 Industrials). This RRG shows the rotation of all 30 Dow stocks against the $INDU.
The RRG above shows the daily rotation and highlights the rotation of JP Morgan Chase & Co....
READ MORE
MEMBERS ONLY

China Goes for a Breakout
by Arthur Hill,
Chief Technical Strategist, TrendInvestorPro.com
Chinese stocks came to life after their New Year's holiday with the Shanghai Composite ($SSEC) and some ETFs breaking double bottom resistance. Before looking at these charts, let's review the double bottom, which is a bullish reversal pattern. First and foremost, there must be a downtrend...
READ MORE
MEMBERS ONLY
For Now, Small Is Better
by Tom Bowley,
Chief Market Strategist, EarningsBeats.com
Market Recap for Wednesday, February 13, 2019
The stock market is beginning to exhibit a bit of the borishness that accompanies bull market advances. The Volatility Index ($VIX) remaining below 16 is confirming the reduced level of fear. There were certainly swings intraday yesterday, but the panicked, impulsive-type selling appears...
READ MORE
MEMBERS ONLY
DP Alert: Bearish Rising Wedge is Back on SPX
by Erin Swenlin,
Vice President, DecisionPoint.com
No changes to the DecisionPoint Scoreboards today. My concern now rests on the new bearish rising wedge that has appeared on the SPX chart. Not all of the indicators are confirming the recent rally. The newest change to the DecisionPoint Sector Scoreboard was an IT Trend Model BUY on the...
READ MORE
MEMBERS ONLY

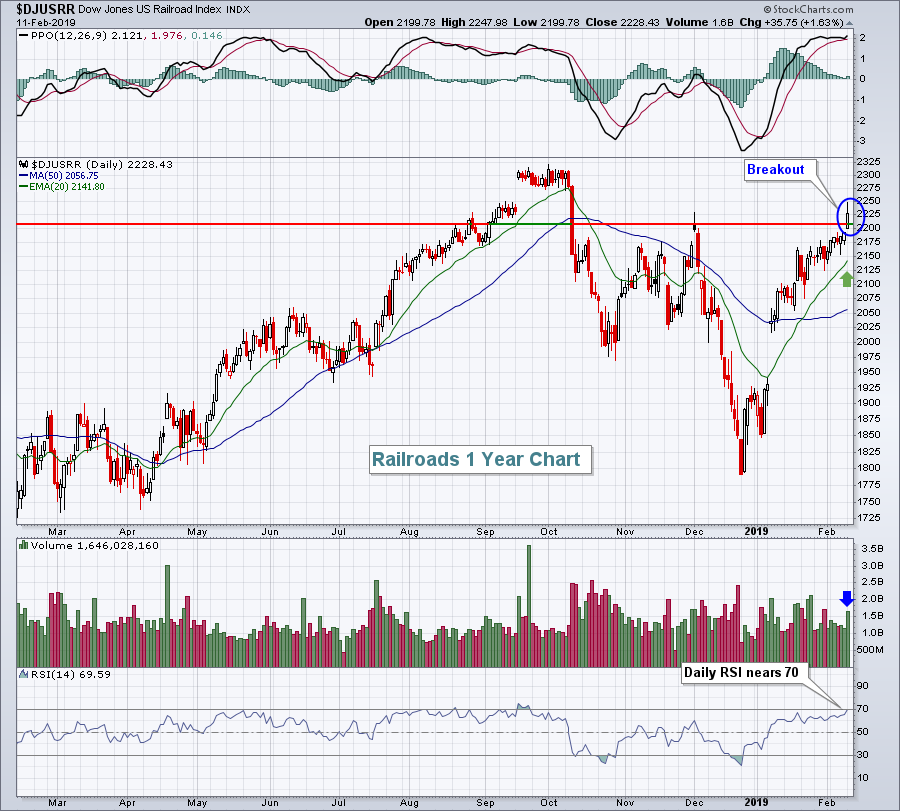
THE S&P 500 JOINS THE DOW ABOVE ITS 200-DAY AVERAGE -- CONSUMER DISCRETIONARY AND INDUSTRIAL SPDRS HAVE CROSSED THEIR THEIR RED LINES -- THE XLI HAS ALSO CLEARED ITS DECEMBER HIGH -- RAILS ARE BOOSTING THE XLI -- NYSE AD LINES NEAR TEST OF 2018 HIGHS
by John Murphy,
Chief Technical Analyst, StockCharts.com
S&P 500 CROSSES ABOVE ITS 200-DAY AVERAGE... Up to last night, the Dow Industrials were the only major stock index to trade above their 200-day average. The S&P 500 closed marginally above its 200-day line yesterday. Chart 2 shows the SPX extending that gain over its...
READ MORE
MEMBERS ONLY
Finding Stocks To Achieve Your Goals
by Tom Bowley,
Chief Market Strategist, EarningsBeats.com
Market Recap for Tuesday, February 12, 2019
Another government shutdown was averted and the U.S. stock market reacted quite favorably, as you might expect, with all of our major indices surging higher. Our major indices had quite a day:
Dow Jones: +1.49%
S&P 500: +1.29%...
READ MORE
MEMBERS ONLY
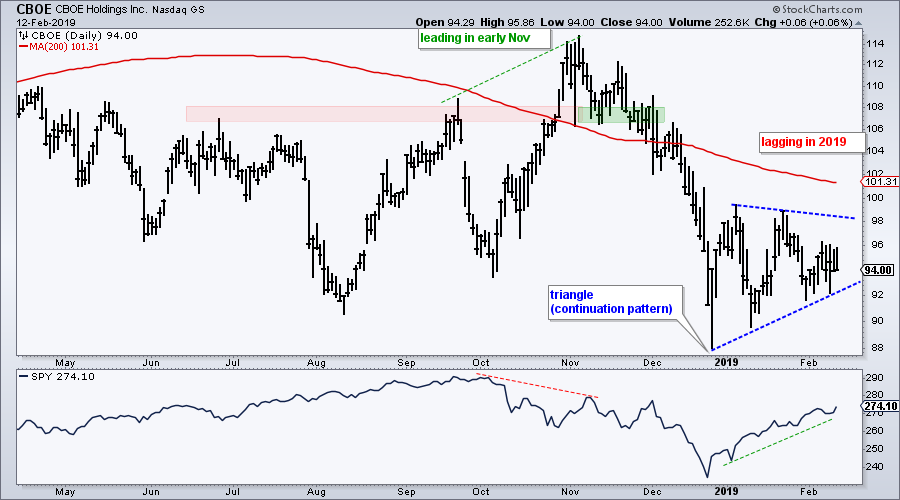
CBOE Holdings Fails to Bounce
by Arthur Hill,
Chief Technical Strategist, TrendInvestorPro.com
We are 29 trading days into 2019 and the S&P 500 is up a very respectable 9.49%. Furthermore, some 465 stocks in the S&P 500 are up year-to-date, which means 35 are down year-to-date. CBOE Holdings (CBOE) is one of these stocks (-3.91% year-to-date)...
READ MORE
MEMBERS ONLY
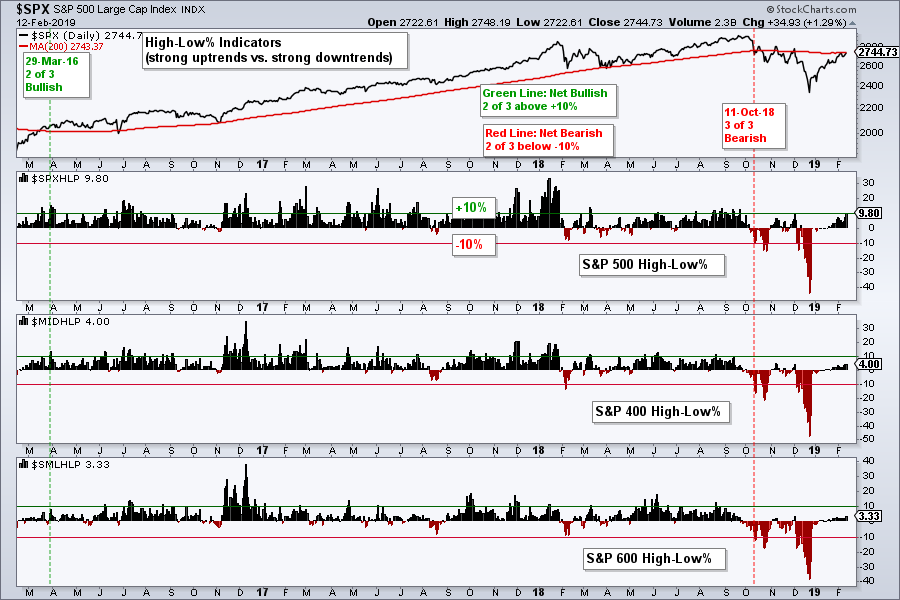
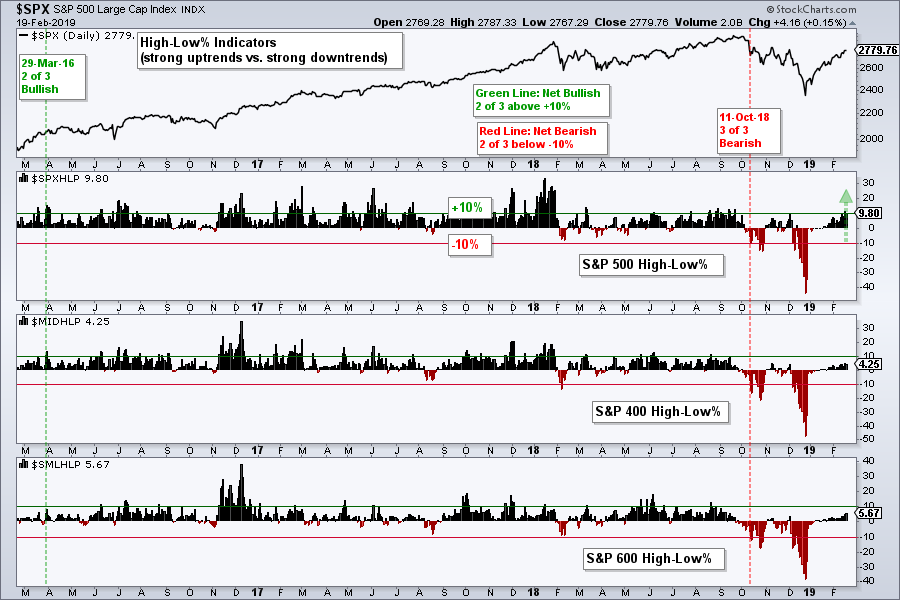
New Highs Expand - Plus Four Stocks
by Arthur Hill,
Chief Technical Strategist, TrendInvestorPro.com
* SPX High-Low Percent Nears Signal Flip.
* Intuitive Surgical Breaks Out.
* Walgreens-Boots Bounces off 200-day.
* Careful with AMD.
* RSI Improvements in Intel.
... Five of the nine breadth indicators are on bearish signals right now, but S&P 500 High-Low% ($SPXHLP) reached 9.8% on Tuesday and is close to triggering...
READ MORE
MEMBERS ONLY

Pair Analysis - 2
by Greg Morris,
Veteran Technical Analyst, Investor, and Author
To prove that I read all comments, here are some pair charts and data that is updated to 12/31/2018. First a review of what pair analysis is.
My pair analysis is accomplished on weekly data. Think of the ratio line like this: when it is moving upward it...
READ MORE
MEMBERS ONLY
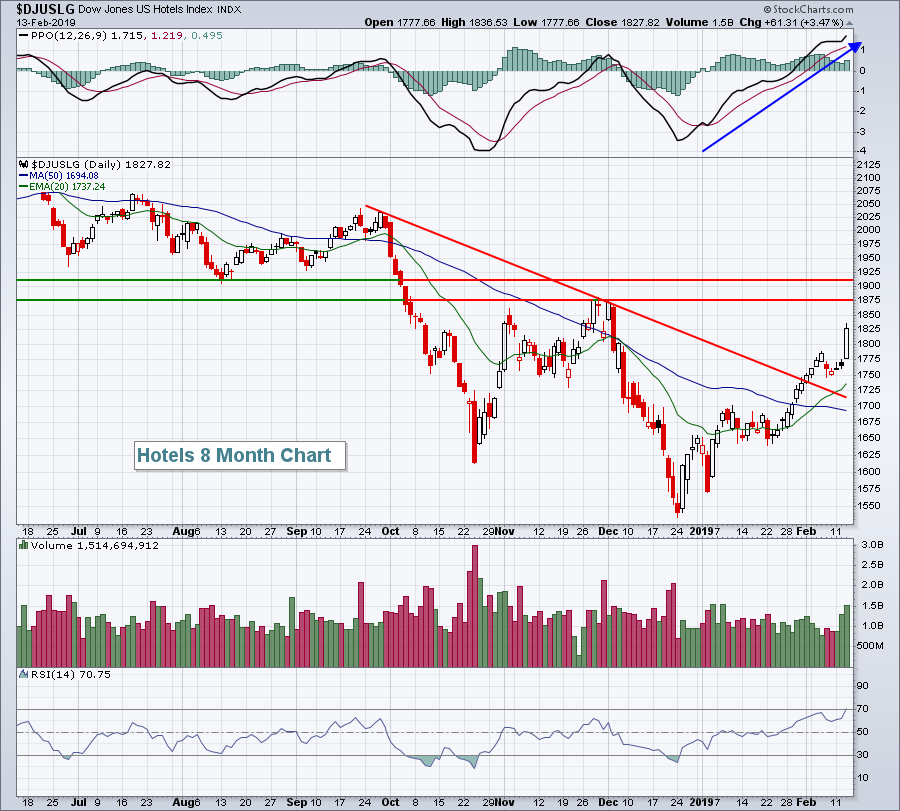
Time To Place Your Spring Hotel Reservation?
by Tom Bowley,
Chief Market Strategist, EarningsBeats.com
Market Recap for Monday, February 11, 2019
Industrials (XLI, +0.53%), energy (XLE, +0.48%) and financials (XLF, +0.31%) were Monday's leaders as bifurcated action was once again present. The clear index leader was the small cap Russell 2000 index (+0.84%) and that's become...
READ MORE
MEMBERS ONLY
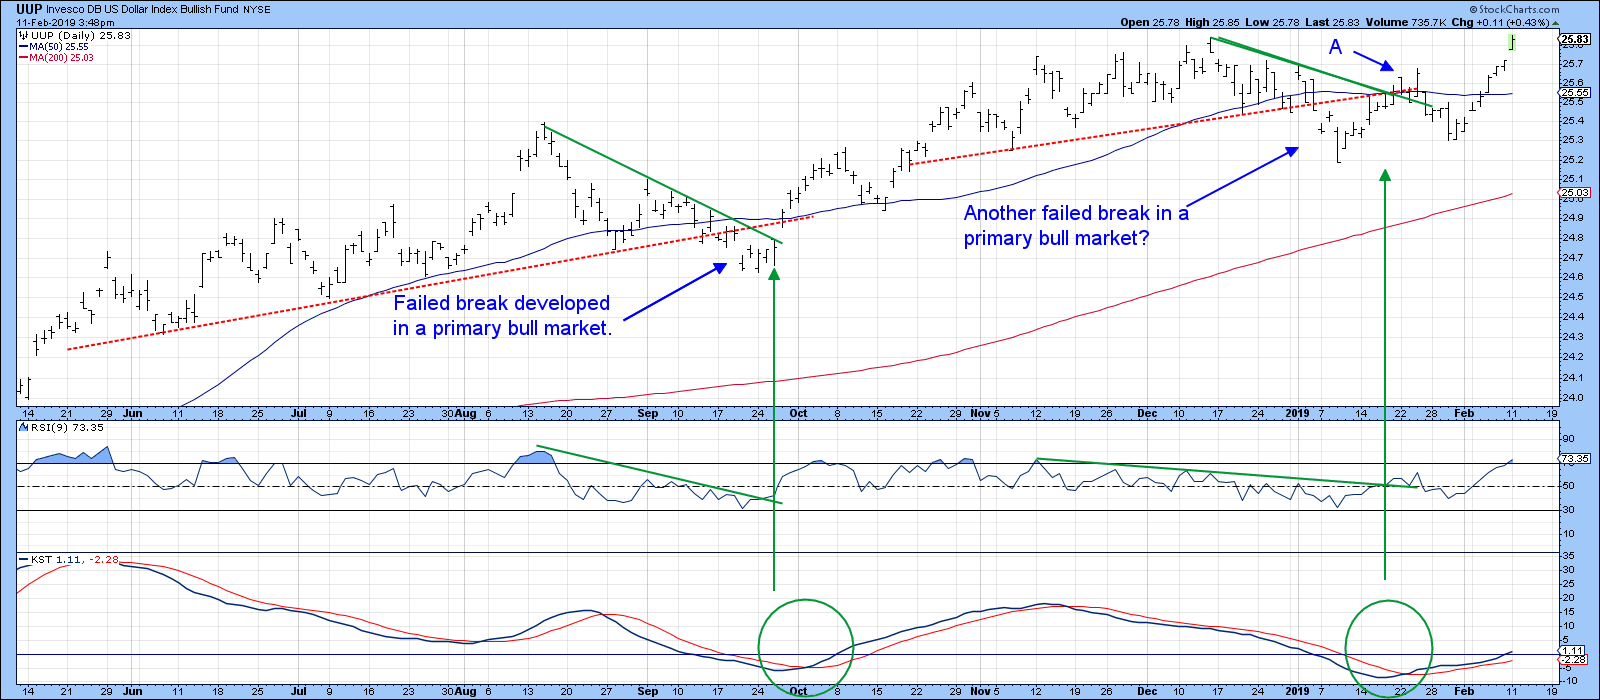
Dollar Index On The Verge Of A Breakout?
by Martin Pring,
President, Pring Research
* Dollar About to Break New Ground?
* Euro Starting to Break Down
* Swiss Franc at a Major Juncture Point
* The Fortunes of the Canadian, Australian and EM Currencies are Tied to Commodities
Dollar About to Break New Ground?
I last wrote about the dollar at the end of January, pointing out...
READ MORE
MEMBERS ONLY

WDAY Works Out

by Bruce Fraser,
Industry-leading "Wyckoffian"
In a September 2017 blog, we studied Workday, Inc. (WDAY). We looked at WDAY as an emerging ‘Campaign Stock’. These stocks have characteristics that could propel their uptrends for years to come. The Wyckoff Method offers the tools to identify these candidates. Chief among them is structural chart analysis and...
READ MORE