MEMBERS ONLY
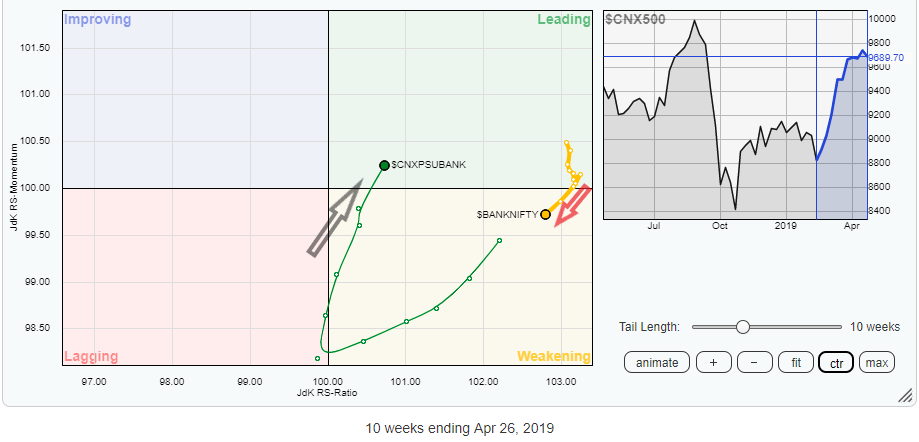
Are PSU Banks Likely to Outperform Private Banks? Answer Lies in the Relative Rotation Graph (RRG)

by Milan Vaishnav,
Founder and Technical Analyst, EquityResearch.asia and ChartWizard.ae
We head in to a month that is set to be among the most volatile and eventful as the market faces one of the most important domestic events – General Election Results.
The equity markets are currently hovering around their lifetime highs. On the one hand, they grapple with a not-so-favorable...
READ MORE
MEMBERS ONLY
Truncated Week May Offer Shallow But Volatile Moves; RRG Show These Sectors In Leading Quadrant
by Milan Vaishnav,
Founder and Technical Analyst, EquityResearch.asia and ChartWizard.ae
The past week remained as flat as it can get. In our previous weekly note, we had expected the week to remain volatile and the level of 11760 continuing to pose stiff resistance to any up-moves. Hewing very close to expected lines, the Indian equity markets remained volatile, headed nowhere,...
READ MORE
MEMBERS ONLY
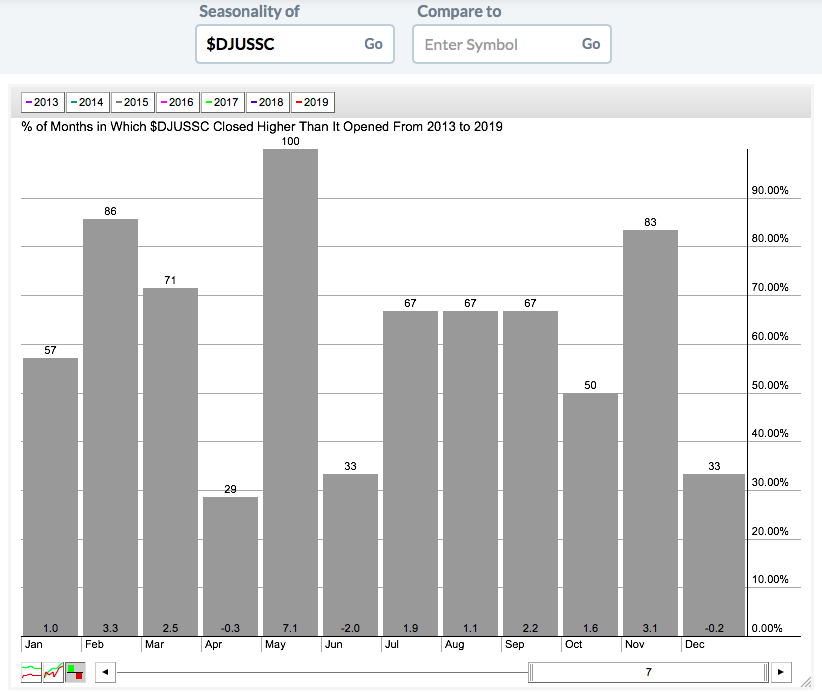
3 Reasons Why Semiconductors Are Poised To Lead

by Tom Bowley,
Chief Market Strategist, EarningsBeats.com
Okay, let's start with the short-term reason. Throughout much of this bull market, the month of May has been kind to semiconductors ($DJUSSC). In fact, the DJUSSC has advanced in each of the last 7 years during May. Check out this seasonal pattern:
Not only have semiconductors moved...
READ MORE
MEMBERS ONLY
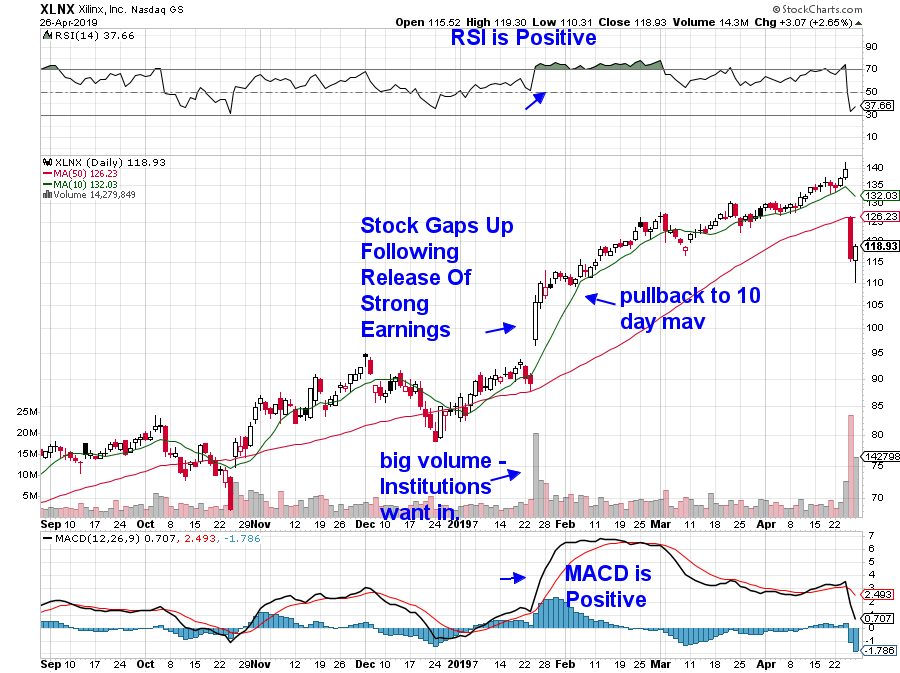
Successfully Trading Stocks After They Report Earnings

by Mary Ellen McGonagle,
President, MEM Investment Research
In my ChartWatchers article from two weeks ago, I provided insights into signals that your stock may be poised to report earnings above Wall Street estimates. Given that the markets are currently rewarding positively reporting companies with an average 2.1%+ boost in price* (and in many cases, much more)...
READ MORE
MEMBERS ONLY
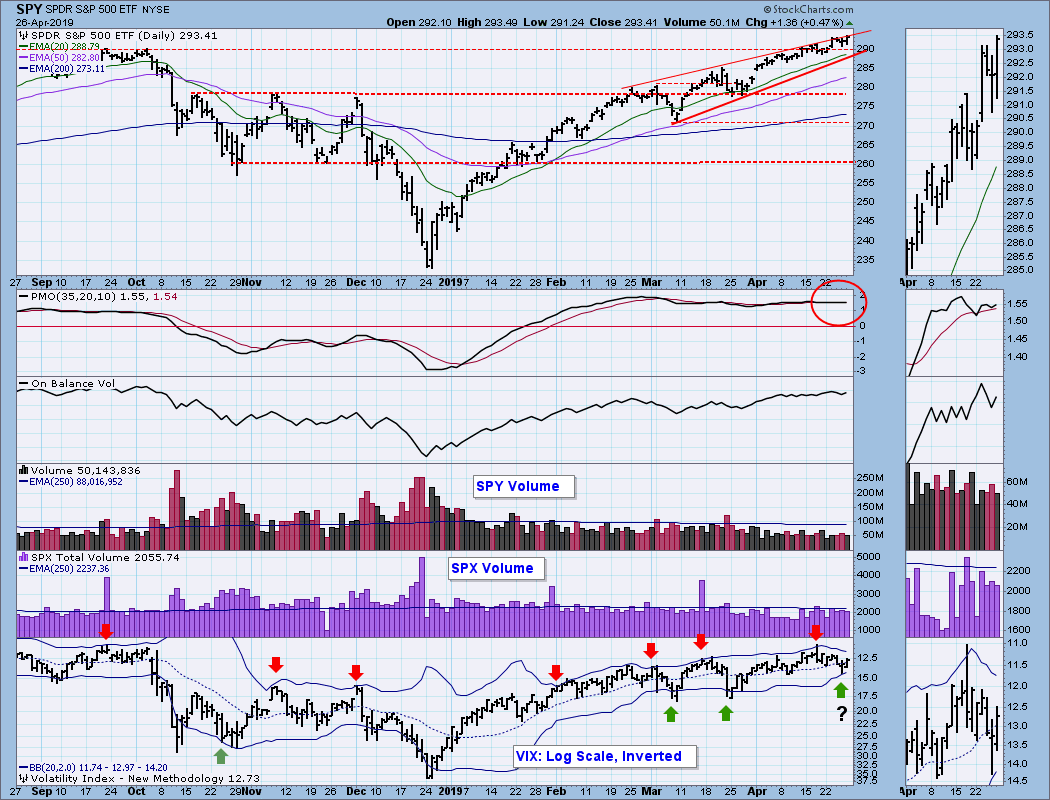
DP WEEKLY WRAP: Steady, Quiet Advance. What's Up?

by Carl Swenlin,
President and Founder, DecisionPoint.com
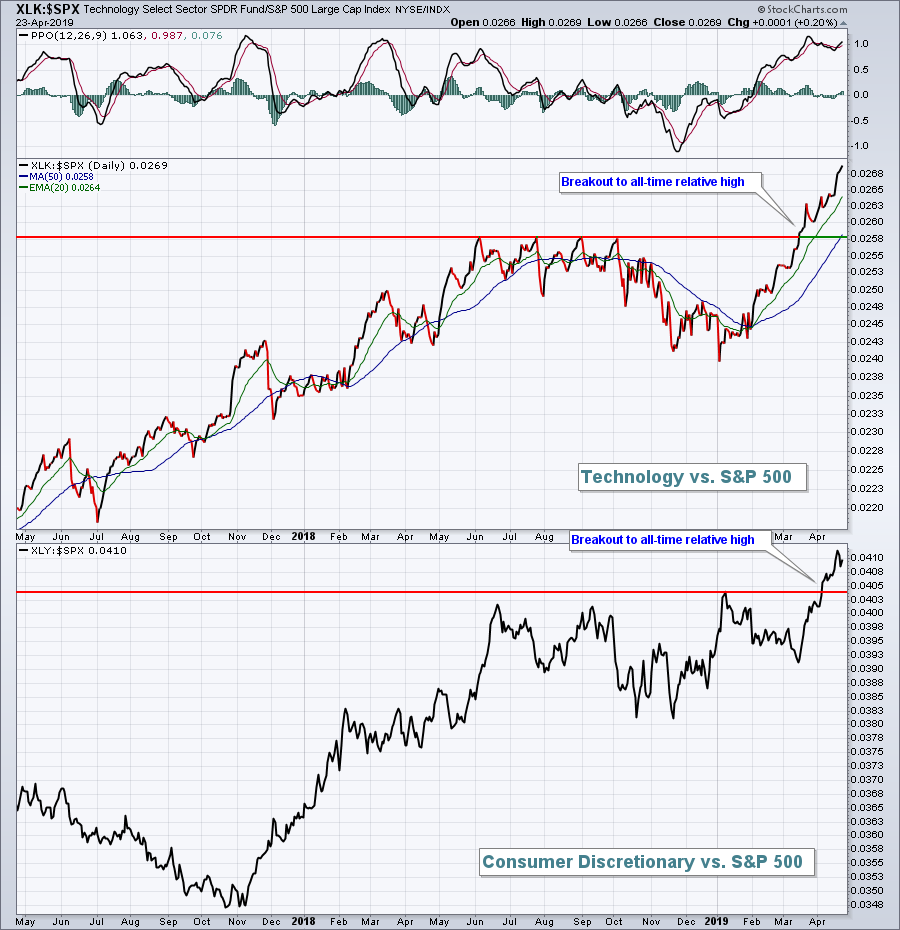
Since the market gapped up on the first of April, it has been quietly moving higher, making marginal new, all-time highs. Volume has been a bit thin, particularly for SPY. I think that thin volume is a reflection of the low volatility, and of investors happy to sit quietly, not...
READ MORE
MEMBERS ONLY
Five Trendlines You Should Be Watching

by David Keller,
President and Chief Strategist, Sierra Alpha Research
My process is built around simplicity. I am of the firm belief that investors, as well as the financial industry as a whole, tend to unnecessarily complicate things. As a result, we are led to believe that we need to track an endless number of data points to have a...
READ MORE
MEMBERS ONLY

SMALL CAPS MAY BE GETTING A LIFT FROM RISING FINANCIAL SHARES -- FINANCIALS ARE THE BIGGEST SECTOR IN THE RUSSELL 2000 -- AND HAVE BEEN THIS MONTH'S STRONGEST SECTOR -- WHILE HEALTHCARE WEAKNESS MAY BE HOLDING SMALL CAPS BACK

by John Murphy,
Chief Technical Analyst, StockCharts.com
APRIL REBOUND IN FINANCIALS IS GIVING A BIG BOOST TO SMALL CAPS... I've been writing about the recent upturn in financial stocks and, to a lesser extent, small cap stocks. I also suggested that a stronger dollar might be helping smaller stocks. That's because a rising...
READ MORE
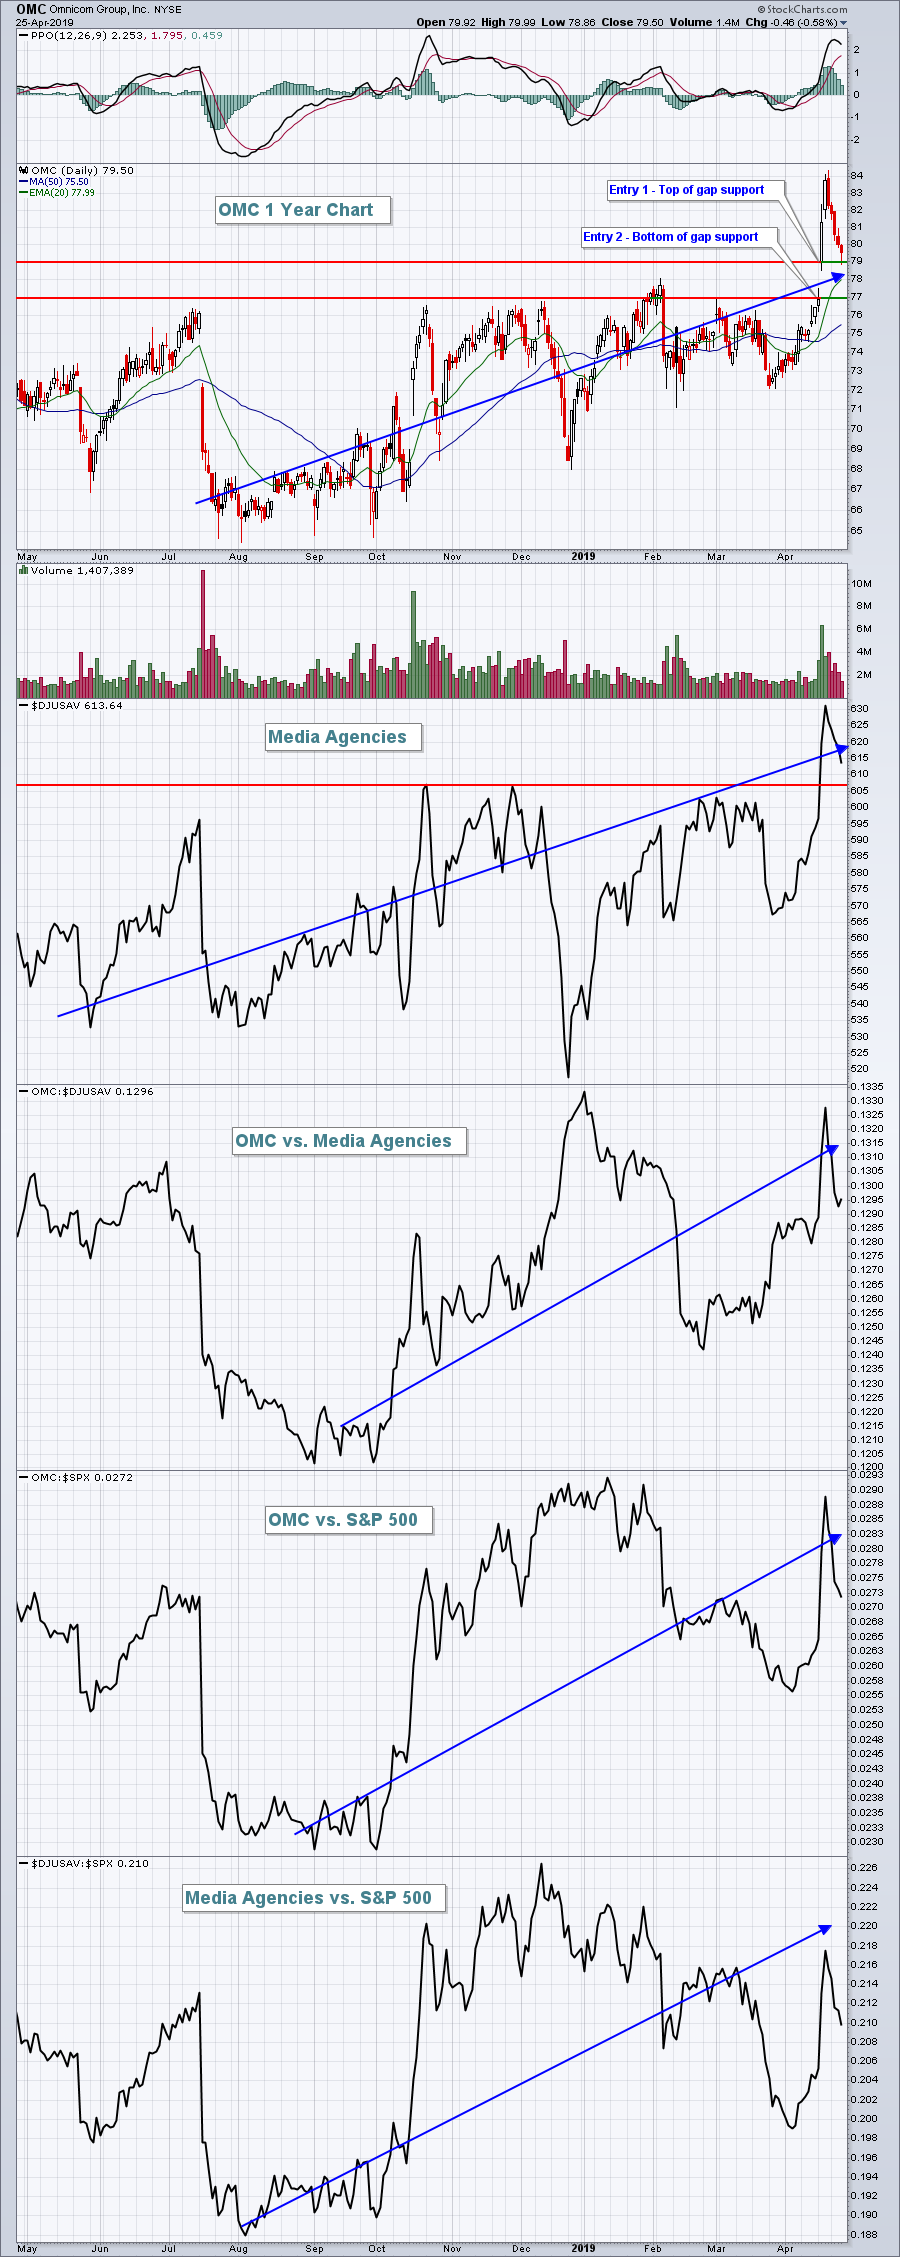
MEMBERS ONLY
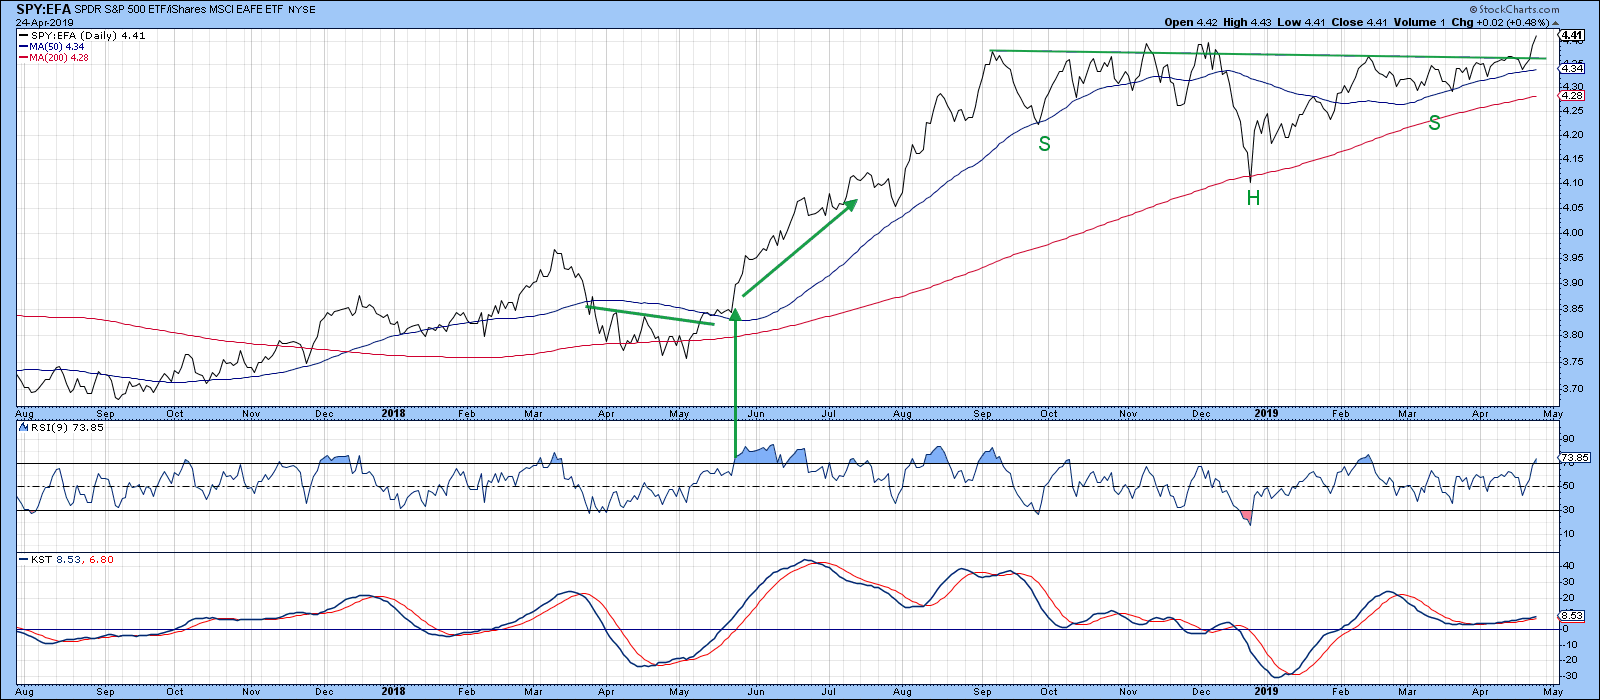
The SPY/EFA Ratio Completes an Inverse Head-and-Shoulders

by Martin Pring,
President, Pring Research
Editor's Note: This article was originally published in Martin Pring's Market Roundup on Wednesday, April 24th at 7:03pm ET.
Yesterday’s all-time new high in the S&P was well documented by the media, but what did not receive any attention was the fact...
READ MORE
MEMBERS ONLY
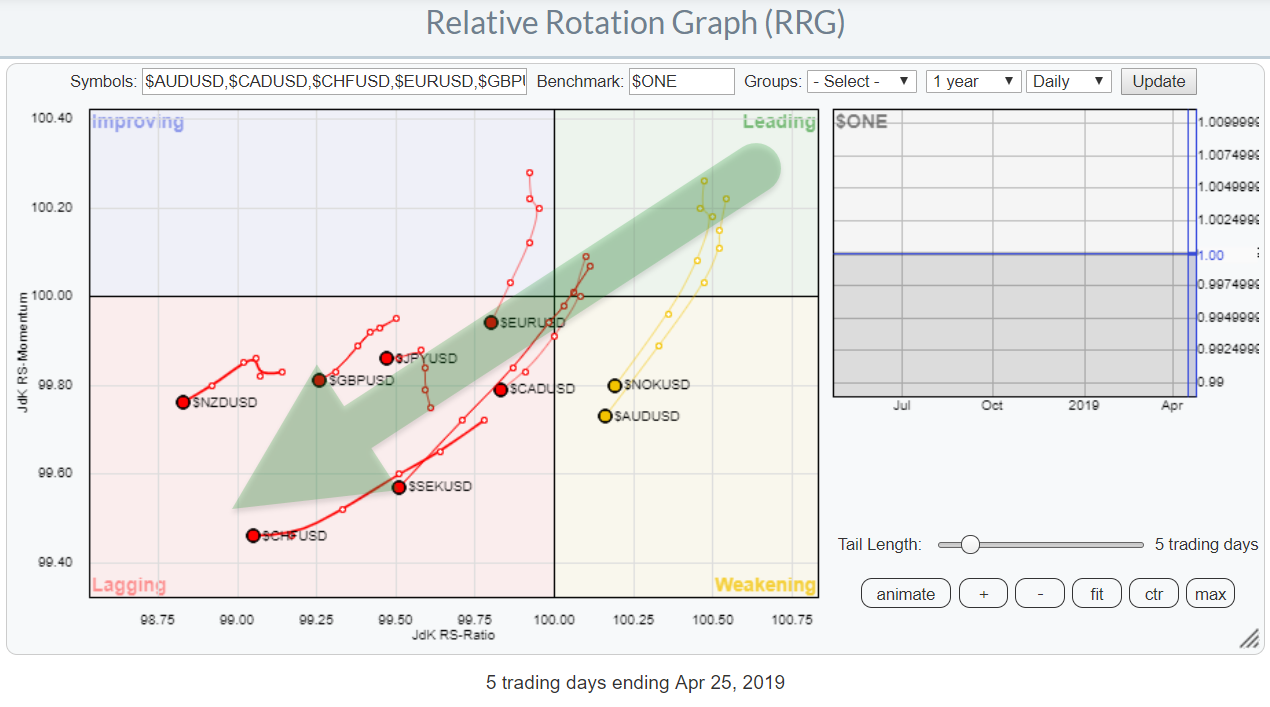
All Eyes On The Mighty Greenback! This Is How It Looks On A Relative Rotation Graph

by Julius de Kempenaer,
Senior Technical Analyst, StockCharts.com
A lot of eyeballs are watching the USD these days. Not surprisingly, as a lot (or most) people pay attention to the chart of the USD index ($USD), which compares the USD to a basket of other currencies. That chart now seems to be breaking out - to the UPside,...
READ MORE
MEMBERS ONLY

Weekly Market Review & Outlook - 3000 and then What?

by Arthur Hill,
Chief Technical Strategist, TrendInvestorPro.com
* S&P 500 Reaches 2018 Highs.
* Watch the Immediate Uptrend.
* IWM Holds Flag Breakout.
* Small-caps Breadth Indicators Net Bearish.
* %Above 200-day EMA Hits Milestone for XLF.
* Utilities Correct within Bigger Uptrend.
* Stock Performance During Earnings Season.
* ChartList Updates.
* About the Art's Charts ChartList.
... S&P 500...
READ MORE
MEMBERS ONLY
Structuring A Sound Trade And Avoiding The Relative Bear Market In Materials
by Tom Bowley,
Chief Market Strategist, EarningsBeats.com
Market Recap for Thursday, April 25, 2019
Strong earnings from Microsoft (MSFT, +3.31%) and Facebook (FB, +5.85%) lifted the NASDAQ to gains on Thursday, while broader market bearishness carried the other major indices to losses. 3M Co (MMM, -12.95%) was a disaster on the Dow Jones, which...
READ MORE
MEMBERS ONLY

MMM AND UPS WEIGH INDUSTRIALS DOWN -- AMERICAN EXPRESS BREAKS OUT TO NEW RECORD -- BANK INDEX TRIES TO CLEAR ITS 200-DAY LINE -- S&P 500 CONTINUES TO CHALLENGE ITS 2018 HIGH
by John Murphy,
Chief Technical Analyst, StockCharts.com
INDUSTRIAL SPDR GAPS LOWER ... In a mixed market day, industrials are the weakest sector. Chart 1 shows the Industrial Sector SPDR (XLI) gapping lower today. That hasn't caused any serious chart damage with the XLI still trading well above its blue 50-day average. It is worth noting, however,...
READ MORE
MEMBERS ONLY
Industrials Set To Record All-Time Highs
by Tom Bowley,
Chief Market Strategist, EarningsBeats.com
Note
If you enjoy my daily blog articles, please subscribe (for FREE!) below. Simply scroll to the bottom of this article, type in your email address in the space provided and click the green "Subscribe" button. Once subscribed, my articles will be sent directly to the email address...
READ MORE
MEMBERS ONLY
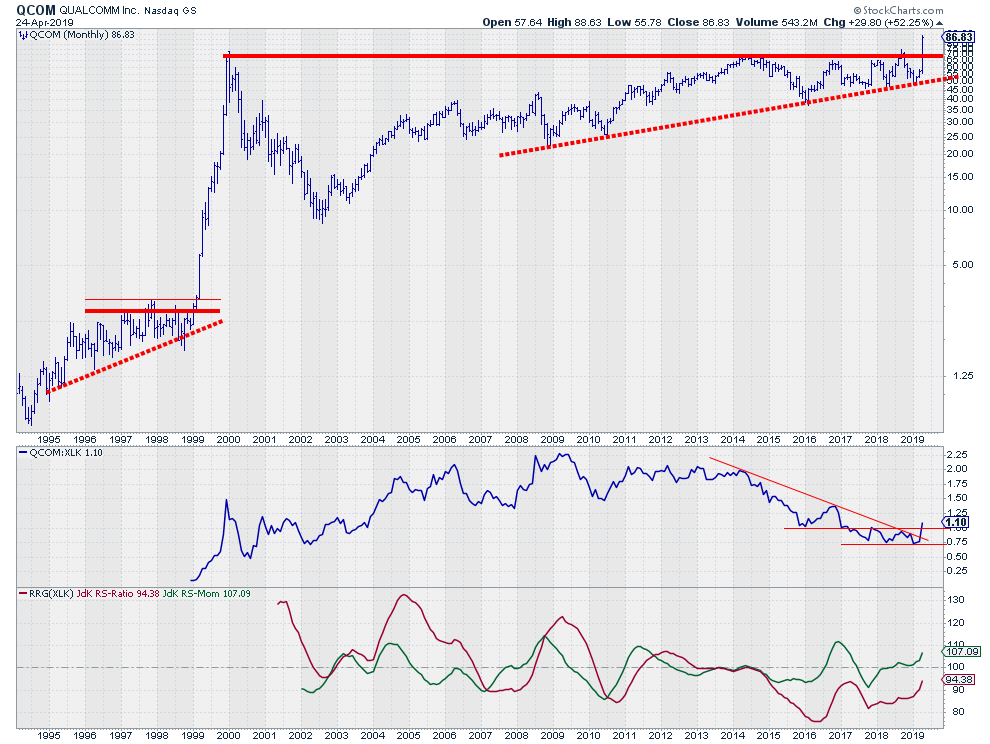
Party Like It's 1999 for QCOM
by Julius de Kempenaer,
Senior Technical Analyst, StockCharts.com
Technology is doing very well on the Relative Rotation Graph for US sectors, with a rotation that is well inside the leading quadrant and pushing further into it. If we shift gears and look specifically at the RRG for the technology sector (against XLK), we can see there is one...
READ MORE
MEMBERS ONLY

US Equities Break Out Against The Rest Of The World
by Martin Pring,
President, Pring Research
* The SPY/EFA Ratio Completes an Inverse Head-and-Shoulders
* SPY/EFA Breakout also Bullish for the Dollar
* The Euro, Swiss Franc and Yen
* China Bucks the Flow
The SPY/EFA Ratio Completes an Inverse Head-and-Shoulders
Yesterday’s all-time new high in the S&P was well documented by the media,...
READ MORE
MEMBERS ONLY

DP Alert: Volume Indicators Wave a Caution Flag

by Erin Swenlin,
Vice President, DecisionPoint.com
Naturally, right after I wrote a very bullish article, the market decided to humble me somewhat with a reversal today. Yesterday, I mentioned that all-time high price resistance is generally very difficult to break above decisively (3+%). After publishing, though, Carl pointed out to me that volume on yesterday'...
READ MORE
MEMBERS ONLY
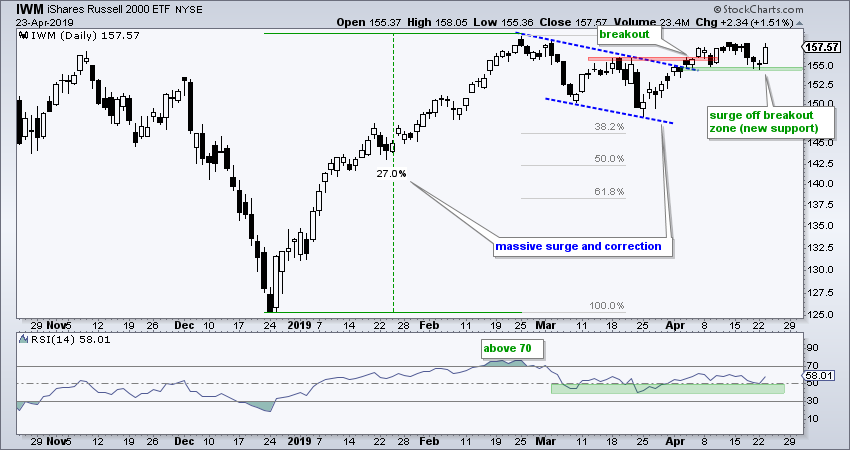
Can IWM Follow Through on Bounce? - ChartList Update
by Arthur Hill,
Chief Technical Strategist, TrendInvestorPro.com
* Cup-with-handle Taking Shape in IWM.
* Bond ETFs Reach Potential Reversal Zone.
* Art's Charts ChartList Update (SMTC added).
Art's Charts featured IWM on Monday with a bullish chart and a lagging price. Even though IWM remains well below its September highs, the ETF broke out of a...
READ MORE
MEMBERS ONLY
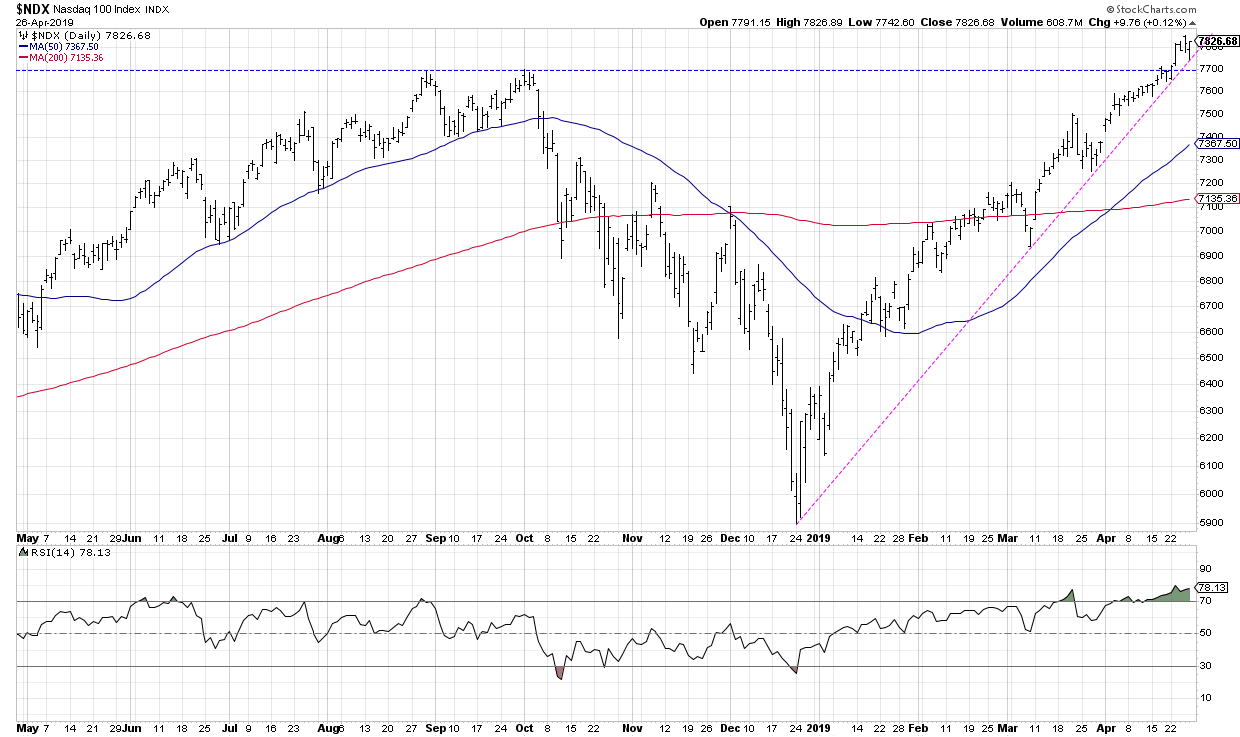
NASDAQ Breaks Out, Sets New All-Time High
by Tom Bowley,
Chief Market Strategist, EarningsBeats.com
Market Recap for Tuesday, April 23, 2019
The small cap Russell 2000 led our major indices higher, gaining 1.61%, but the day clearly belonged to the NASDAQ, which not only climbed 1.32%, but broke to new all-time intraday and closing highs. The NASDAQ pierced the 8109.69 level...
READ MORE
MEMBERS ONLY

COUP Flies the Flag after Big Gain
by Arthur Hill,
Chief Technical Strategist, TrendInvestorPro.com
Coupa Software is one of the best performing stocks in 2019 with a 50% advance year-to-date. In addition, the stock is up over 80% from its late December low. Too far too fast you might say? Perhaps, but the stock digested its gains with a consolidation the last two months...
READ MORE
MEMBERS ONLY
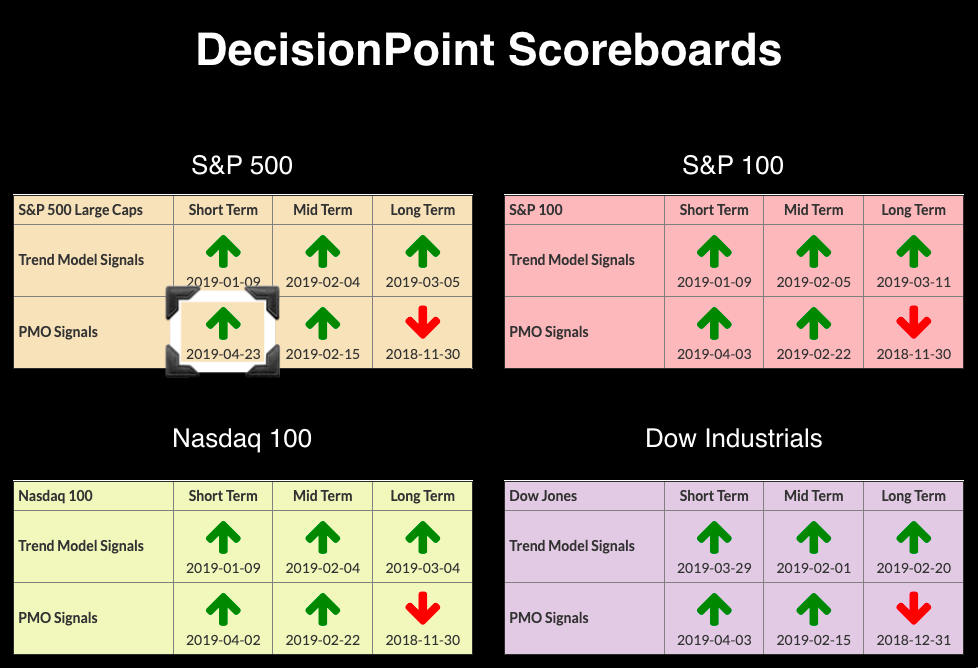
SPX Whipsaw Signals on Buying Initiation - PMO SELL Yesterday, PMO BUY Today
by Erin Swenlin,
Vice President, DecisionPoint.com
I had a feeling we would see a whipsaw right after I switched the SPX Scoreboard to a Price Momentum Oscillator (PMO) SELL Signal. The margin was incredibly thin between the PMO and its signal line. With today's rally and the market making its way to a new...
READ MORE
MEMBERS ONLY

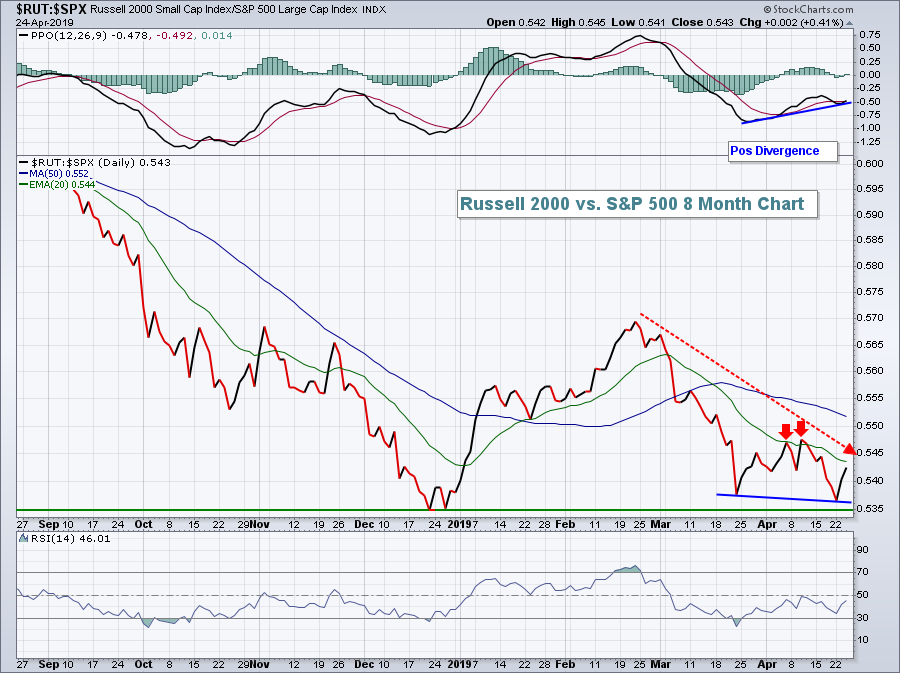
RUSSELL 2000 IS TRADING OVER ITS 200-DAY LINE -- A STRONGER DOLLAR MAY BE HELPING -- MAJOR U.S. STOCK INDEXES NEAR THEIR 2018 HIGHS -- CORPORATE BOND ISHARES ARE ALREADY IN NEW HIGH GROUND
by John Murphy,
Chief Technical Analyst, StockCharts.com
RUSSELL 2000 TRADES ABOVE ITS 200-DAY AVERAGE... In the midst of a strong market day, small caps are showing a bigger percentage gain than large caps. Chart 1 shows the Russell 2000 Small Cap Index ($RUT) trading above its (red) 200-day moving average today. The RUT still needs to clear...
READ MORE
MEMBERS ONLY
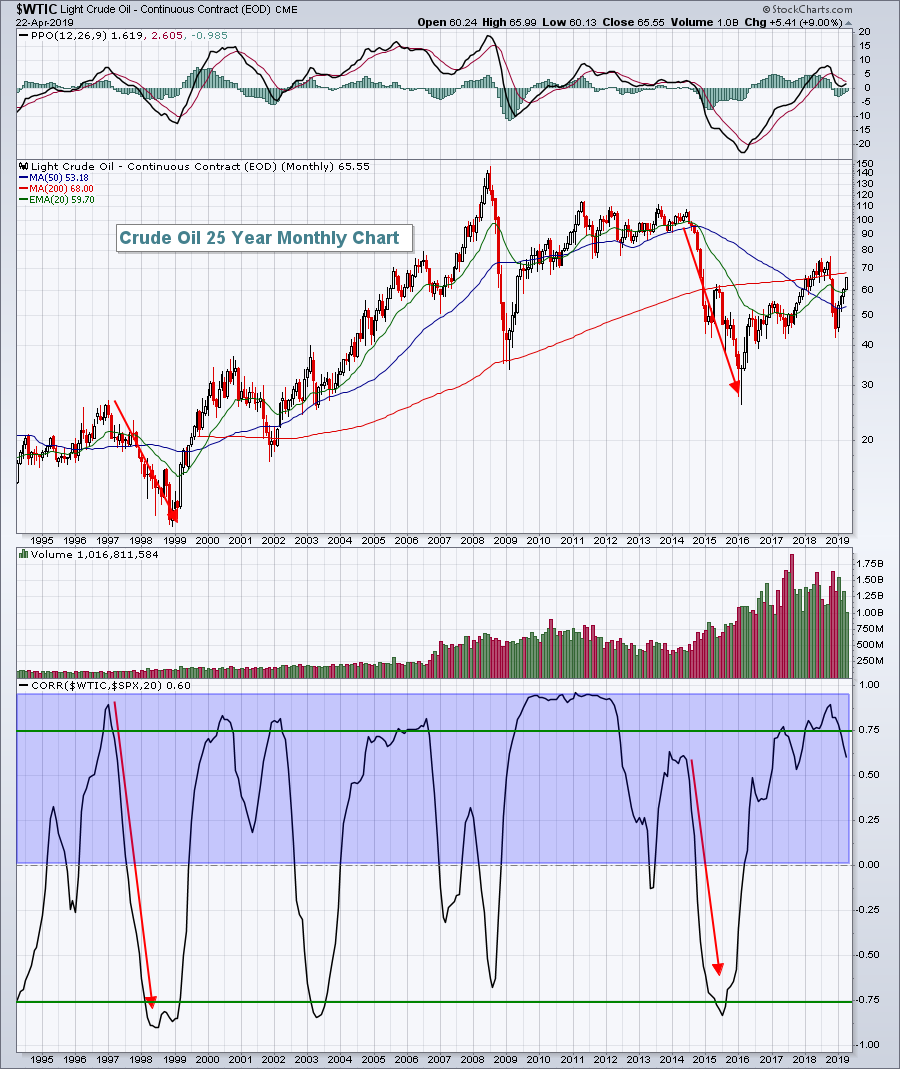
Crude Oil Surge Sends Energy Shares Higher
by Tom Bowley,
Chief Market Strategist, EarningsBeats.com
Market Recap for Monday, April 22, 2019
I'm sure you've noticed it at the pump lately. Gas prices are rising. Yesterday, crude oil prices ($WTIC, +2.31%) jumped to their highest level of 2019 and closed above $65 per barrel for the first time since breaking...
READ MORE
MEMBERS ONLY
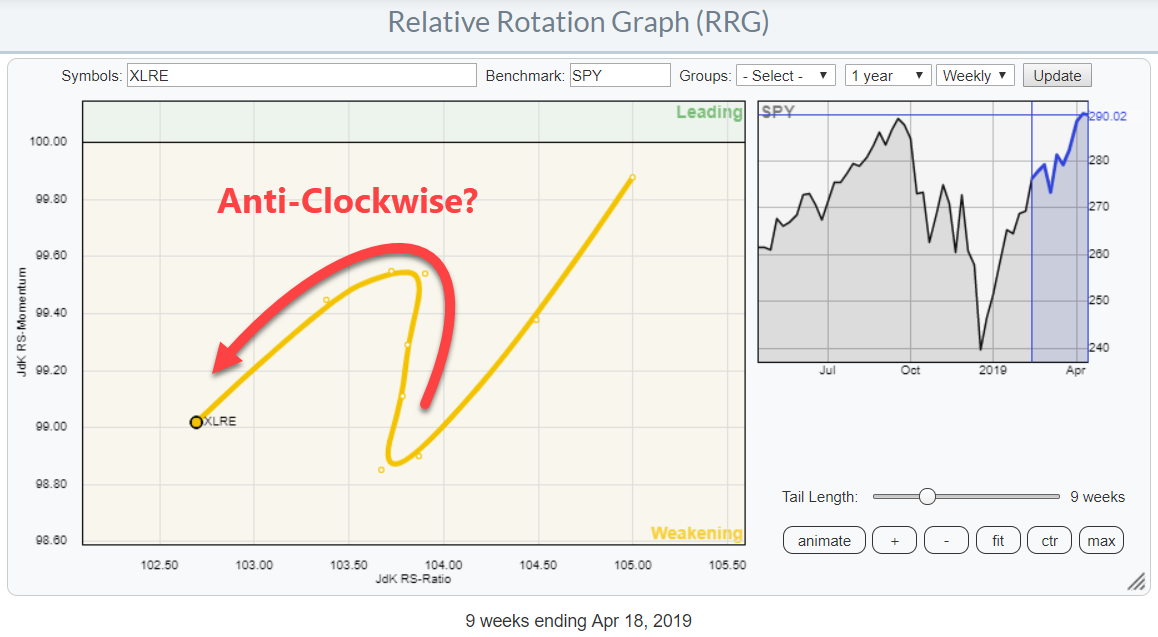
"Hooks" And One Sided Rotations On Relative Rotation Graphs
by Julius de Kempenaer,
Senior Technical Analyst, StockCharts.com
Last Thursday, 18 April, was the third Thursday of the month, my regularly scheduled guest appearance on MarketWatchers LIVE. As Tom Bowley was enjoying a well-deserved day off, it was just me and Erin on duty.
It wasn't my first time co-hosting, but every time I fill in...
READ MORE
MEMBERS ONLY

Volatility and The World's Greatest Investor

by Greg Morris,
Veteran Technical Analyst, Investor, and Author
I've written before about the cost of volatility, both financially and emotionally, and in light of the volatility we saw in 2018, now is a good time to revisit that issue (while it is not an issue). In 2018, after many sizable down moves, then prices bounced up...
READ MORE
MEMBERS ONLY
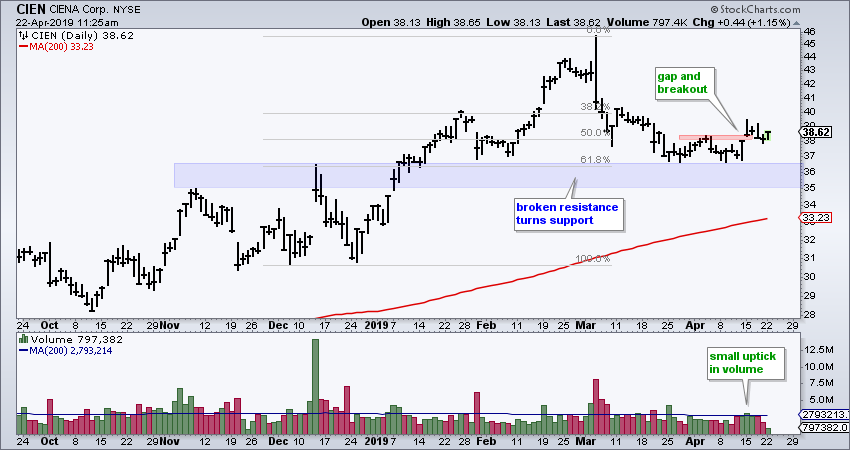
Ciena Hits Potential Reversal Zone
by Arthur Hill,
Chief Technical Strategist, TrendInvestorPro.com
The ideal scenario for traders is to buy after a pullback for a good reward-to-risk ratio. When the long-term trend is up, I look for indications of support and signs that an upturn is in the making. The chart for Ciena sports a classic setup with a confluence of indicators...
READ MORE
MEMBERS ONLY
Small-caps Lag, but Large-caps Keep Market Bullish - ChartList Update
by Arthur Hill,
Chief Technical Strategist, TrendInvestorPro.com
* Small-caps Continue to Lag.
* S&P 500 Nears All Time High.
* IWM Tests Breakout Zone.
* Index Breadth Table Update.
* Industrials and Finance Come to Life.
* Art's Charts ChartList Update.
Back in the Saddle
After a vacation and market hiatus, today's commentary will review the broader...
READ MORE
MEMBERS ONLY
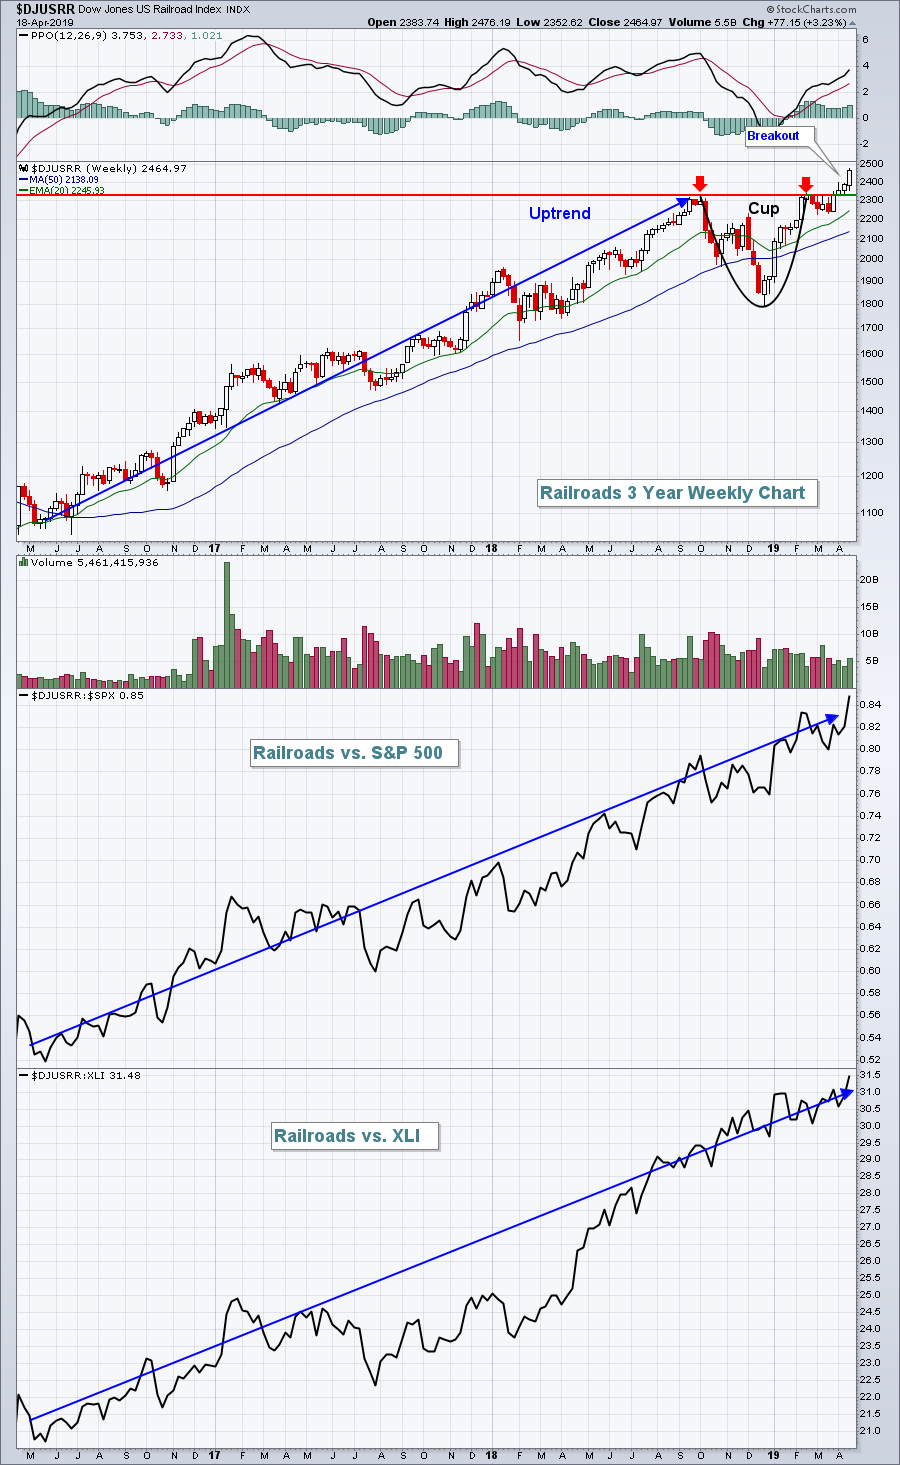
An Analysis Of Financials And Why We're Going Higher
by Tom Bowley,
Chief Market Strategist, EarningsBeats.com
Market Recap for Thursday, April 18, 2019
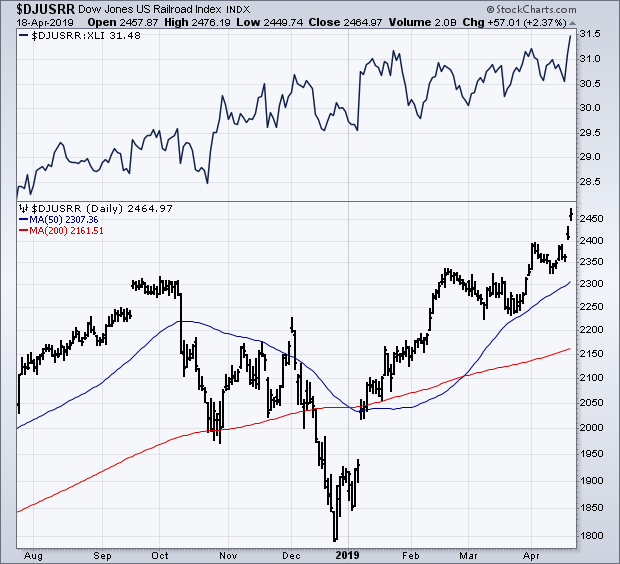
Railroads ($DJUSRR, +2.37%) were led higher by Union Pacific's (UNP, +4.36%) strong quarterly earnings report and outlook. The DJUSRR has been a leader among industrials (XLI, +1.15%) for more than three years and that trend is easily continuing...
READ MORE
MEMBERS ONLY

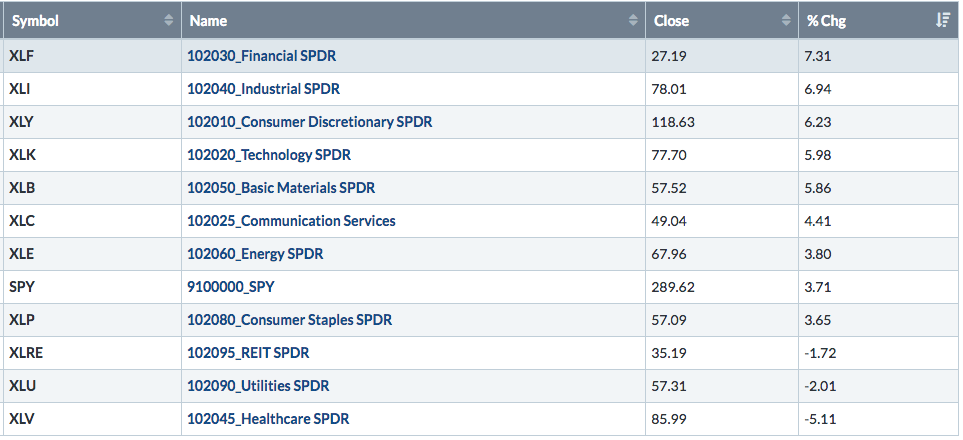
Health Care Crisis

by Bruce Fraser,
Industry-leading "Wyckoffian"
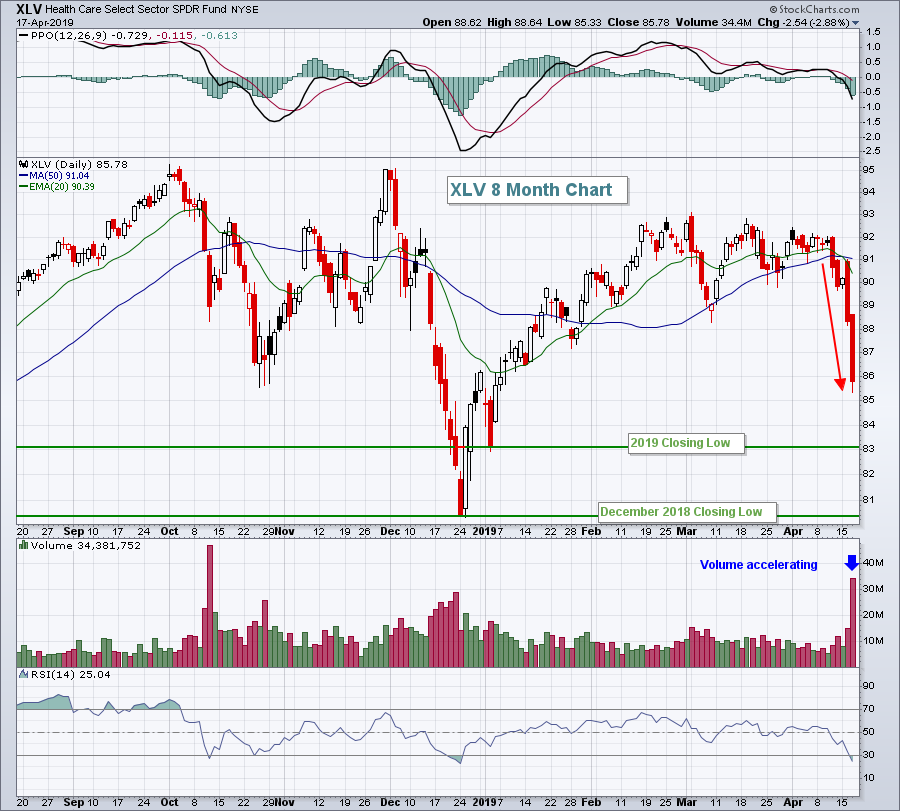
The Health Care Sector (XLV) took a tumble this past week. In 2018 XLV was among the best leadership sectors of the stock market. Rotation is expected between sectors, industry groups and stocks throughout the business cycle. Were there technical clues that warned of the seemingly sudden weakness in the...
READ MORE
MEMBERS ONLY
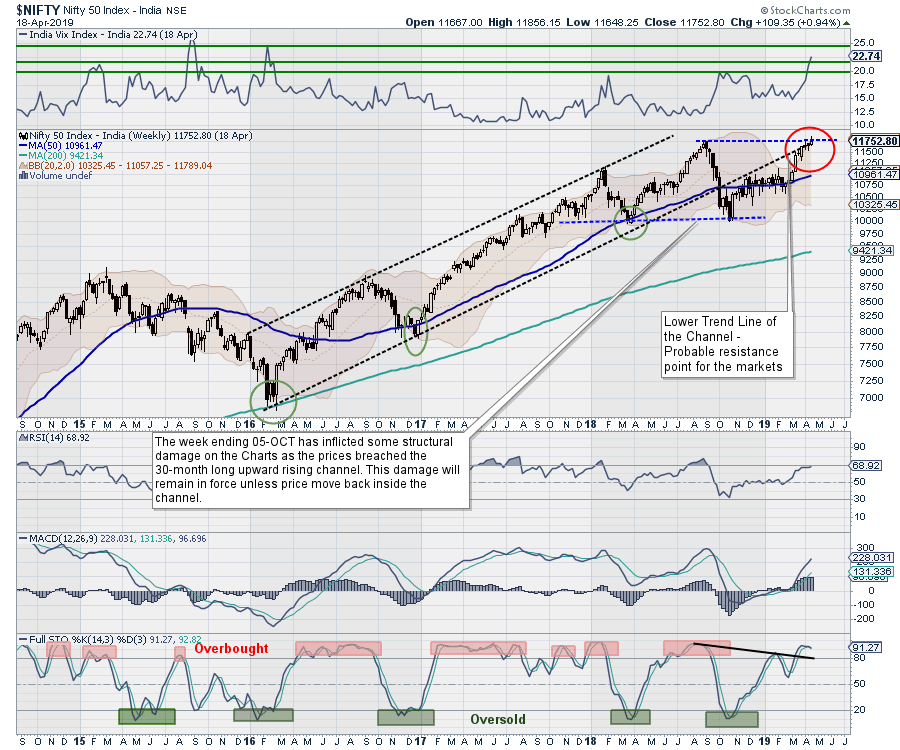
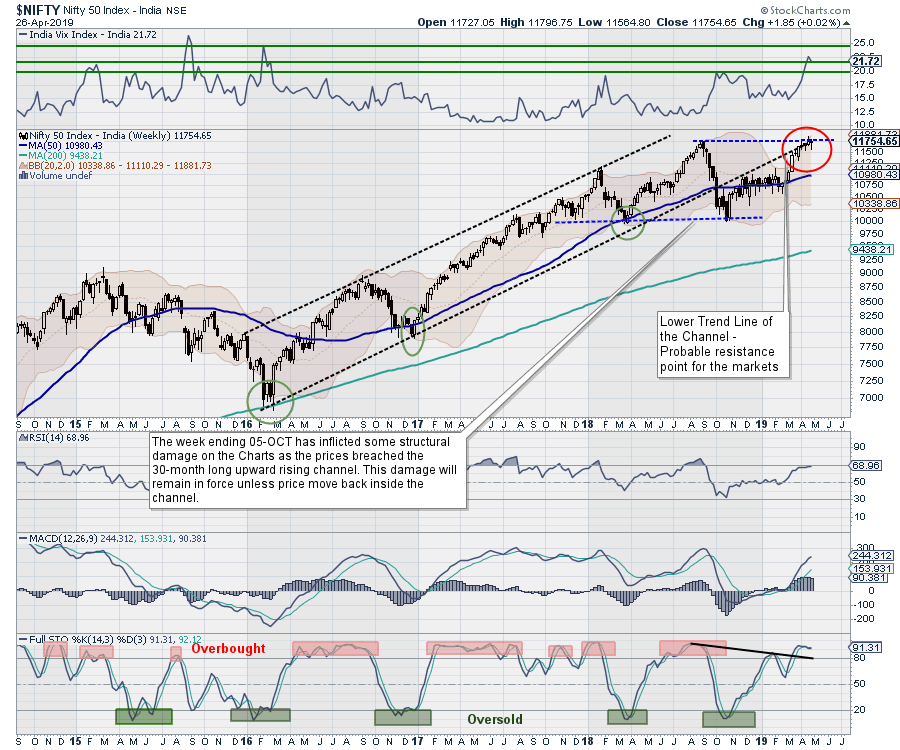
Week Ahead: Odds Stacked Against A Sustainable Breakout; 11760 Still Remains Important To Watch
by Milan Vaishnav,
Founder and Technical Analyst, EquityResearch.asia and ChartWizard.ae
The past week was quite eventful for the Indian equity markets. The short 3-day working week saw the benchmark index NIFTY50 marking a fresh high and attempting a breakout. Along with that, it also saw the NIFTY not confirming this breakout, slipping below the all-important 11760 mark once again. This...
READ MORE
MEMBERS ONLY

Five 5G Technology Stocks to Ponder
by Erin Swenlin,
Vice President, DecisionPoint.com
5G is the next generation of mobile broadband and will eventually replace (or augment) your 4G LTE connection. With 5G, we should see exponentially faster download and upload speeds. All eyes are now turning toward the companies that will help launch the advent of this exciting technology. I picked out...
READ MORE
MEMBERS ONLY

How to Approach Investing Like Pro Sports and Make the Playoffs! - ChartPack Update #23 (Q1, 2019)

by Gatis Roze,
Author, "Tensile Trading"
Pick the pro league of your choice. You can have the most expensive talent on one team, but without the right organization, routines and strategy, you won’t make the playoffs.(Presently, for example. you might consider the NBA’s Los Angeles Lakers with one LeBron James and friends).
Something...
READ MORE
MEMBERS ONLY
Profiting from Companies that Beat Earnings Expectations

by John Hopkins,
President and Co-founder, EarningsBeats.com
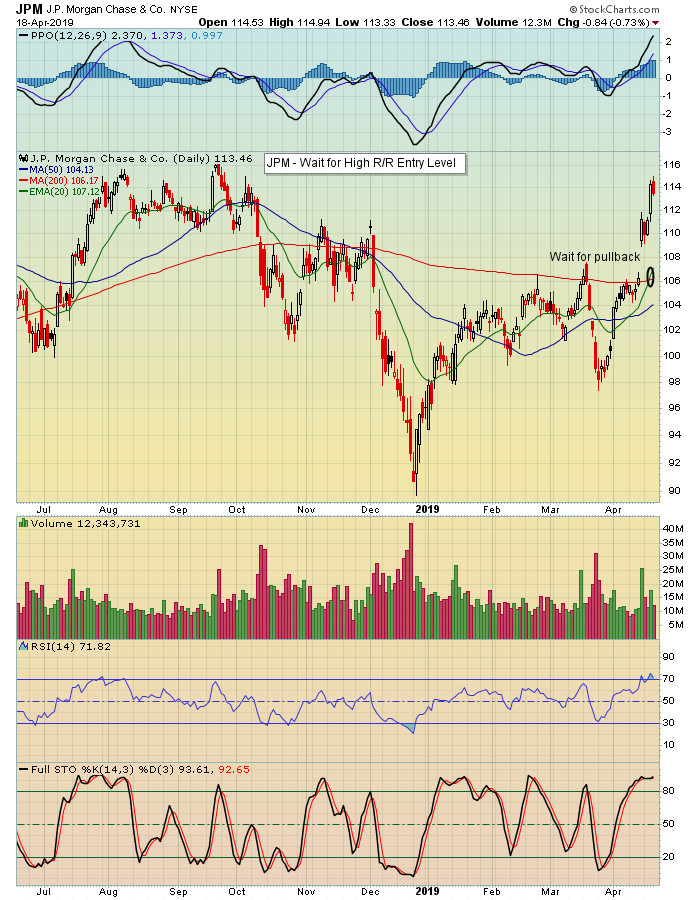
Earnings season is off and running and already some companies that beat expectations could set up as high reward-to-risk trades. JP Morgan (JPM) is a perfect example of a company that reported stronger than expected numbers; you can see below the positive response from the market below.
In the week...
READ MORE
MEMBERS ONLY
Railroad Stocks Lead the Transports and Industrial Sector Higher
by John Murphy,
Chief Technical Analyst, StockCharts.com
Editor's Note: This article was originally published in John Murphy's Market Message on Friday, April 19th at 10:21am ET.
Two stock groups did better than the rest of the market this week. Transportation stocks had another strong week. As did the Industrial Sector SPDR (XLI)...
READ MORE
MEMBERS ONLY

RAILROAD STOCKS LEAD THE TRANSPORTS AND INDUSTRIAL SECTOR HIGHER -- WIDENING SPREAD BETWEEN 10-YEAR TREASURY AND GERMAN YIELD FAVORS THE DOLLAR -- A RISING DOLLAR IS HURTING GOLD MORE THAN COPPER -- A RISING COPPER/GOLD RATIO IS A SIGN OF CONFIDENCE
by John Murphy,
Chief Technical Analyst, StockCharts.com
RAILROAD STOCKS HAVE BECOME MARKET LEADERS... Two stock groups did better than the rest of the market this week. Transportation stocks had another strong week. As did the Industrial Sector SPDR (XLI) which was the week's strongest sector. Both have one group to thank for their strong performance....
READ MORE
MEMBERS ONLY
DP WEEKLY WRAP: New All-Time Highs, or Not?
by Carl Swenlin,
President and Founder, DecisionPoint.com
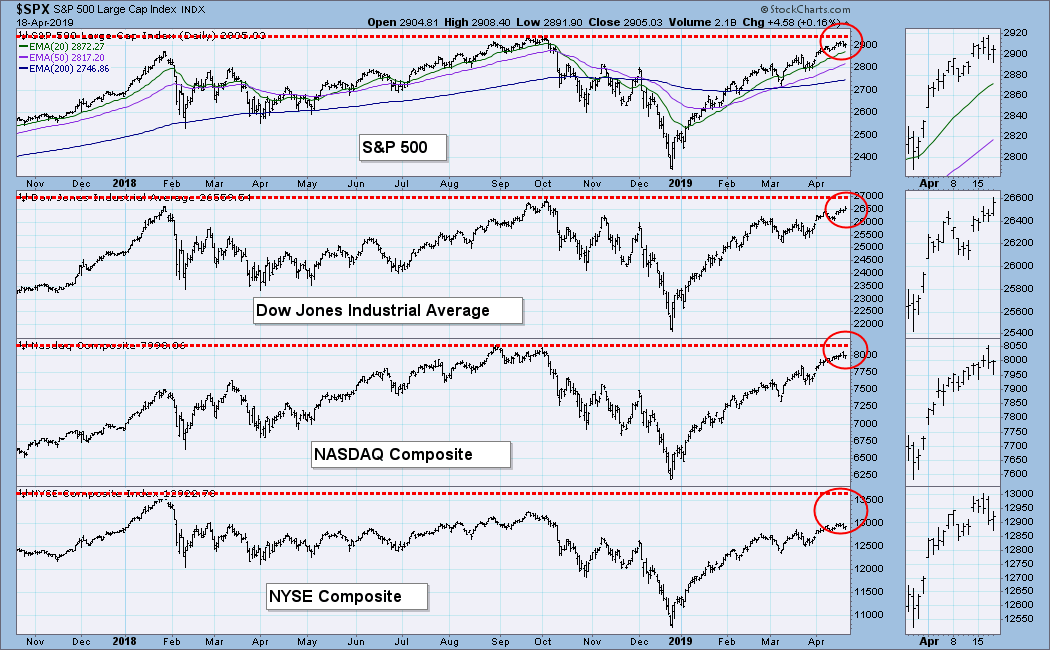
As we can see on the chart below, none of the major market indexes have exceeded their previous all-time highs. So why are we having this discussion? The point is that price history for traditional market indexes is not adjusted for dividends, so they do not reflect a true total...
READ MORE
MEMBERS ONLY

BANKS, ENERGY, AND SMALL CAPS TEST 200-DAY LINES -- DOLLAR HITS TWO-YEAR HIGH AS EURO WEAKENS -- THE RISING DOLLAR IS PUSHING GOLD MINERS LOWER -- WISDOM TREE EUROPE HEDGED EQUITY FUND COMPENSATES FOR WEAKER EURO
by John Murphy,
Chief Technical Analyst, StockCharts.com
BANKS, ENERGY, AND SMALL CAPS STRUGGLE WITH THEIR 200-DAY LINES... Three stock groups are still struggling to clear their 200-day lines. Chart 1 shows the KBW Bank Index sitting just below its red line. Lower bond yields today may be holding it back. But the Financial Sector SPDR (XLF) has...
READ MORE
MEMBERS ONLY
Clothing Stocks Gearing Up For Q2
by Tom Bowley,
Chief Market Strategist, EarningsBeats.com
Market Recap for Wednesday, April 17, 2019
We saw mixed trading on Wednesday with the benchmark S&P 500 falling 0.23% to end the session at 2900, still roughly 1.5% beneath the all-time high set in 2018. Technology (XLK, +0.56%) and consumer staples (XLP, +0.50)...
READ MORE
MEMBERS ONLY
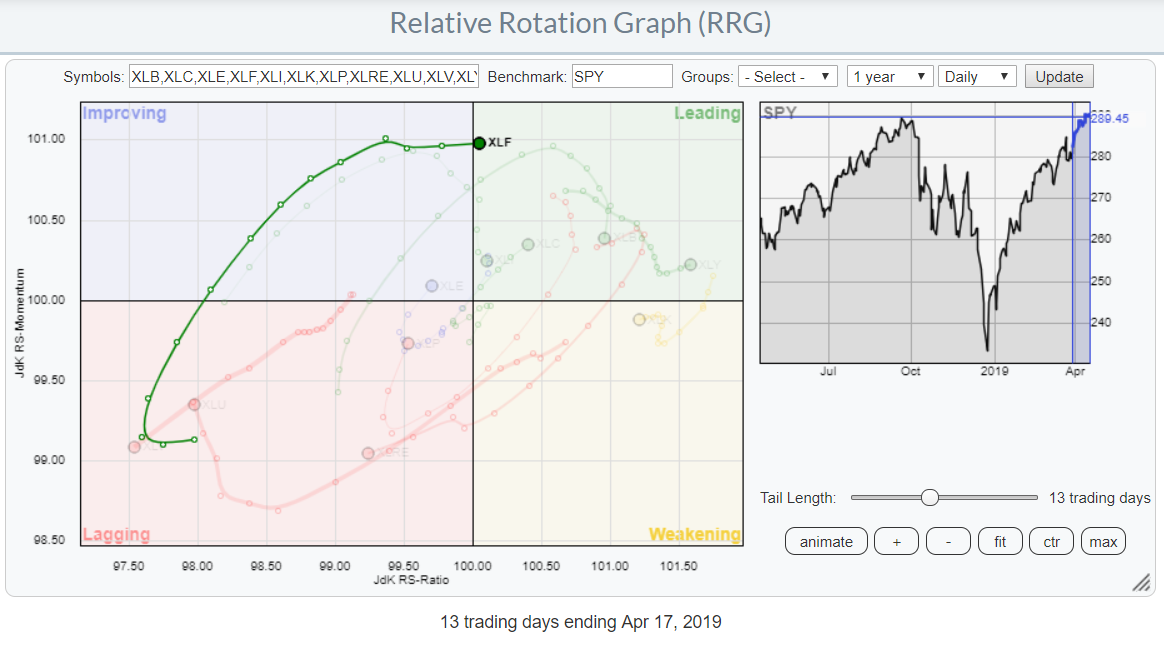
Financials Made It Into The Leading Quadrant, Now What?
by Julius de Kempenaer,
Senior Technical Analyst, StockCharts.com
At yesterday's close, the Financials sector (XLF) crossed over into the leading quadrant on the daily Relative Rotation Graph.
The tail of the sector started to curl upward inside the lagging quadrant roughly two weeks ago, before then proceeding to travel higher on both the Jdk RS-Ratio and...
READ MORE
MEMBERS ONLY
DP Alert: Buying Exhaustion Alongside a Broadening Pattern - XLV IT Neutral Signal
by Erin Swenlin,
Vice President, DecisionPoint.com
At this point in the week, the SPX is down about 0.23%. I suspect there will be more downside to endure going into the last half of the week. We don't talk about broadening patterns too much, but, in the very short-term, those are what I'...
READ MORE
MEMBERS ONLY

Using Breadth Indicators to Weigh the Evidence
by Arthur Hill,
Chief Technical Strategist, TrendInvestorPro.com
This article will provide links and symbols for some of the charts used in the On Trend episode focusing on breadth indicators (Using Breadth Indicators to Weigh the Evidence). Episode details are shown below and you can watch a recording on our Youtube channel. The idea behind these indicators is...
READ MORE