MEMBERS ONLY

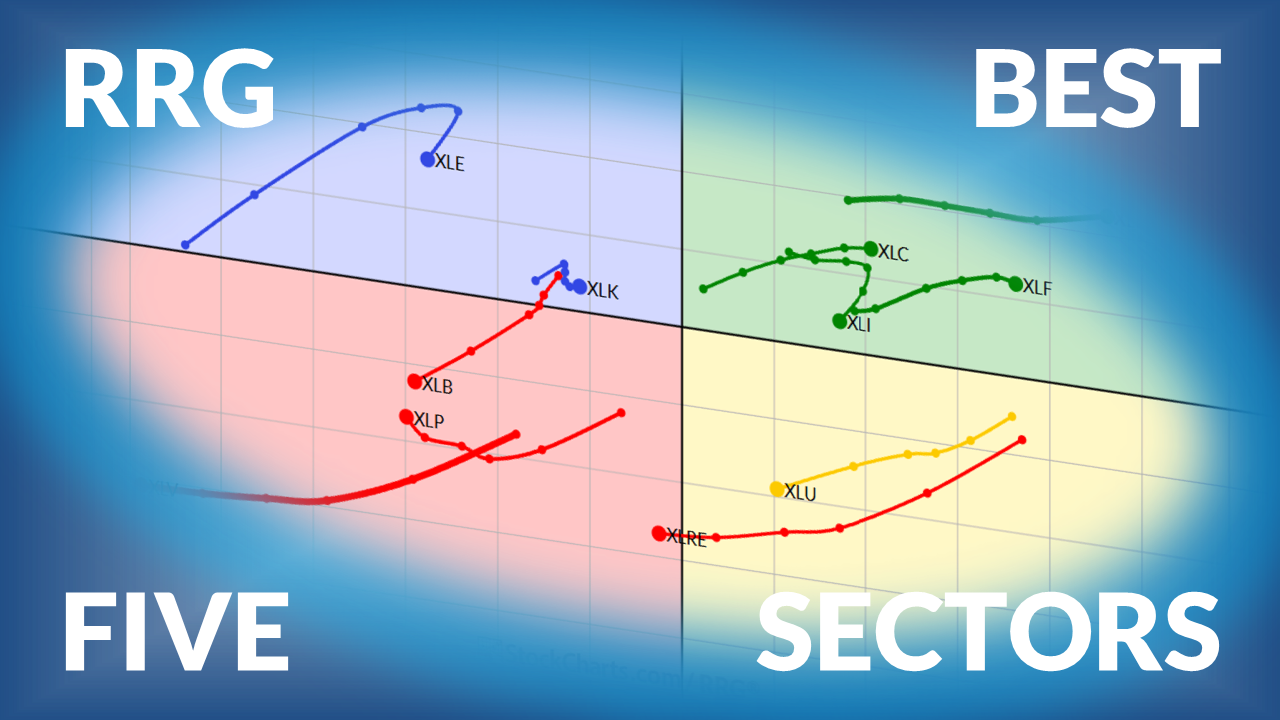
The Best Five Sectors This Week #56

Julius presents his weekly sector rotation update based on Relative Rotation Graphs.... READ MORE
Julius presents his weekly sector rotation update based on Relative Rotation Graphs.... READ MORE


Oil prices have surged and hit close to $120 per barrel. While gasoline futures indicate a $4 national average, technical signals suggest gasoline prices may be close to a short-term peak.... READ MORE


Nifty has slipped back and closed exactly at its 100-week moving average, which has historically been a support level. Is it at risk for more downside?... READ MORE

It was a challenging week. Yes, the stock market had to cope with rising geopolitical tensions in the Middle East. But for many in the technical analysis community, the week carried a heavier weight. We learned of the passing of John Murphy, one of the most respected and influential teachers... READ MORE


As you may have already heard, StockCharts' former Chief Technical Analyst, and a personal friend, passed away last month. It’s hard to put into words what John J. Murphy meant to me, to StockCharts, and to the entire technical analysis community. John was one of the most influential... READ MORE


Rising oil prices and geopolitical tensions pushed volatility higher as the S&P 500 tested key support levels. Mary Ellen McGonagle analyzes what the charts reveal about inflation fears, sector weakness, and the few pockets of strength emerging in this volatile market.... READ MORE

Rising oil prices are increasing investor fear. We're seeing a broad risk-off shift across institutional portfolios. Here's what you can expect, going forward. ... READ MORE


Even as market breadth deteriorates and the S&P 500 slips below key support, strong setups still exist. Dave Keller, CMT, highlights Marathon Petroleum, Target, and Palantir — three charts showing breakouts, trend strength, and improving momentum into March.... READ MORE
When most investors use Relative Rotation Graphs (RRGⓇ), they often focus on stocks or ETFs that are sitting in the Leading quadrant. But, by the time a security is deep in the Leading quadrant, most of the move may be over. In this video, Julius de Kempenaer explains why the... READ MORE


Money has moved into agricultural commodities, which offer true diversification in a portfolio. Arthur Hills analyzes the chart of DBA and zeroes in in soybeans, wheat, and livestock.... READ MORE

The stock market turned volatile as oil prices surged. Here's what the charts are telling investors about the market's next move.... READ MORE

The stock market has been rattled by geopolitical headlines, which have driven up crude oil prices. In this video, Tom Bowley shares his observations on what's happening beneath the surface.... READ MORE


Martin Pring analyzes the behavior of two inter-asset relationships, namely Stocks vs. Commodities and Stocks vs. Bonds. Read about his insights and know how to uncover the clues going forward.... READ MORE

Joe Rabil shows how a specific RSI setup can help traders identify the first pullback entry after a breakout. He also reviews S&P 500 volatility, sentiment, QQQ, IWM, and several stock setups.... READ MORE

As large-cap stocks dip to multi-month lows, some shifts are taking place that investors shouldn't ignore. Two indicators to watch are SPY distribution risk and the U.S. dollar's consolidation. Watch these charts closely.... READ MORE


Cryptocurrency prices have been under pressure. Here's a bear put spread options setup for a short-term bearish trade in COIN.... READ MORE
With corporate earnings now behind us, investors can shift their focus to the trends taking shape in Q1. In this video, David Keller, CMT, shares the top 10 charts he's watching for March 2026, and more importantly, why they matter right now. Dave organizes his charts into three... READ MORE

Weekly update on sector rotation for US sectors using Relative Rotation Graphs®.... READ MORE

Geopolitical tensions resulted in a surge in oil prices. Here's a technical look at the charts and potential target prices.... READ MORE


Faced with an extended range-bound structure for QQQ, Bruce Fraser presents a PnF case study as he considers the progress of the bull market uptrend.... READ MORE

With Nifty hovering about its 50-week moving average but trading below the 20-week, price action suggests a loss of upside momentum. What could it take to open the door for an up move?... READ MORE

In spite of strong Nvidia earnings, the broader AI trade showed fatigue. Mary Ellen McGonagle highlights rotation into healthcare leaders and selective consumer discretionary stocks, but highlights where this market demands careful positioning going forward.... READ MORE
Beneath this week's market jitters, a subtle but meaningful shift is taking place. It was another week where headlines, above all, drove the stock market. We had stories about AI disrupting software jobs, rising geopolitical tensions, and whispers of credit problems in the private credit space. Put all... READ MORE

The stock market is consolidating, not collapsing. Here's what sector rotation, moving averages, and the VIX reveal about what may come next.... READ MORE

When strong earnings stop driving higher prices, leadership may be shifting. Learn the chart signals that tell you when an AI stock is rolling over.... READ MORE

The Utilities sector is approaching a seasonally strong month. Tom Bowley analyzes this sector and makes a case for why utility stocks may soar in March.... READ MORE

The Mag 7 stocks have lost steam since November. However, four of the seven are showing long-term uptrends. Arthur Hill analyzes each of these charts and identifies potential reversal or continuation levels.... READ MORE
A major Supreme Court tariff ruling has left the S&P 500 pinned, but the bigger story may be where money is moving. Tom Bowley breaks down the rotation into utilities, energy, and materials as Treasury yields fall, explaining why that shift matters.... READ MORE
Joe Rabil explains why Bitcoin is sitting at key support near a major retracement level and what would confirm an interim low. He also reviews SPY volatility, sentiment, ADX conditions, and several stock setups.... READ MORE

The 10-Year Treasury yield is close to a key support level, the S&P 500 is showing signs of weakening momentum, and the US dollar could see some upside movement. Add these charts to your StockCharts ChartLists as we enter a volatile period.... READ MORE

There has been a shift in market leadership, suggesting that we may be in the later stages of a business cycle. Martin Pring's analysis of these rotations uncovers the scenarios we can expect during this stage.... READ MORE
With NVIDIA earnings having the potential to trigger a major move, Dave Keller takes a close look at it’s chart across multiple timeframes. From long-term PPO signals to key support and resistance, he explains the critical features that could confirm a breakout or breakdown.... READ MORE

JPM's stock price is showing technical weakness. Here's a bearish options strategy setup with a compelling risk/reward structure. Explore how you can take advantage of it.... READ MORE
Julius presents his weekly update on Sector Rotation for US sectors using Relative Rotation Graphs.... READ MORE


Before We Dive In… In our last breadth article, we explored how Point & Figure buy signals give a unique angle on index strength or weakness. Today, we’re going to widen our breadth lens across four time horizons, which will give us clues on strength from periods of short-term... READ MORE

Retail stocks rose after the recent tariff ruling, but the charts give a mixed story. Here's a look at four retail stocks with support, resistance, and congestion zones.... READ MORE

The Nifty continues to consolidate just below a crucial resistance band while maintaining a broader uptrend. What would be needed to for it break out?... READ MORE
A quiet week, but be sure to look under the hood. It was another week of relatively little movement in the stock market. Yes, tariff headlines stirred things up a bit, but as the dust settled, the major indices quietly edged higher. Here’s their weekly performance: * Dow Jones Industrial... READ MORE
Mary Ellen McGonagle analyzes how flat index performance is masking expanding sector rotation beneath the surface. She highlights confirmed strength in industrials, metals, and select reversal setups as software, retail, and parts of financials continue to lag.... READ MORE
The S&P 500 remains locked in a multi-month consolidation as leadership rotates from growth into value. Dave Keller, CMT, updates key support and resistance levels and explains how momentum signals, especially RSI, could confirm the S&P 500's next breakout or breakdown.... READ MORE