MEMBERS ONLY
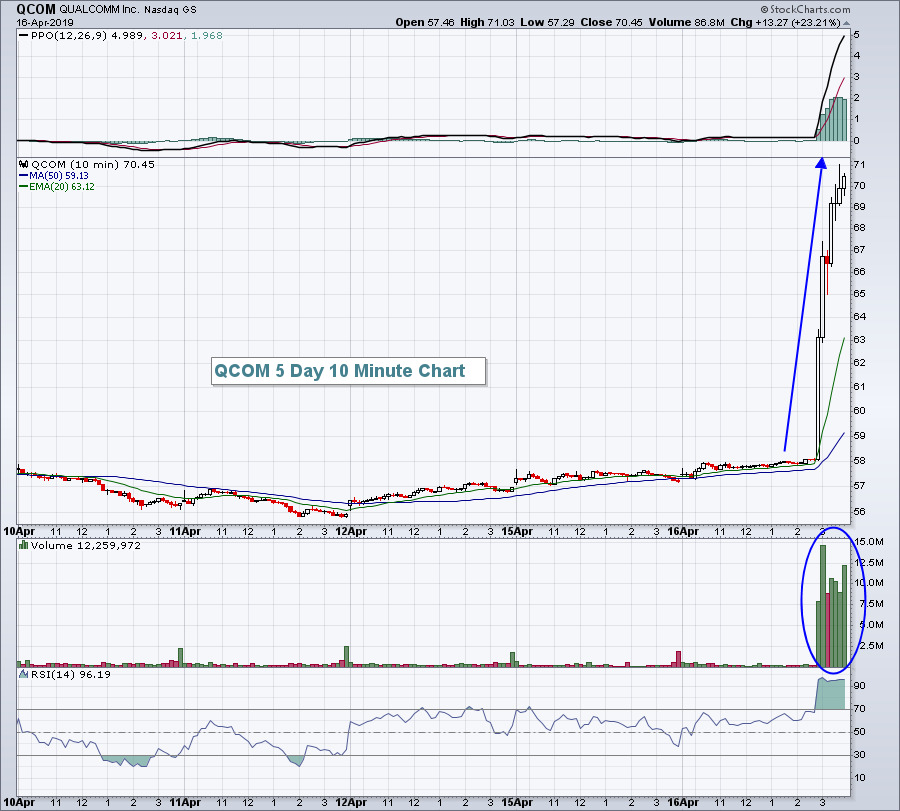
Respect That 2940 Top On The S&P 500

by Tom Bowley,
Chief Market Strategist, EarningsBeats.com
Market Recap for Tuesday, April 16, 2019
It was just another day of boring gains. But that's what happens during bull market advances. The Volatility Index ($VIX, -1.14%) drifts lower and stock prices edge higher. Remember when the VIX topped out with a close above 36 on...
READ MORE
MEMBERS ONLY
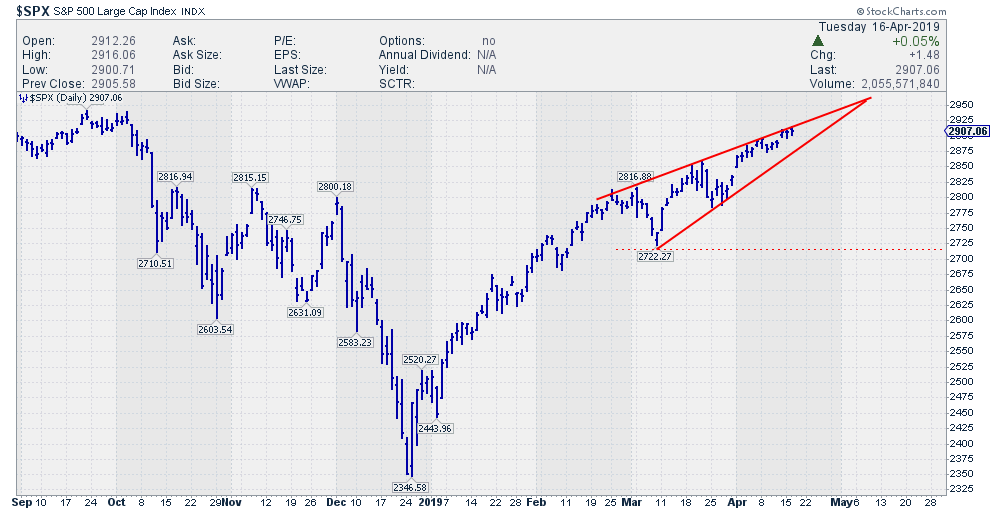
Are We Looking At A Wedge In The Making?

by Julius de Kempenaer,
Senior Technical Analyst, StockCharts.com
When acting in an environment of uncertainty (of which financial markets are a prime example) it is a good habit to double-check any findings. Think of it as an extra pair of eyes to confirm or deny what you (think you) are seeing.
In this process, please keep an open...
READ MORE
MEMBERS ONLY

Gold Loses Its Shine - IT Trend Model Neutral Signal - IT PMO SELL Signal Nearing

by Erin Swenlin,
Vice President, DecisionPoint.com
Today, DecisionPoint reported a new Intermediate-Term Trend Model Neutral signal on Gold to Timer Digest. The signal was triggered when the 20-EMA crossed below the 50-EMA. It wasn't a SELL signal, as the 20/50-EMA crossover occurred above the 200-EMA. Don't let the "neutral"...
READ MORE
MEMBERS ONLY

Gold Starts To Break Down - But Is It For Real?

by Martin Pring,
President, Pring Research
* The Long-Term Picture Looks Positive
* Gold’s Tuesday Downside Breakout Could Be the Spoiler
* Platinum is Trying to Break Out Against Gold - Why That’s Important for the Economy
The Long-Term Picture Looks Positive
Over the last 6 years, it appears that the gold price has been trying to...
READ MORE
MEMBERS ONLY

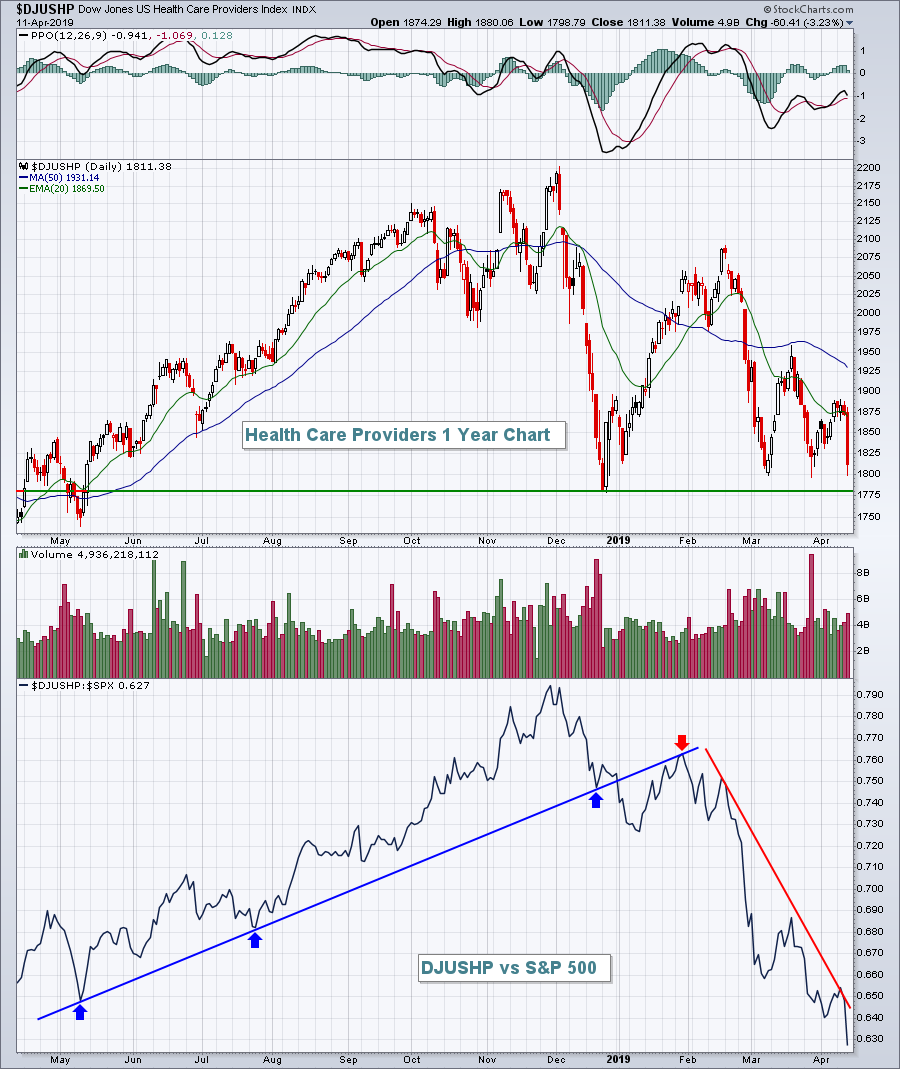
ASSET MANAGERS LEAD FINANCIALS HIGHER -- LED BY BLACKROCK, INVESCO, AND T ROWE PRICE -- HEALTHCARE SPDR FALLS BELOW 200-DAY AVERAGE -- LED LOWER BY HEALTH CARE PROVIDERS -- HCA TUMBLES, WHILE CIGNA, AND HUMANA HIT 52-WEEK LOWS

by John Murphy,
Chief Technical Analyst, StockCharts.com
ASSET MANAGERS LEAD FINANCIALS HIGHER ... Financials are the day's strongest sector. Chart 1 shows the Financial Sector SPDR (XLF) trading today at the highest level since last October. The solid gray line is a relative strength ratio of the XLF divided by the S&P 500; and...
READ MORE
MEMBERS ONLY
Rotation To Defense Isn't A Bad Thing
by Tom Bowley,
Chief Market Strategist, EarningsBeats.com
Market Recap for Monday, April 15, 2019
Defensive groups took their turn leading the stock market, but on a down day that is generally to be expected. Consumer staples (XLP, +0.59%) and healthcare (XLV, +0.40%) were the two leading groups, while financials (XLF, -0.63%) backed off from...
READ MORE
MEMBERS ONLY
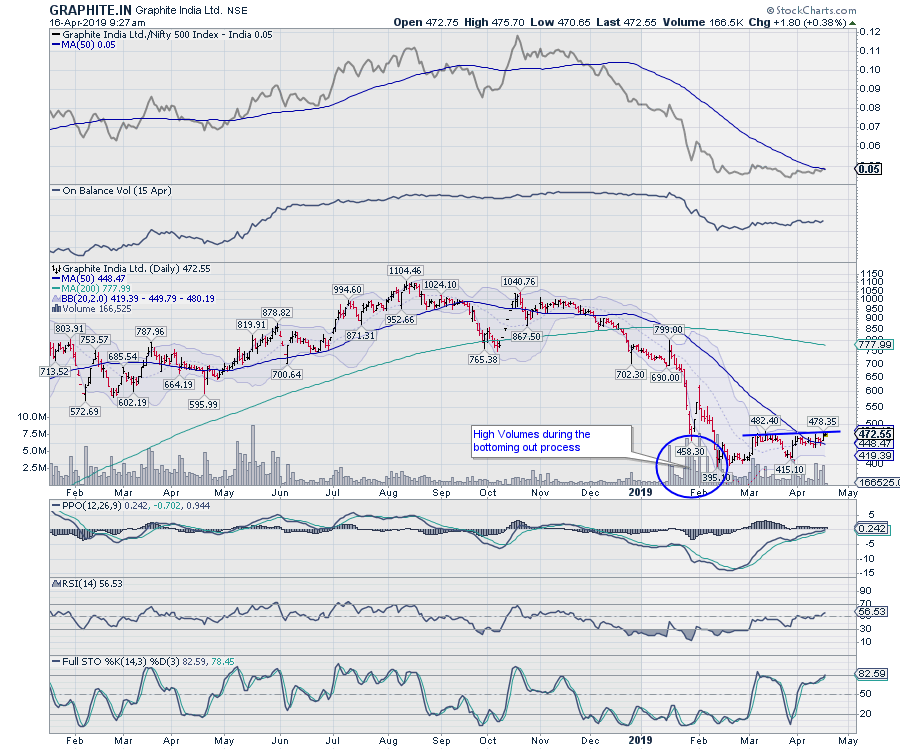
Graphite India - Showing Good Potential Among Non-Index Stocks

by Milan Vaishnav,
Founder and Technical Analyst, EquityResearch.asia and ChartWizard.ae
Graphite India Limited - GRAPHITE.IN
GRAPHITE looks to be confirming its bottom in the 395-415 zone. After marking a low near 395, the stock has formed a base in the 395-415 zone; having experienced a sideways move over past couple of weeks, a breakout appears likely. The RSI, which...
READ MORE
MEMBERS ONLY

RISK

by Greg Morris,
Veteran Technical Analyst, Investor, and Author
Dictionary.com says: Risk is the exposure to the chance of injury or loss; a hazard or dangerous chance. American Heritage Dictionary says: Risk is the possibility of suffering harm or loss; danger. These are just two of the many entries and these were just for the noun. Risk in...
READ MORE
MEMBERS ONLY

Finding, Tracking and Analyzing Growth Stocks

by Arthur Hill,
Chief Technical Strategist, TrendInvestorPro.com
Learning about and tracking growth stocks in unique industry groups is an ongoing process that can help traders and investors outperform the broader market. This article will provide links to some of the resources from the On Trend episode focusing on growth stocks (Finding, Tracking and Analyzing Growth Stocks). A...
READ MORE
MEMBERS ONLY
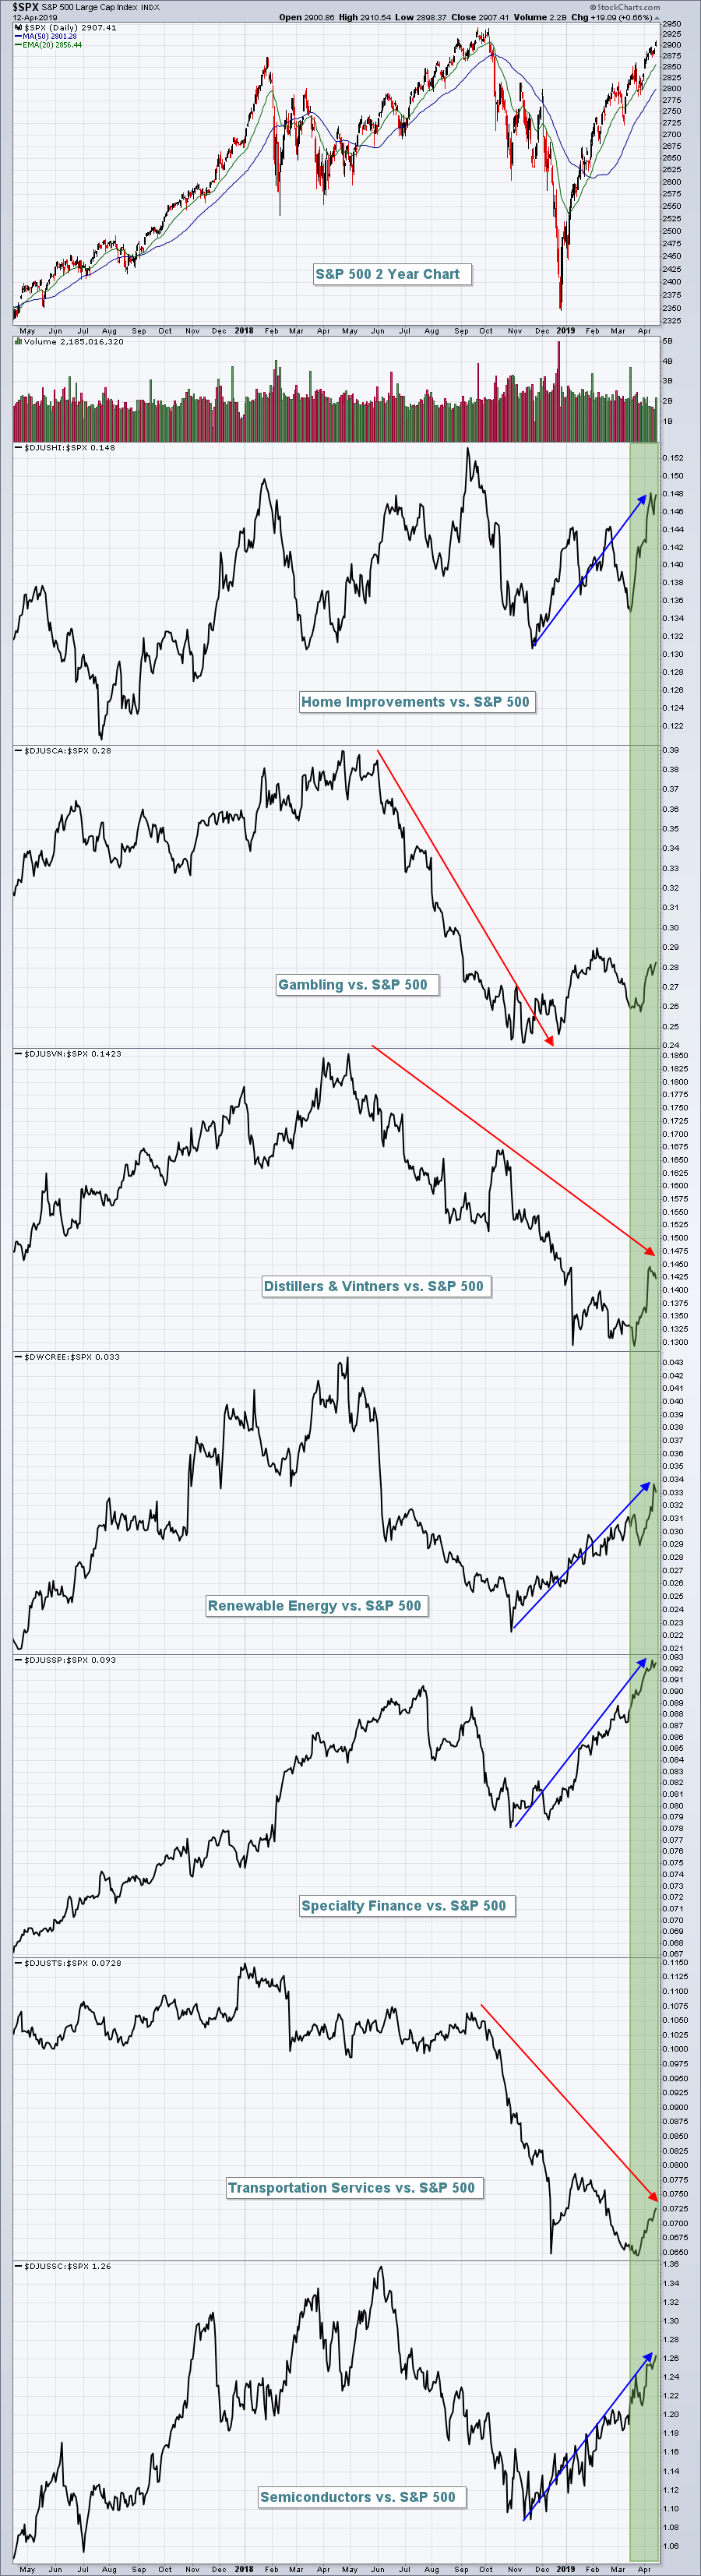
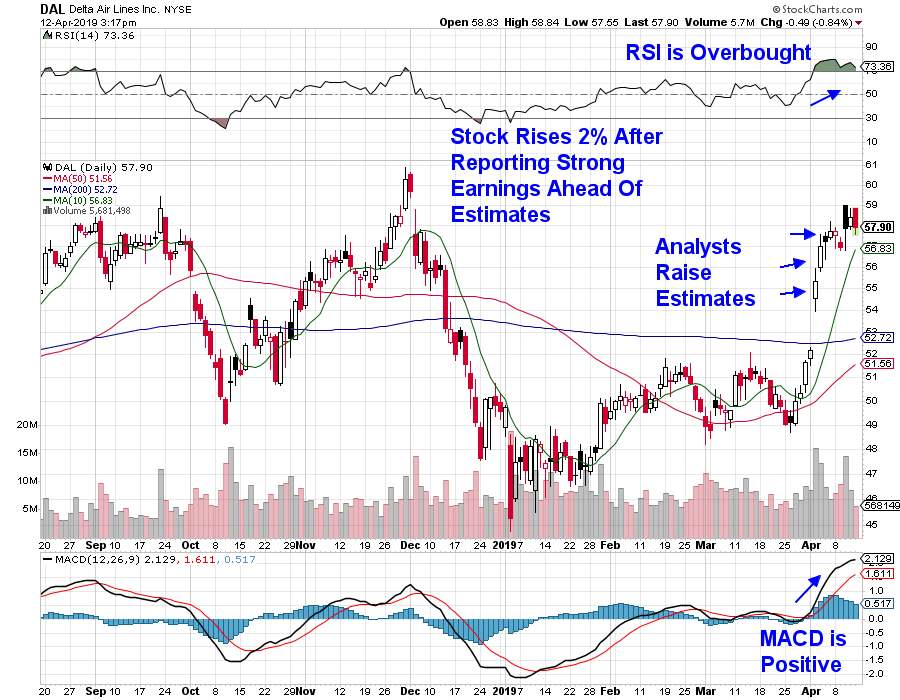
All-Time Highs Approaching Plus 10 Trade Setups
by Tom Bowley,
Chief Market Strategist, EarningsBeats.com
Market Recap for Friday, April 12, 2019
Who thought at our December low that the S&P 500 would rally well over 20% to above 2900 and within 1% of our all-time high in less than four months? Not this guy. The stock market can do anything, but if...
READ MORE
MEMBERS ONLY
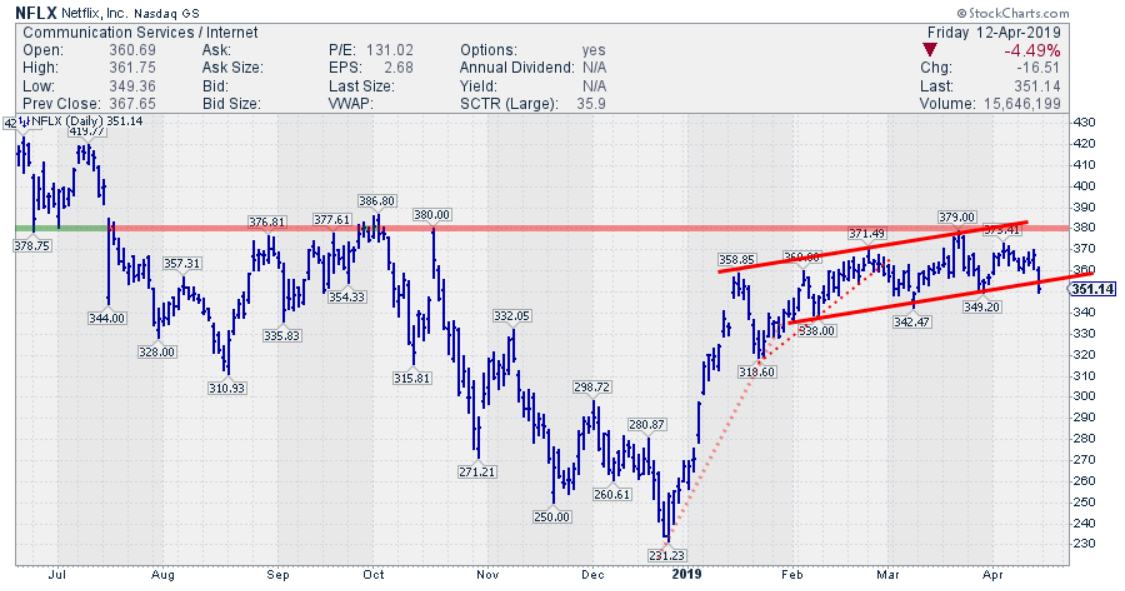
Three Breaks And You're Out For NFLX?
by Julius de Kempenaer,
Senior Technical Analyst, StockCharts.com
Since the beginning of the month, NFLX is lagging the S&P 500 index by more than 5%.
This is following the relative weakness that entered this stock after a strong start of 2019, where NFLX initially ran from $230 to $370 but started to move sideways, facing heavy...
READ MORE
MEMBERS ONLY
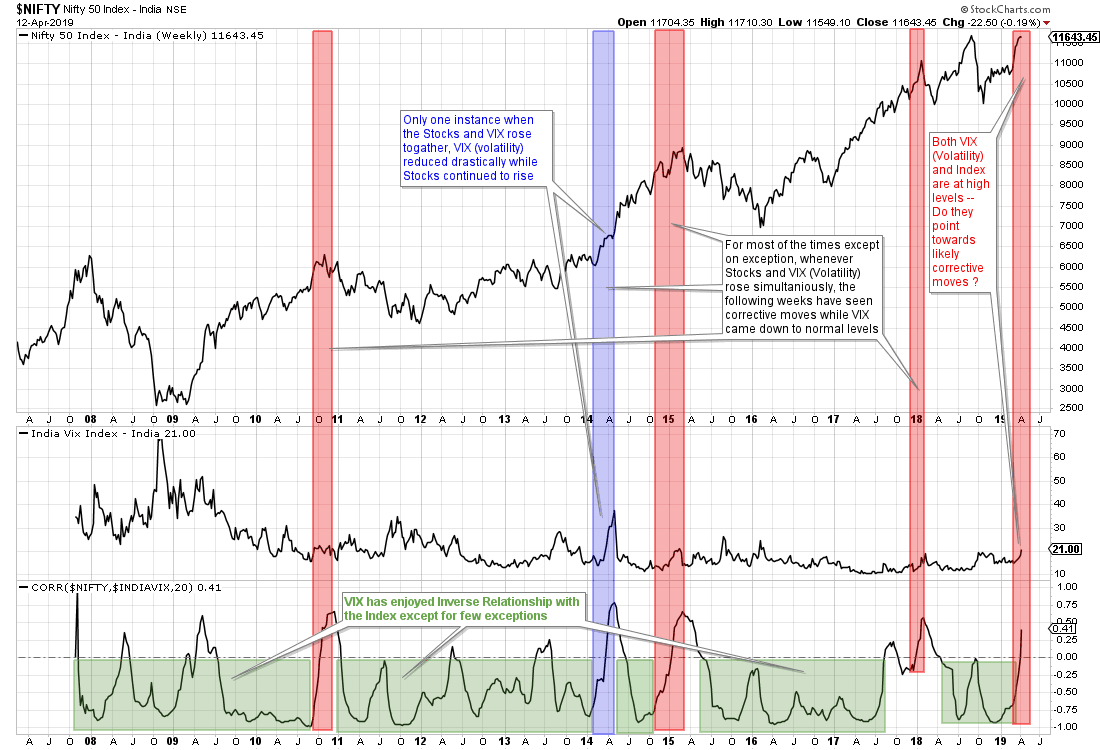
Special Note: When VIX Defies Its Inverse Relationship With NIFTY...
by Milan Vaishnav,
Founder and Technical Analyst, EquityResearch.asia and ChartWizard.ae
The Volatility Index, more commonly known as the VIX, is a measurement of market's expected volatility in the future. Analysts and investors alike look at this tool to measure sentiment while making investment decisions. The VIX reflects the psychology of market participants' fear and greed and is...
READ MORE
MEMBERS ONLY
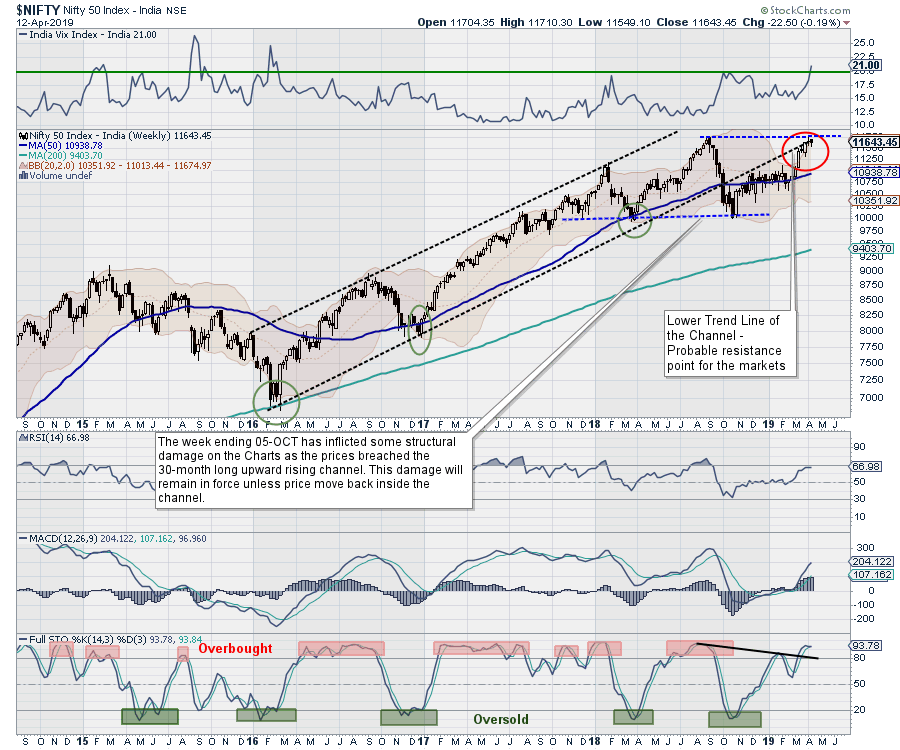
Week Ahead: Truncated Short Week To See Capped Upsides; Charts Offer Important Signals To Read
by Milan Vaishnav,
Founder and Technical Analyst, EquityResearch.asia and ChartWizard.ae
This was the second week in a row where the Indian equity markets did not make any significant directional move. The week that went by remained particularly volatile, as the market oscillated back and forth on each side in a defined range while continuing to resist to the lower trend...
READ MORE
MEMBERS ONLY
Here Are The Industry Groups Flying Into Earnings Season
by Tom Bowley,
Chief Market Strategist, EarningsBeats.com
Analysts routinely visit management teams of public companies to see how their quarters are progressing. Based on the knowledge they gain, they return to their offices and their firms issue recommendations to buy or sell. It's the reason that we do what we do. By analyzing price action,...
READ MORE
MEMBERS ONLY
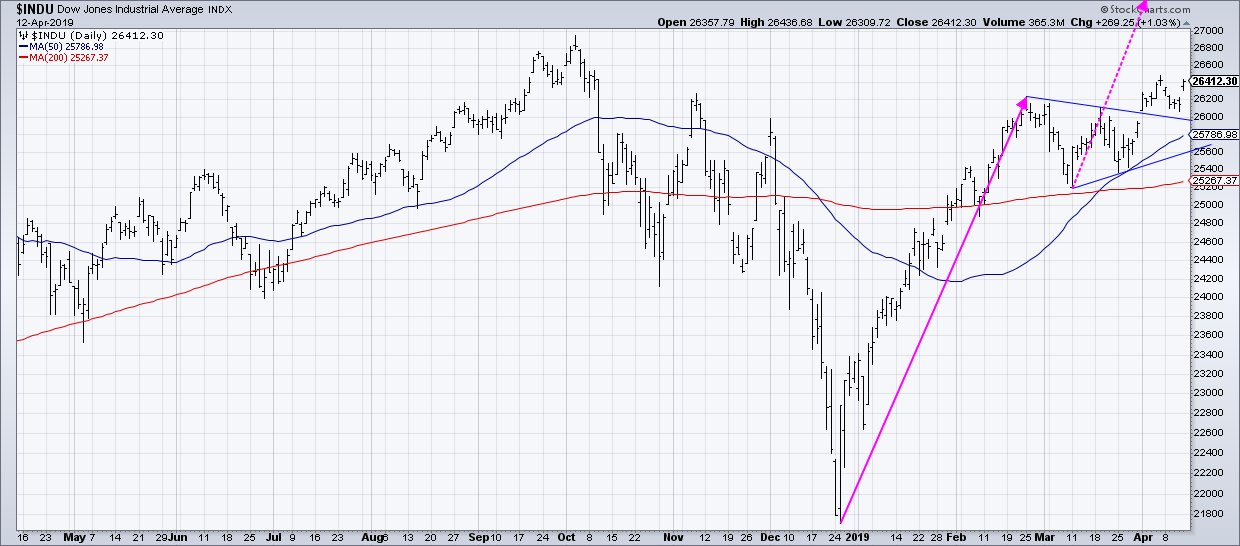
An Aggressive Projection for the Dow

by David Keller,
President and Chief Strategist, Sierra Alpha Research
Have you ever played devil’s advocate in a group discussion? That's the situation where everyone comes to one conclusion, so you take the opposite side just to provide an alternative hypothesis and argue its merits.
We often avoid this sort of “outside the box” thinking because of...
READ MORE
MEMBERS ONLY
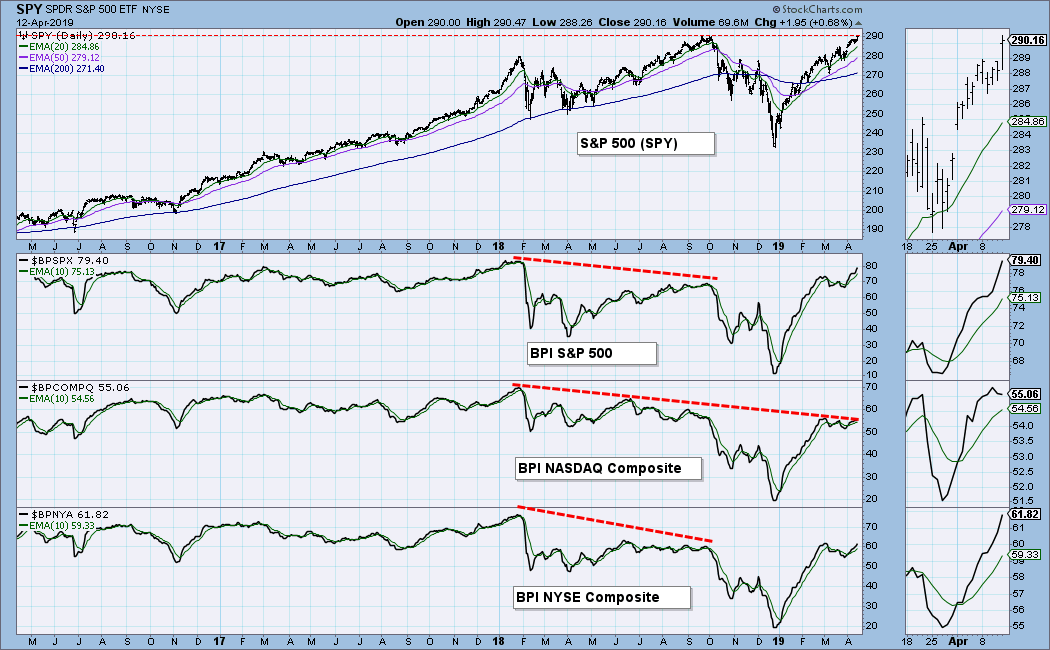
DP WEEKLY WRAP: Nasdaq and NYSE Bullish Percent Lagging Behind

by Carl Swenlin,
President and Founder, DecisionPoint.com
One of the market indicators available on StockCharts.com is the Bullish Percent Index (BPI), which calculates the percentage of stocks in a given index that are on point and figure BUY signals. On the chart below we can see the BPI for the S&P 500, the Nasdaq...
READ MORE
MEMBERS ONLY
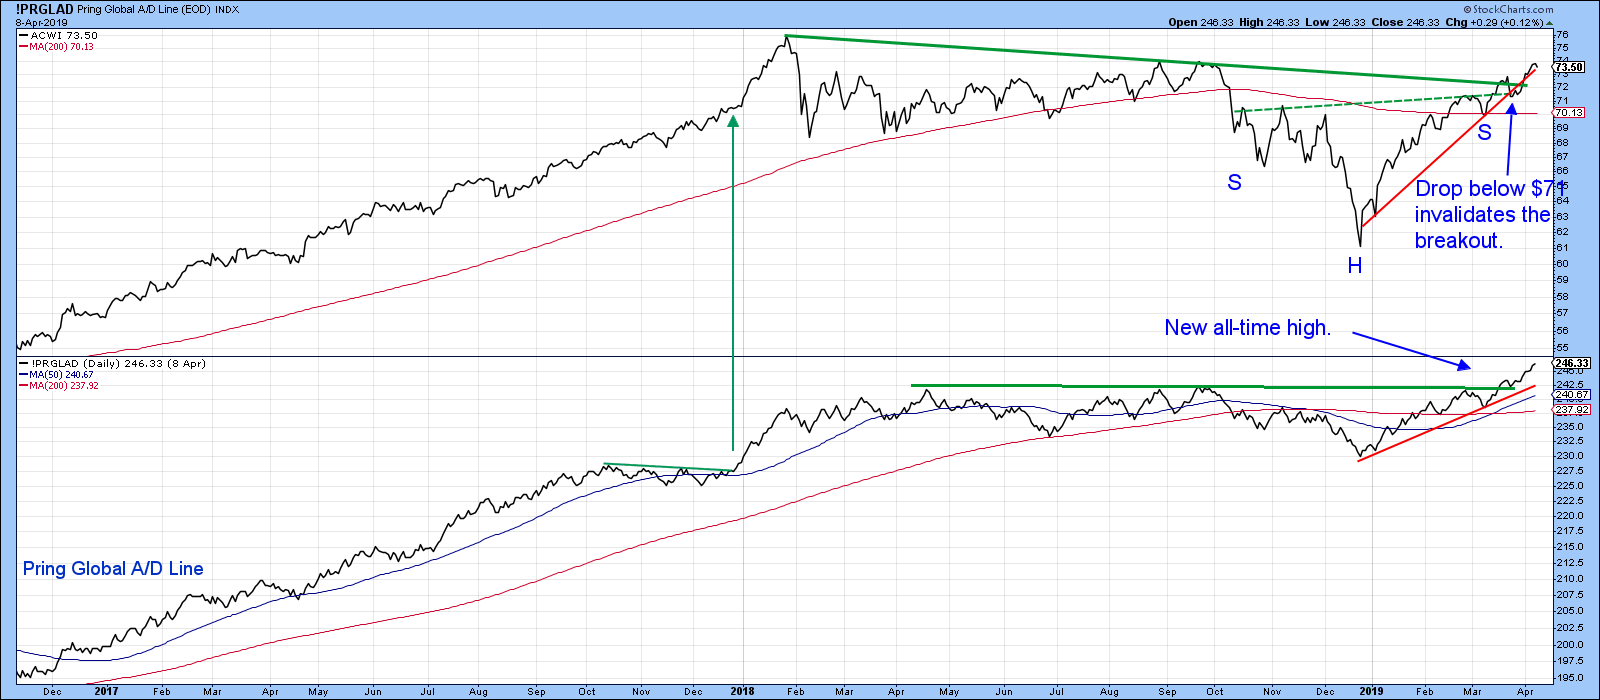
Global Stocks Join Global A/D Line Above Key Trend Lines
by Martin Pring,
President, Pring Research
Editor's Note: This article was originally published in Martin Pring's Market Roundup on Tuesday, April 9th at 1:08pm ET.
Global stocks, represented in the form of the MSCI World Stock ETF (ACWI), peaked in January of last year and gradually worked their way lower into...
READ MORE
MEMBERS ONLY
Trading Stocks Before They Report Earnings - Tips to Improve Your Success Rate

by Mary Ellen McGonagle,
President, MEM Investment Research
Earnings surprises can move a stock substantially, leading to either huge gains or big losses in your portfolio. Today, I’ll be reviewing how you can trade during earnings season to your benefit. There is no single absolute way to do this; rather, as you’ll see, it will depend...
READ MORE
MEMBERS ONLY
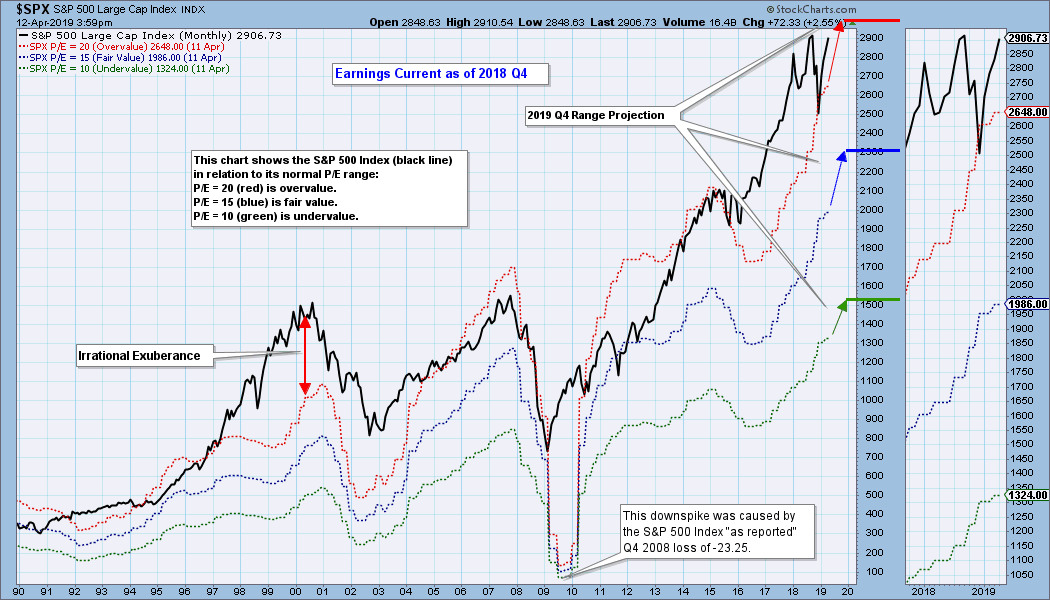
EARNINGS: 2018 Q4 Finalized; S&P 500 Still Overvalued
by Carl Swenlin,
President and Founder, DecisionPoint.com
S&P 500 earnings for 2018 Q4 have been finalized, and with a P/E of 21.4, the market is above the normal value range and very overvalued. The following chart shows us the normal value range of the S&P 500 Index. It shows us where...
READ MORE
MEMBERS ONLY
When Tails Remain On One Side Of A Relative Rotation Graph, What Does That Mean?
by Julius de Kempenaer,
Senior Technical Analyst, StockCharts.com
Relative Rotation Graphs are a great tool to use to visualize sector rotation, along with other asset rotations in various universes.
If you have used RRGs regularly and have monitored multiple rotational patterns, you may have noticed that the rotations do not always travel through all four quadrants in sequential...
READ MORE
MEMBERS ONLY

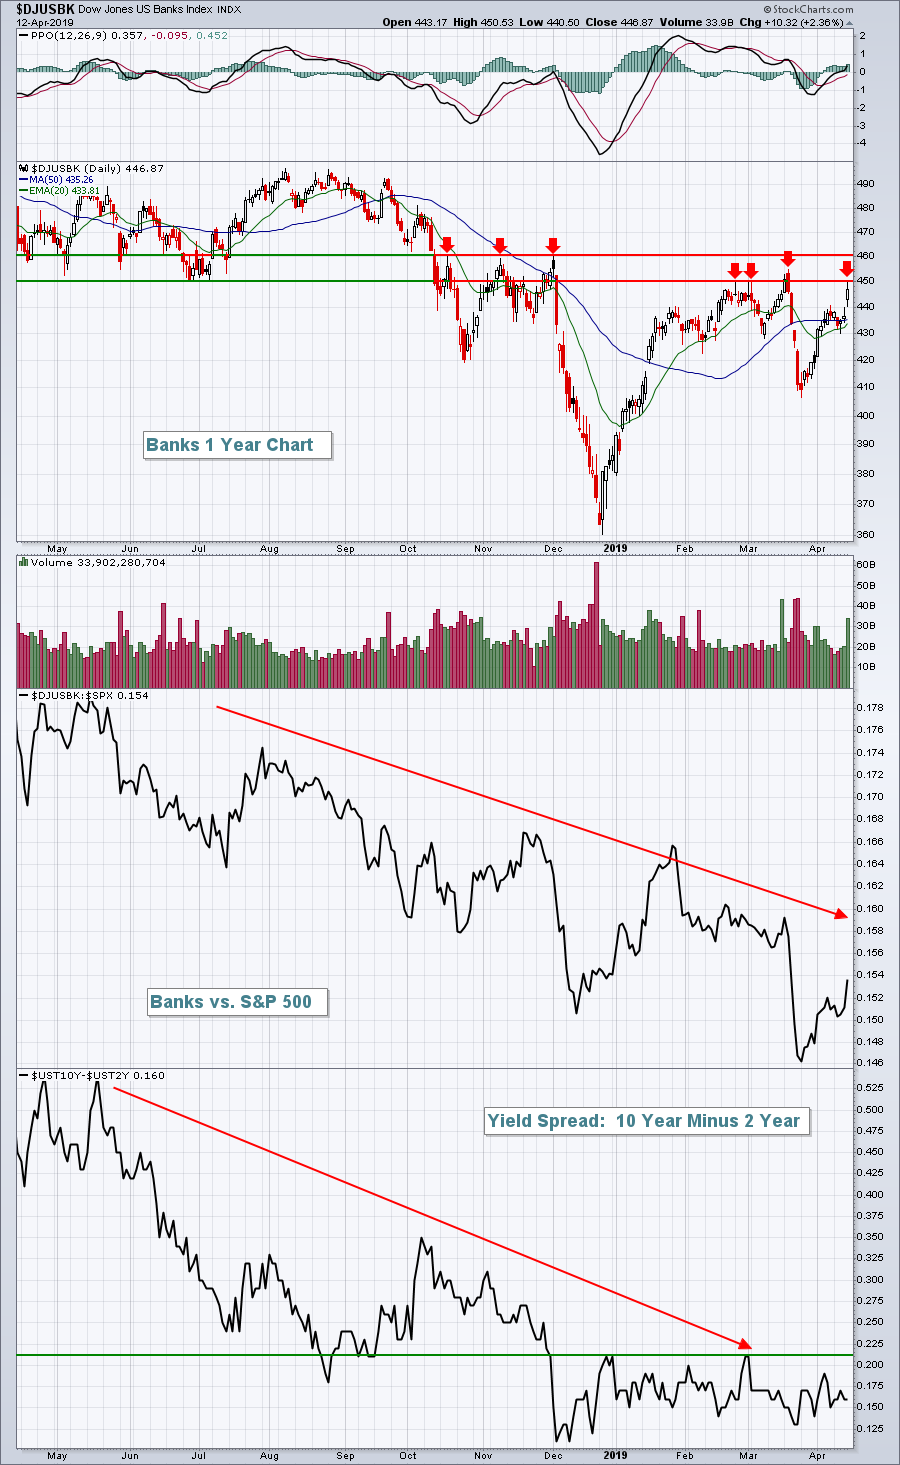
BANKS LEAD FINANCIALS AND THE MARKET HIGHER -- FINANCIAL SPDR HITS NEW 2019 HIGH -- WHILE S&P BANK ISHARES CLEAR THEIR 200-DAY LINE -- BANK LEADERS INCLUDE JPM, BAC, AND PNC -- S&P 500 NEARS TEST OF LAST SEPTEMBER HIGH
by John Murphy,
Chief Technical Analyst, StockCharts.com
BANKS LEAD FINANCIALS HIGHER ... Strong earnings from three banks this morning have helped push that group sharply higher; and they're leading the financial sector and the market higher. Chart 1 shows the Financial Sector SPDR (XLF) gapping up to the highest level of the year (after regaining its...
READ MORE
MEMBERS ONLY
J.P. Morgan Beats Earnings Expectations
by Tom Bowley,
Chief Market Strategist, EarningsBeats.com
Market Recap for Thursday, April 11, 2019
U.S. equities finished in bifurcated fashion as a late day rally enabled the S&P 500 to eke out a miniscule 0.11 point gain (+0.00%). The other major indices finished in negative territory, led by the 0.21% decline...
READ MORE
MEMBERS ONLY
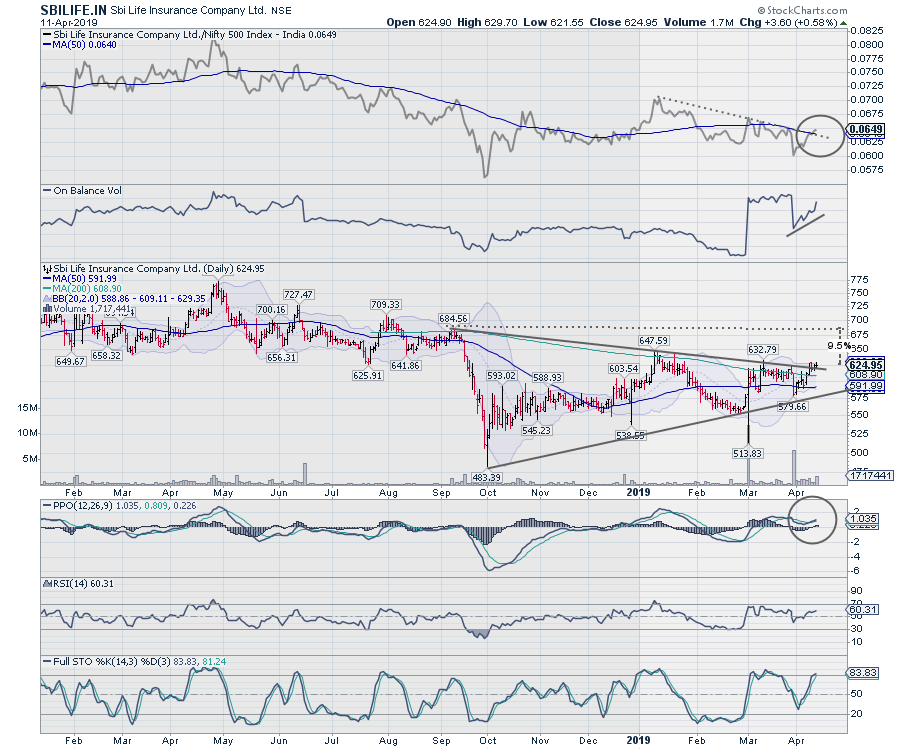
SBILIFE Offers Some Upside Potential
by Milan Vaishnav,
Founder and Technical Analyst, EquityResearch.asia and ChartWizard.ae
SBI Life Insurance Company Ltd (SBILIFE.IN)
This stock has a relatively short listing history. It originally listed in October 2017 and marked its high near 772 in middle of 2018, with a subsequent low near 483 in the corrective move that followed in late 2018. Presently, the stock is...
READ MORE
MEMBERS ONLY
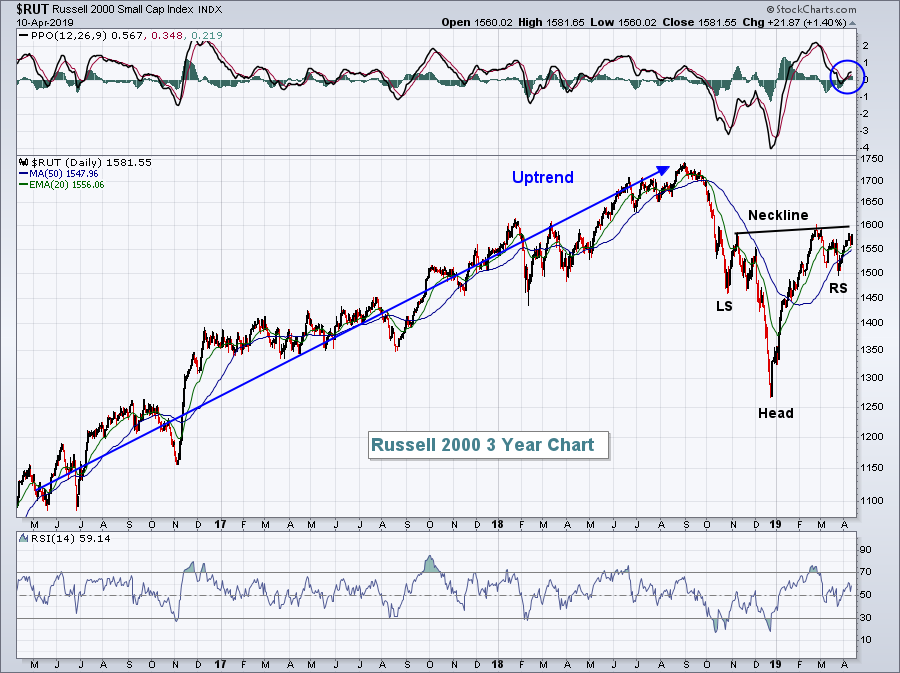
S&P 500 Channel Suggests We'll Bust Through 3000
by Tom Bowley,
Chief Market Strategist, EarningsBeats.com
Market Recap for Wednesday, April 10, 2019
Small cap stocks enjoyed a huge day, carrying Wall Street higher. The Russell 2000 surged 1.40% and is nearing a major neckline resistance that, if broken, would suggest much higher prices for small caps:
Clearing 1600 would be a big deal technically...
READ MORE
MEMBERS ONLY
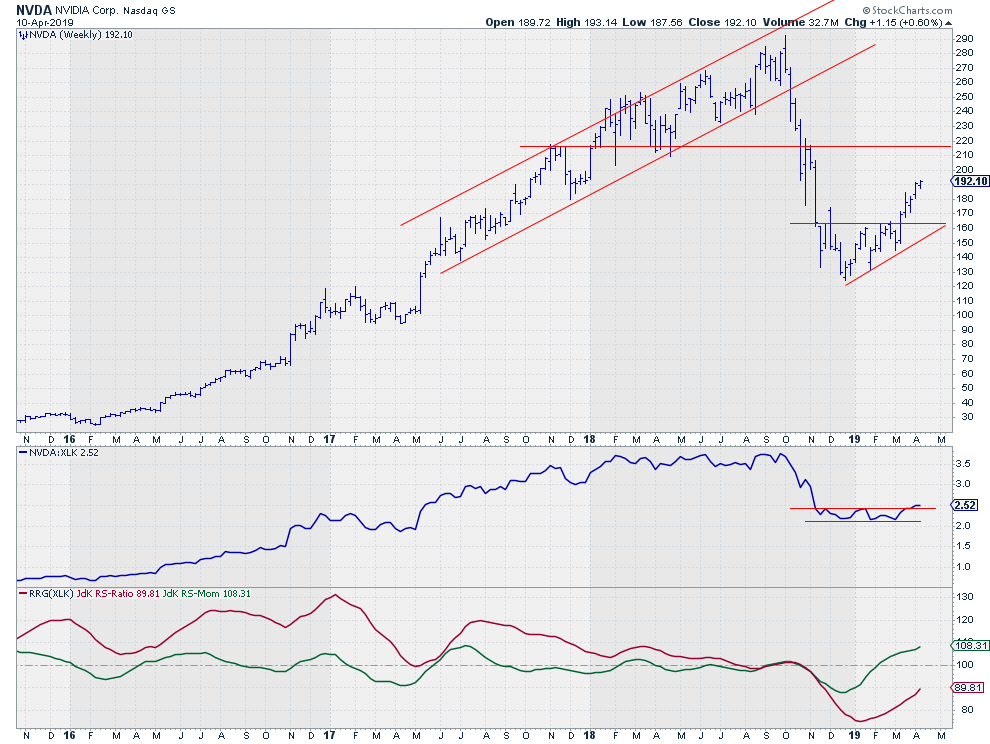
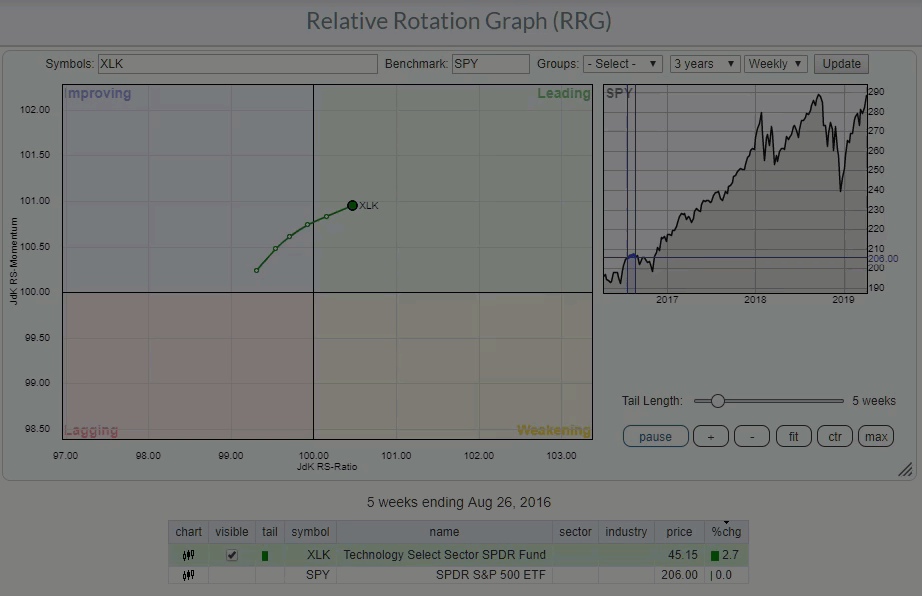
Is NVDA The Strongest Stock In The Strongest Sector?
by Julius de Kempenaer,
Senior Technical Analyst, StockCharts.com
Looking over some Relative Rotation Graphs this morning showed me that the Information Technology sector is currently the strongest sector in the S&P 500 universe.
XLK is positioned well inside the leading quadrant and is being powered further into that space by a long tail. It is difficult...
READ MORE
MEMBERS ONLY

DP Alert: New BUY Signal for Gold - TLT Rallies Off Support Despite PMO SELL Signal
by Erin Swenlin,
Vice President, DecisionPoint.com
There are no changes this week on the DecisionPoint Scoreboards or on the DecisionPoint Sector Scoreboard. The market appears strong, but there are a few items under the hood I'm concerned about. Good news for Gold as it just triggered a Price Momentum Oscillator (PMO) BUY signal today....
READ MORE
MEMBERS ONLY

RUSSELL 2000 IS TRYING TO CLEAR ITS 200-DAY AVERAGE -- SO ARE AIRLINES AND ENERGY STOCKS -- BANKS ARE HOLDING FINANCIALS BACK -- WHILE MORTGAGE FINANCE STOCKS ARE LEADING THEM HIGHER -- MEXICO AND SOUTH KOREA ETFS CLEAR THEIR 200-DAY LINE
by John Murphy,
Chief Technical Analyst, StockCharts.com
RUSSELL 2000 SMALL CAP INDEX IS TRYING TO CLEAR ITS 200-DAY AVERAGE... Last Wednesday's message showed the S&P 400 Mid Cap Index clearing its 200-day average; and suggested that left only the small caps to join the market rally. That may be about to happen. Chart...
READ MORE
MEMBERS ONLY

WYNN Win

by Bruce Fraser,
Industry-leading "Wyckoffian"
Wynn Resorts is a favorite stock to study. WYNN tends to have big cyclical trends which repeat over and over again. These trends are wonderfully persistent in their upward and downward movements. Also prior to a major change of trend, a Cause builds for either Accumulation or Distribution. And these...
READ MORE
MEMBERS ONLY
Financials Do Have Pockets Of Strength
by Tom Bowley,
Chief Market Strategist, EarningsBeats.com
Market Recap for Tuesday, April 9, 2019
Profit taking dominated Tuesday's action with the small cap Russell 2000 leading the list of losers, dropping 1.22%. But sellers were most everywhere as the Dow Jones, S&P 500 and NASDAQ fell 0.72%, 0.61% and 0....
READ MORE
MEMBERS ONLY

Overbought Means Up A Lot
by David Keller,
President and Chief Strategist, Sierra Alpha Research
I was once asked the classic “trapped on a desert island” question, with a technical analysis twist: If you could only have one technical indicator (except price), which would it be?
For me, that’s an easy one. RSI.
As part of my training experience at Bloomberg, I was introduced...
READ MORE
MEMBERS ONLY
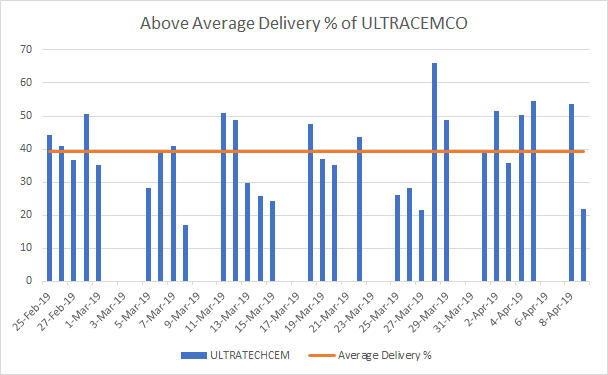
Complex Inverted H&S Formation on ULTRACEMCO; Higher Delivery Percentage May Give Directional Clues
by Milan Vaishnav,
Founder and Technical Analyst, EquityResearch.asia and ChartWizard.ae
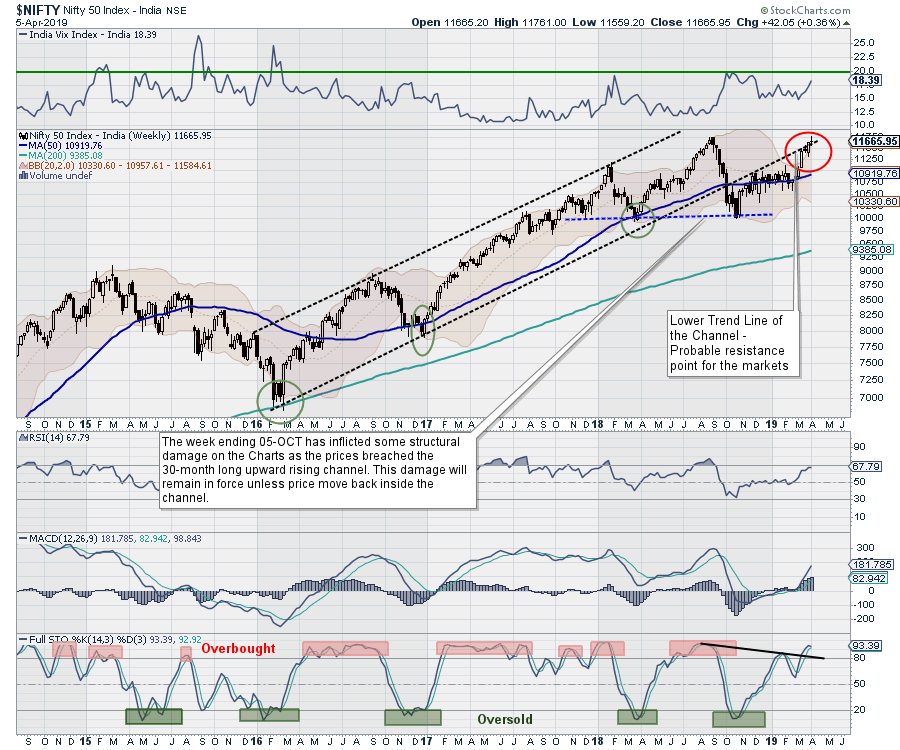
A couple of days back, the NIFTY marked a classical Double Top at the 11760 level. The benchmark index has halted its up move and can be seen consolidating just below that level. Over the coming days, the markets are expected to remain highly stock-specific. Right now, ULTRACEMCO.IN deserves...
READ MORE
MEMBERS ONLY

Global Stocks and Bitcoin are Breaking to the Upside
by Martin Pring,
President, Pring Research
* Global Stocks Join Global A/D Line Above Key Trend Lines
* Bitcoin Looking Better After an 80% Drop
* Inflation vs. Deflation
Global Stocks Join Global A/D Line Above Key Trend Lines
Global stocks, represented in the form of the MSCI World Stock ETF (ACWI), peaked in January of last...
READ MORE
MEMBERS ONLY
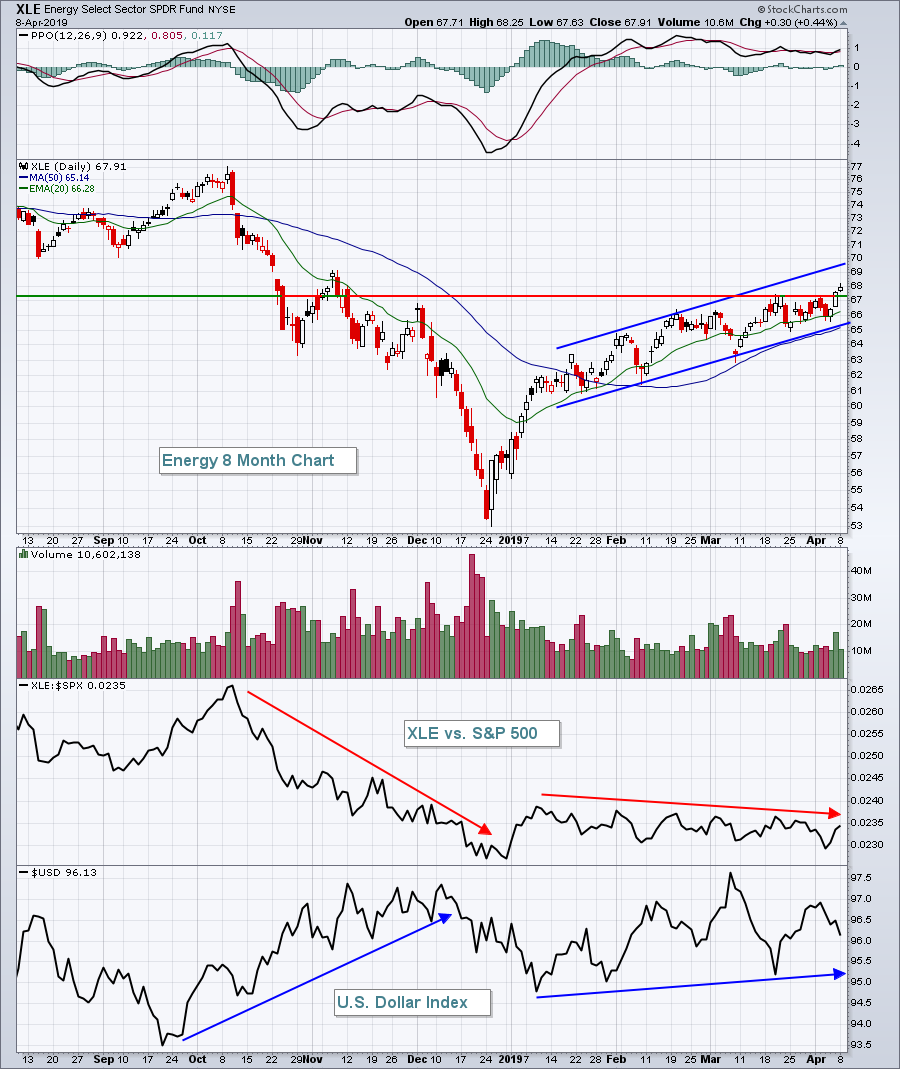
Energy At 5 Month High As Crude Prices Surge
by Tom Bowley,
Chief Market Strategist, EarningsBeats.com
Market Recap for Monday, April 8, 2019
Crude oil prices ($WTIC, +2.09%) surged once again on Monday, and have now climbed 50% off their December low. While energy (XLE, +0.44%) has been a major beneficiary, as we would expect, the XLE has been mired in a downtrend vs....
READ MORE
MEMBERS ONLY
Relative Performance
by Greg Morris,
Veteran Technical Analyst, Investor, and Author
First of all, you cannot retire on relative performance. Relative performance is often a valuable tool, but is also a marketing concept dreamed up by financial pundits who rarely outperform the market. Table A is a table of various asset classes and their relative performance since 2009, with the last...
READ MORE
MEMBERS ONLY
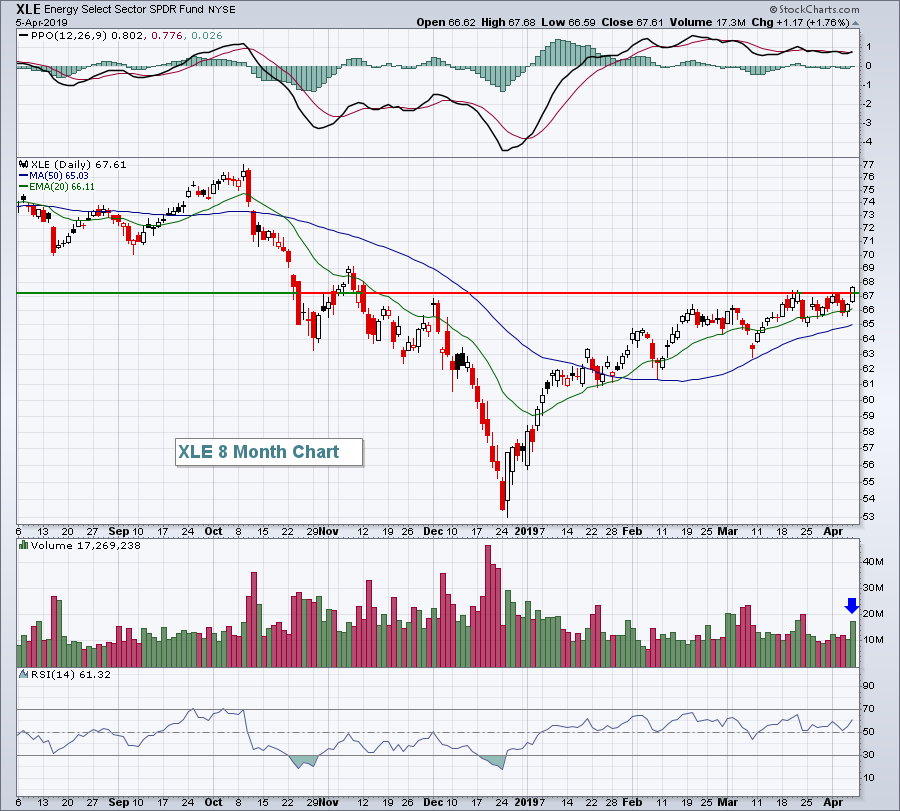
Energy Rebounds Plus 10 Trade Setups For Today
by Tom Bowley,
Chief Market Strategist, EarningsBeats.com
Market Recap for Friday, April 5, 2019
Energy stocks (XLE, +1.76%) were the clear leader on Friday as Wall Street climbed once again. Recently, crude oil prices ($WTIC, +1.58%) opened April by posting new 2019 highs, but the XLE failed to follow suit, instead falling back to test...
READ MORE
MEMBERS ONLY
RSI for Trend-Momentum Strategies
by Arthur Hill,
Chief Technical Strategist, TrendInvestorPro.com
This post will provide a resource link and scan code from the On Trend episodes focusing on RSI for trend-following and momentum strategies. This is a two-part series that goes from RSI basics to a twenty year backtest on stocks in the S&P 500. These episodes will show...
READ MORE
MEMBERS ONLY
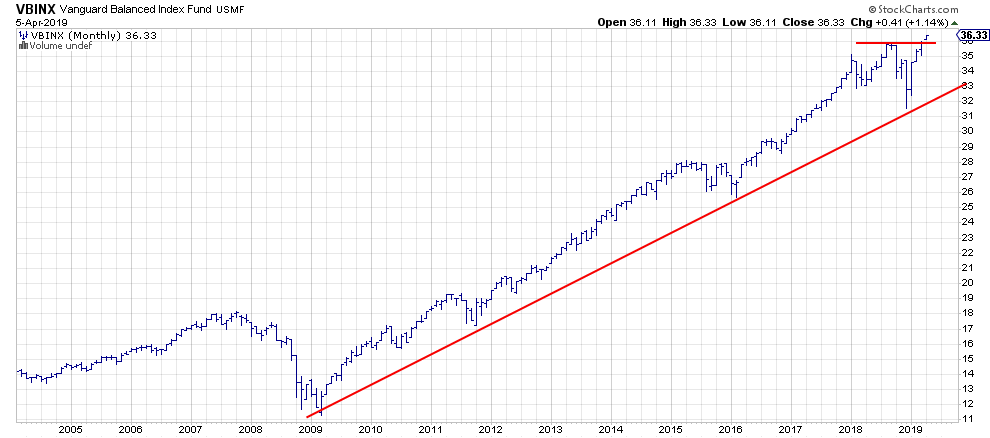
The 60/40 Balanced Portfolio Just Broke To New Highs - What About Stocks vs Bonds?
by Julius de Kempenaer,
Senior Technical Analyst, StockCharts.com
For asset allocation analysis, I generally use VBINX, a balanced index fund by Vanguard that holds 60% in stocks and 40% in a mix of different bonds.
This balanced portfolio (total return basis) just broke to new highs this week. Meanwhile, neither stocks (SPY) or bonds (IEF) have accomplished that,...
READ MORE
MEMBERS ONLY
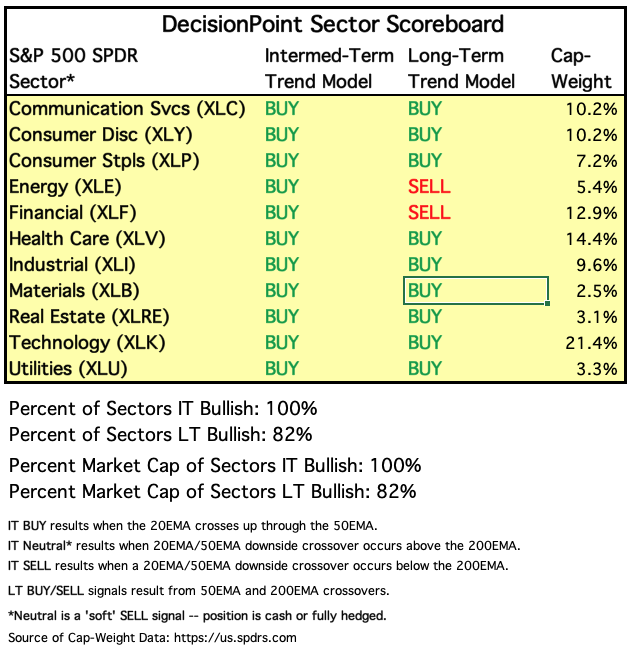
Materials Sector (XLB) Bursts Through Resistance with Confirming LT Buy Signal
by Erin Swenlin,
Vice President, DecisionPoint.com
While I maintain the DecisionPoint Scoreboard for the large-cap SPX, OEX, NDX and Dow, Carl maintains a DecisionPoint "Sector" Scoreboard. On Friday's DecisionPoint show (which airs Fridays at 4:30p EST on StockCharts TV), Carl and I pointed out that the Materials sector triggered a new...
READ MORE
MEMBERS ONLY

RISING CHINESE STOCK MARKET IS BOOSTING INDUSTRIAL METALS AND STOCKS TIED TO THEM - THE GLOBAL METALS AND MINING PRODUCERS ISHARES HAVE TURNED UP -- RISING COMMODITY PRICES HELPED MAKE MATERIALS THE WEEK'S STRONGEST SECTOR
by John Murphy,
Chief Technical Analyst, StockCharts.com
POSITIVE IMPLICATIONS FROM A STRONGER CHINA... My Thursday message showed an index of foreign stocks turning higher, which relieved concerns that weaker foreign stocks could start to weigh on U.S. stocks (as they did near the end of last year). To the contrary, rising foreign stocks are now supporting...
READ MORE
MEMBERS ONLY
Week Ahead: Markets Placed On Tricky Turf; Would Be Sensible To Stick To Defensive Stocks
by Milan Vaishnav,
Founder and Technical Analyst, EquityResearch.asia and ChartWizard.ae
The Indian equity markets had a volatile week, ultimately ending on a flat note. In our previous weekly outlook, we had mentioned the possibility of the market stalling its up-move and showing some corrective intent. After volatile trading throughout the week, it was the last hour of trade on Friday...
READ MORE