MEMBERS ONLY
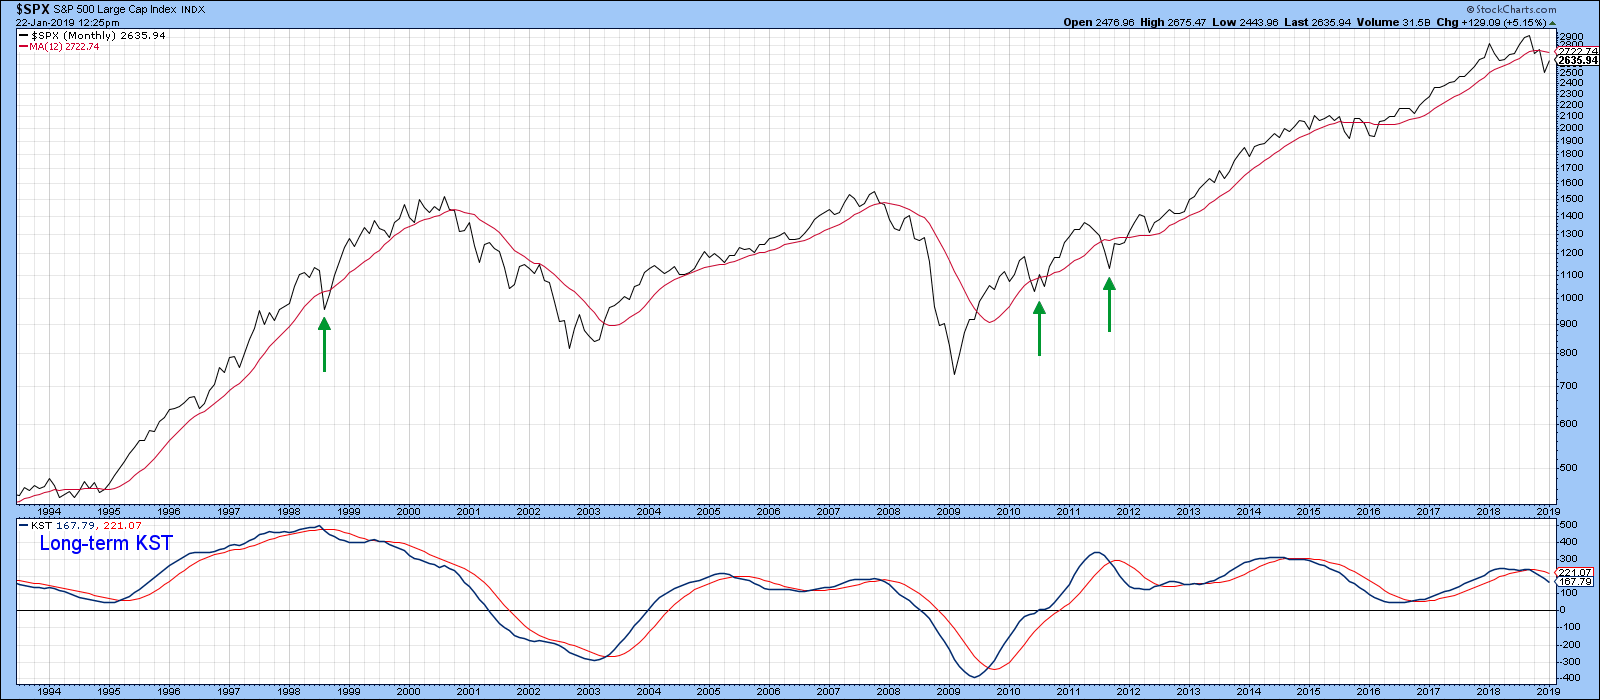
Where's That Test Of The December Low?

by Martin Pring,
President, Pring Research
* Long-Term Trend Still Points South
* It Would be Unusual Not to Experience a Test of the December Low
* Dollar ETF Breaking Out?
Last week, I pointed out that the major averages were running into resistance at a moment when they were moderately overbought. At the time, some form of a...
READ MORE
MEMBERS ONLY
Transportation Stocks Hold A Big Clue This Week

by Tom Bowley,
Chief Market Strategist, EarningsBeats.com
Market Recap for Friday, January 18, 2019
Continuing anticipation of a trade deal with China appeared to fuel very solid stock market action on Friday as all of our major indices pushed higher, as did all 11 sectors. The Dow Jones and S&P 500 led the charge, gaining...
READ MORE
MEMBERS ONLY

To Chase or Not to Chase?

by Arthur Hill,
Chief Technical Strategist, TrendInvestorPro.com
* Volume is not What is Used to Be.
* 2008: Bear Bounce and Bullish Setup.
* 2010: Big Bounce and Big Pullback.
* 2011: Retracement and Bull Flag.
* 2014: October Volatility.
* 2015: Volatility and BREXIT Vote.
* 2019: What Now?
* On Trend on StockChartsTV.
... Volume is not What is Used to Be
... I went...
READ MORE
MEMBERS ONLY
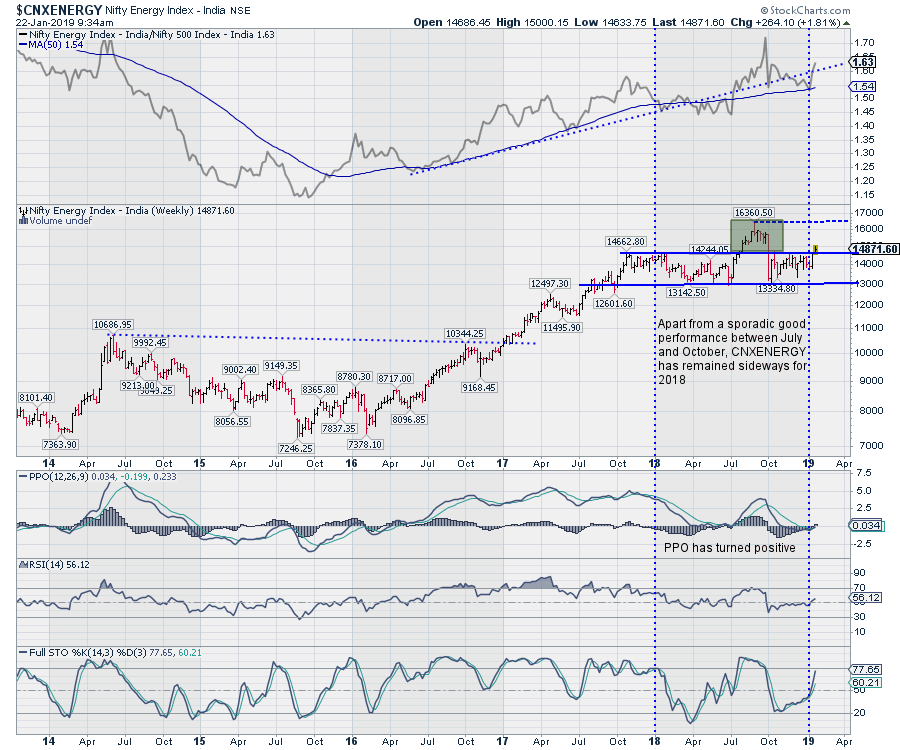
NIFTY Energy Sector Looks Up

by Milan Vaishnav,
Founder and Technical Analyst, EquityResearch.asia and ChartWizard.ae
As the Indian equity markets remain under under an area formation, a clear breakout will continue to elude the NIFTY unless it can move past the 10950 level. With the markets still trapped in a range, the NIFTY Energy Index ($CNXNIFTY) provides some interesting observations.
The NIFTY Energy Index formed...
READ MORE
MEMBERS ONLY
3 Stocks Awaiting A Possible Earnings Explosion
by Tom Bowley,
Chief Market Strategist, EarningsBeats.com
Analysts meet with the management teams of companies and then return to their firms and either buy or sell based on the information they gather. It's the primary reason why technical price action precedes fundamental information. If you understand the dynamics on Wall Street, you're in...
READ MORE
MEMBERS ONLY
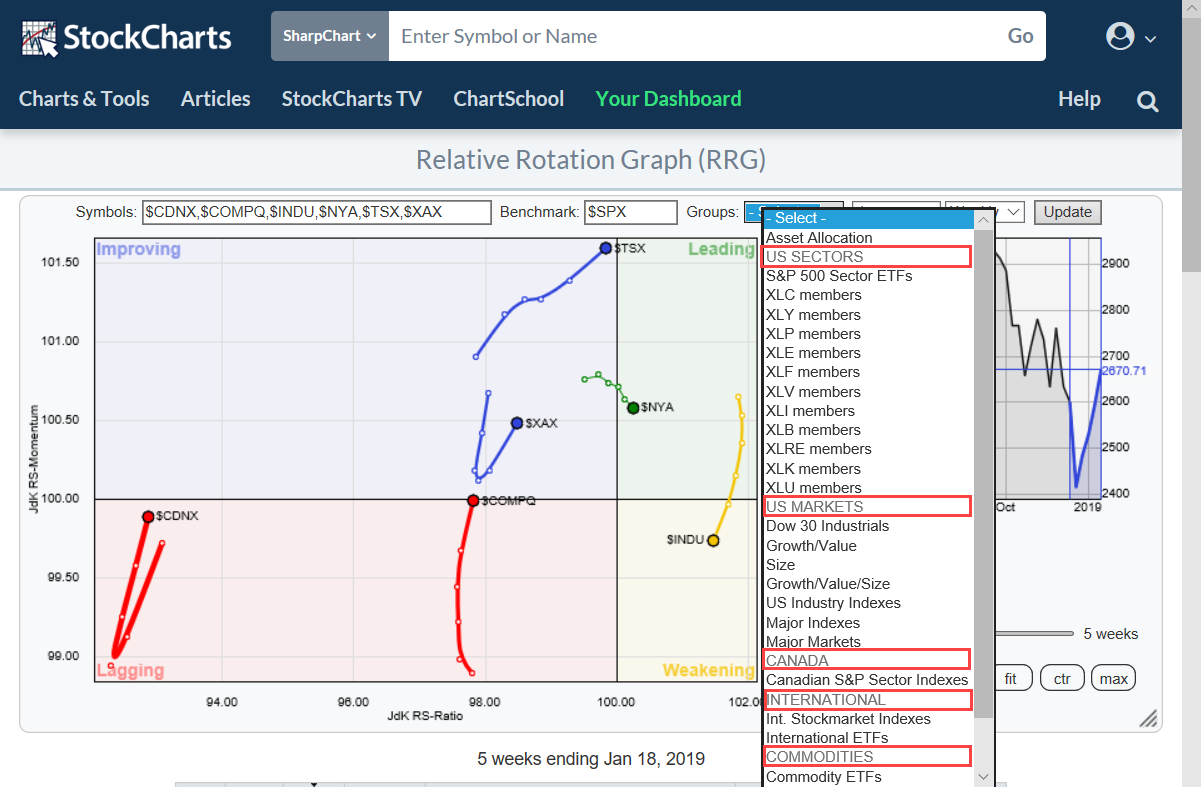
New Pre-Defined Groups And A Look At FAANG Stocks On Relative Rotation Graphs

by Julius de Kempenaer,
Senior Technical Analyst, StockCharts.com
If you are a regular user of Relative Rotation Graphs you are probably aware of the pre-defined groups (universes) that you can choose from when you open the drop-down box at the top op the chart.
In order to make life easier (for our users) and provide structure, I am...
READ MORE
MEMBERS ONLY
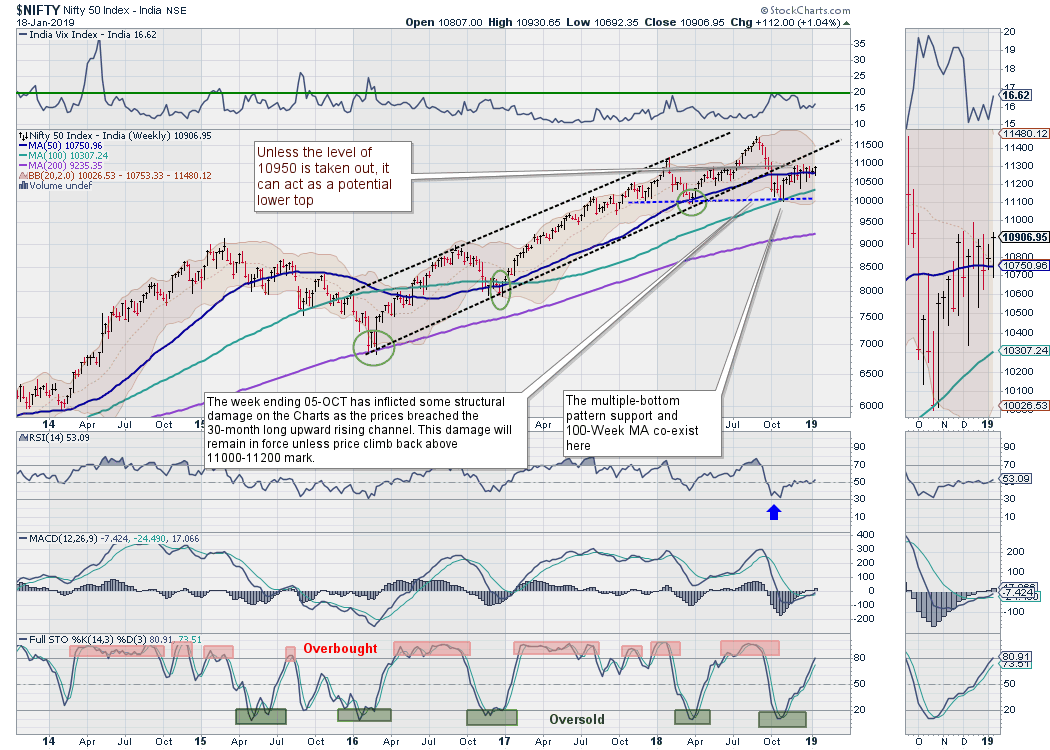
Week Ahead: NIFTY Looks At Taking A Decisive Directional Call In The Coming Week
by Milan Vaishnav,
Founder and Technical Analyst, EquityResearch.asia and ChartWizard.ae
The past week saw the market remaining range-bound, oscillating inside a 250-point range and ultimately ending with a modest gain. Though the market did not take any directional call on either side, it saw significant amount of volatility within the defined range. While holding on to the 50-Week MA level,...
READ MORE
MEMBERS ONLY

Separating the Contenders from the Pretenders
by Arthur Hill,
Chief Technical Strategist, TrendInvestorPro.com
The S&P 500 is in the midst of a big run that lifted most boats, especially financial stocks. Even though these stocks are leading with the biggest gains over the last three weeks, most big financials are still in downtrends overall and below their 200-day SMAs.
Take Citigroup...
READ MORE
MEMBERS ONLY
January Stock Rebound Continues

by John Murphy,
Chief Technical Analyst, StockCharts.com
Editor's Note: This article was originally published in John Murphy's Market Message on Friday, January 18th at 11:01am ET.
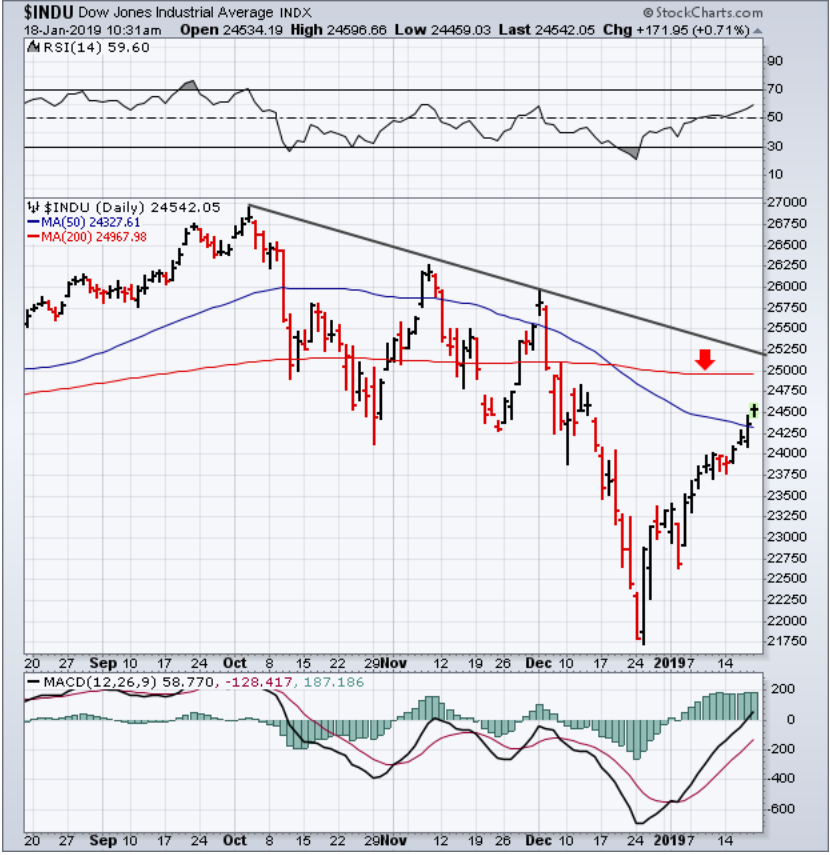
All major U.S. stock indexes have exceeded their 50-day averages (blue lines). That still leaves their 200-day averages to contain the rally. But there are...
READ MORE
MEMBERS ONLY
DP Weekly Wrap: Trade News Dominates; Technicals Lurk

by Carl Swenlin,
President and Founder, DecisionPoint.com
Just last week I wrote: There are two impending fundamental events to which the market is likely to react positively: (1) resolution of the trade issues with China; and (2) ending the government shutdown. Assuming that either event actually comes to pass, positive short-term reaction can be expected from either...
READ MORE
MEMBERS ONLY
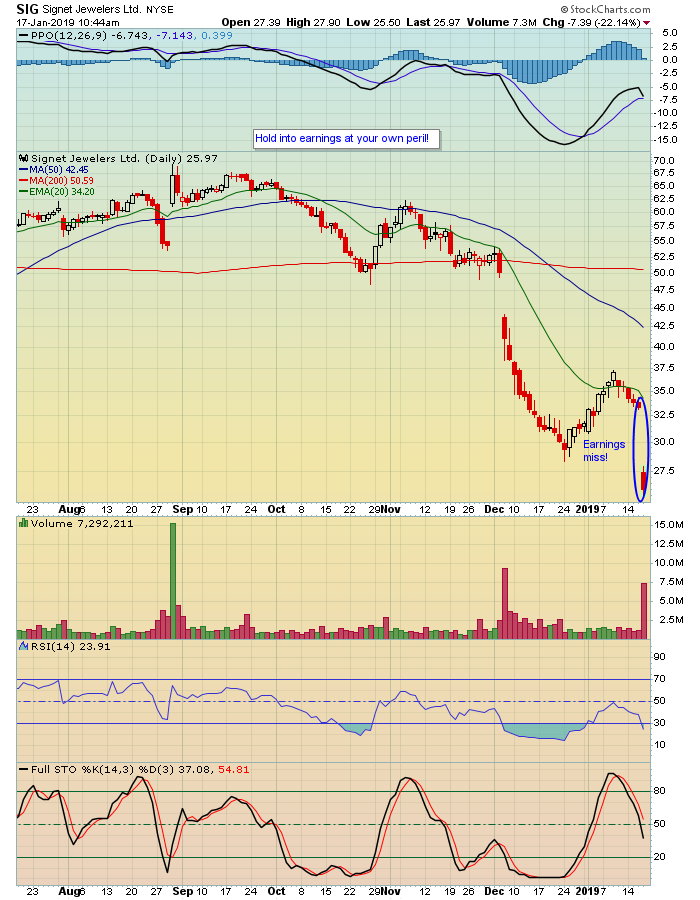
Earnings Season Kicks into High Gear - Be Prepared to Profit

by John Hopkins,
President and Co-founder, EarningsBeats.com
Earnings season began in earnest last week, with major financial companies being rewarded and helping to lead the market higher. It's one of four time periods during the year when publicly traded companies share their earnings results so that investors can get a sense of the financial health...
READ MORE
MEMBERS ONLY
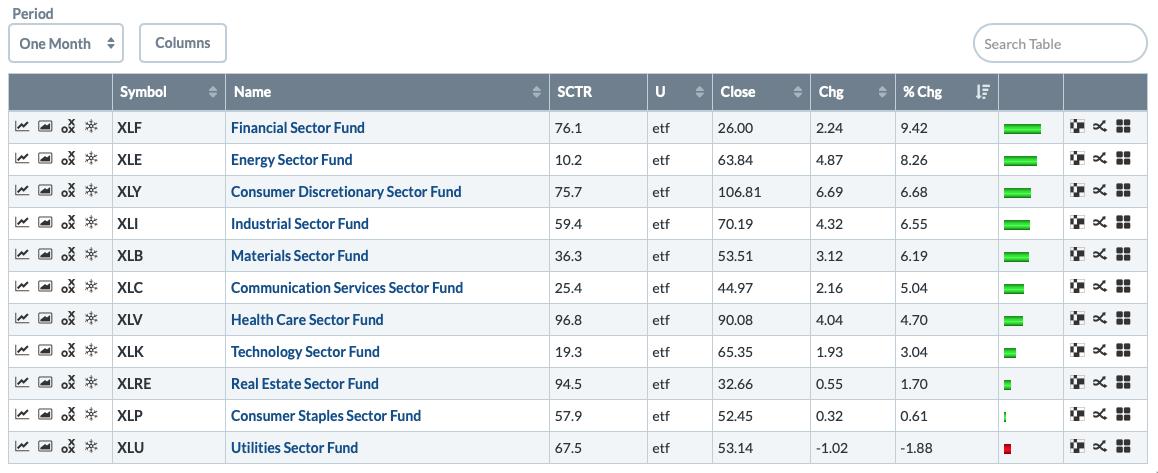
Utilities Sector (XLU) Lights Up a New PMO BUY Signal

by Erin Swenlin,
Vice President, DecisionPoint.com
Sector rotation continues to favor the defensive sectors of Health Care, Consumer Staples, Real Estate and Utilities. Some of the more aggressive sectors are perking up now, with Financials actually making the biggest gain of the past month. Utilities in that same timeframe haven't done so much, but,...
READ MORE
MEMBERS ONLY

Weekly Market Review & Outlook (with video) - A One Legged Chair
by Arthur Hill,
Chief Technical Strategist, TrendInvestorPro.com
* Finance Does the Heavy Lifting.
* One out of Four is Not Enough.
* New Highs Remain Subdued.
* Majority of Stocks in Long-term Downtrends.
* The Lone Breadth Thrust.
* Bear Market Environments.
* Strength Outside of U.S. Stocks.
* Separating the Contenders from the Pretenders.
* Growth Stocks with Strong Charts.
... Finance Does the Heavy...
READ MORE
MEMBERS ONLY

JANUARY STOCK REBOUND CONTINUES -- STOCK INDEXES HAVE CLEARED THEIR 50-DAY MOVING AVERAGES -- OVERHEAD RESISTANCE LINES STILL HAVE TO BE TESTED -- INCLUDING THEIR 200-DAY AVERAGES
by John Murphy,
Chief Technical Analyst, StockCharts.com
MAJOR U.S. STOCK INDEXES NEAR TEST OF OVERHEAD RESISTANCE ... All major U.S. stock indexes have exceeded their 50-day averages (blue lines). That still leaves their 200-day averages to contain the rally. But there are a couple of other resistance lines that still need to be tested. Chart 1...
READ MORE
MEMBERS ONLY
The Ultimate Test For The Bears Is Here
by Tom Bowley,
Chief Market Strategist, EarningsBeats.com
Market Recap for Thursday, January 17, 2019
Word that the U.S. would ease Chinese tariffs as negotiations wear on helped to reduce stock market stress and resulted in an intraday surge in U.S. equity prices on Thursday afternoon. Quick profit taking followed, but strength resumed into the close...
READ MORE
MEMBERS ONLY
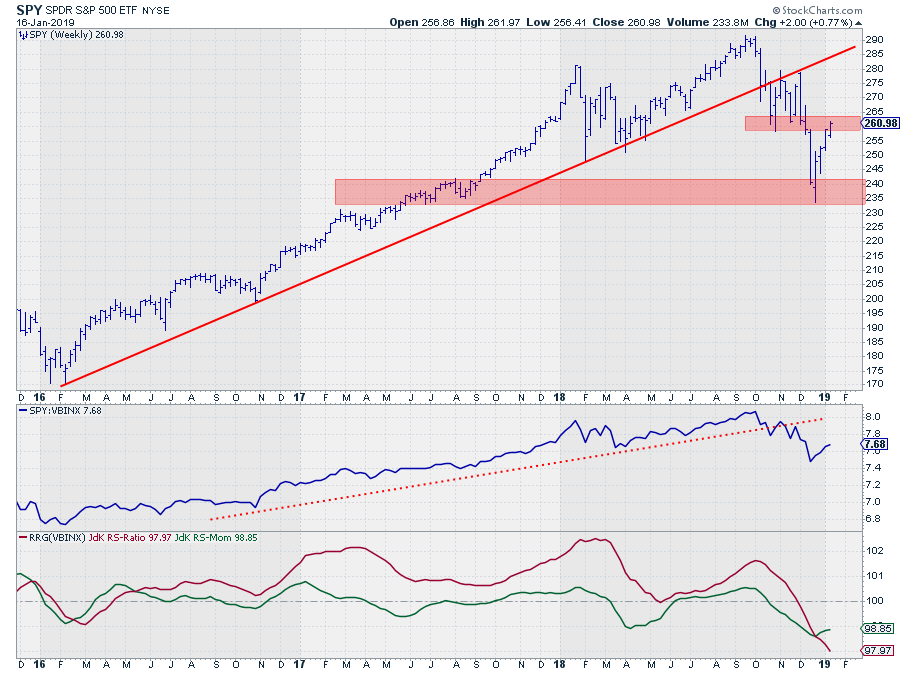
SPY Arrived In "Trouble Territory"
by Julius de Kempenaer,
Senior Technical Analyst, StockCharts.com
After the sharp sell-off in Q4 of last year, the market (SPY) started to recover from its lows near 235. And IMHO it is still a "recovery" before turning down again as opposed to a "turnaround" back up.
This weekly chart above clearly shows that the...
READ MORE
MEMBERS ONLY

A Five Step Bearish Setup for ABC
by Arthur Hill,
Chief Technical Strategist, TrendInvestorPro.com
AmerisourceBergen (ABC) started the day strong and rose with the broader market, but turned south in the afternoon and formed a bearish engulfing. This bearish candlestick reversal looks especially ominous because it formed near the minimum retracement and with the Commodity Channel Index (CCI) overbought.
The chart shows ABC breaking...
READ MORE
MEMBERS ONLY

How This Organized Process Will Maximize Your Investing Analysis - ChartPack Update #22 (Q4, 2018)

by Gatis Roze,
Author, "Tensile Trading"
Yes — since 2013, our ChartPack user community has suggested thousands of powerful improvements to our quarterly presentation of ChartLists. Over these six years, StockCharts.com has grown mightily and many new members are not entirely clear what the Tensile Trading ChartPack actually is. So here are seven brief points to...
READ MORE
MEMBERS ONLY

Bear Markets and Drawdowns - 2

by Greg Morris,
Veteran Technical Analyst, Investor, and Author
This is a continuation of the previous article. The Dow Jones Industrial Average, also referred to as The Dow by the financial media, is a price-weighted measure of 30 U.S. blue-chip companies. The Dow covers all industries with the exception of transportation and utilities, which are covered by the...
READ MORE
MEMBERS ONLY
Solid Earnings Lift Financials, Wall Street
by Tom Bowley,
Chief Market Strategist, EarningsBeats.com
Market Recap for Wednesday, January 16, 2019
Late-day selling cut into some of Wall Street's gains, but the bear market rally continued. It's left many wondering whether we're still in a bear market. The technical answer to that question is yes, we're...
READ MORE
MEMBERS ONLY
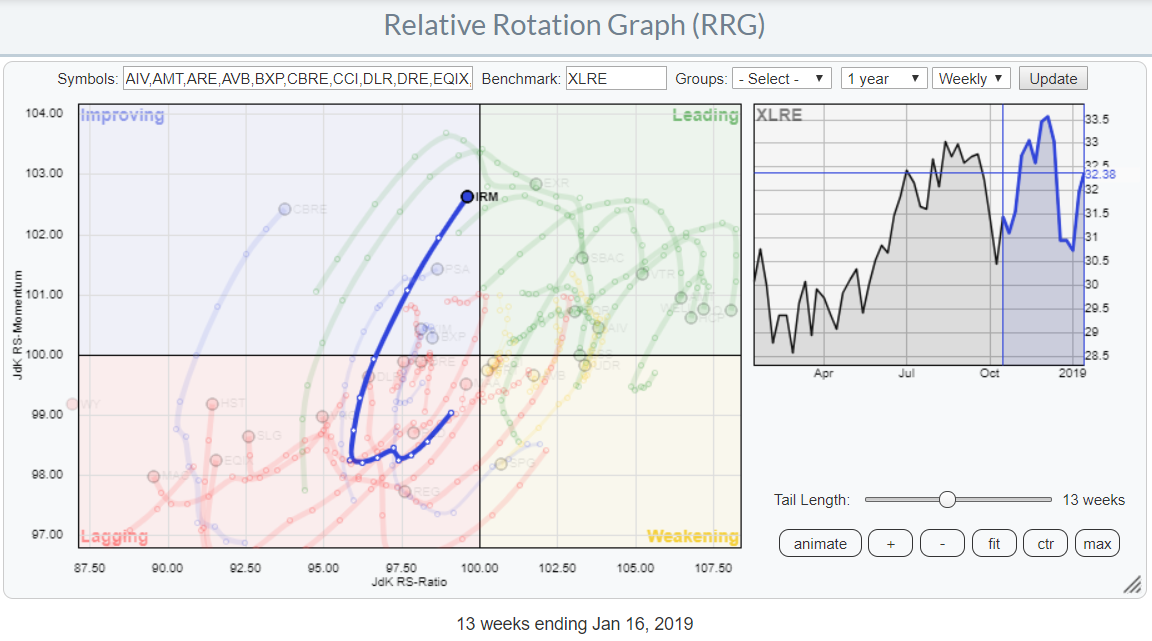
Long Tail And Strong RRG-Heading For IRM
by Julius de Kempenaer,
Senior Technical Analyst, StockCharts.com
The Relative Rotation Graph above highlights the rotation of IRM (Iron Mountain Inc.) in comparison to the other stocks in the S&P Real-Estate sector (XLRE).
The sector itself is interesting to keep an eye on as it is positioned well inside the leading quadrant but rolling over, at...
READ MORE
MEMBERS ONLY

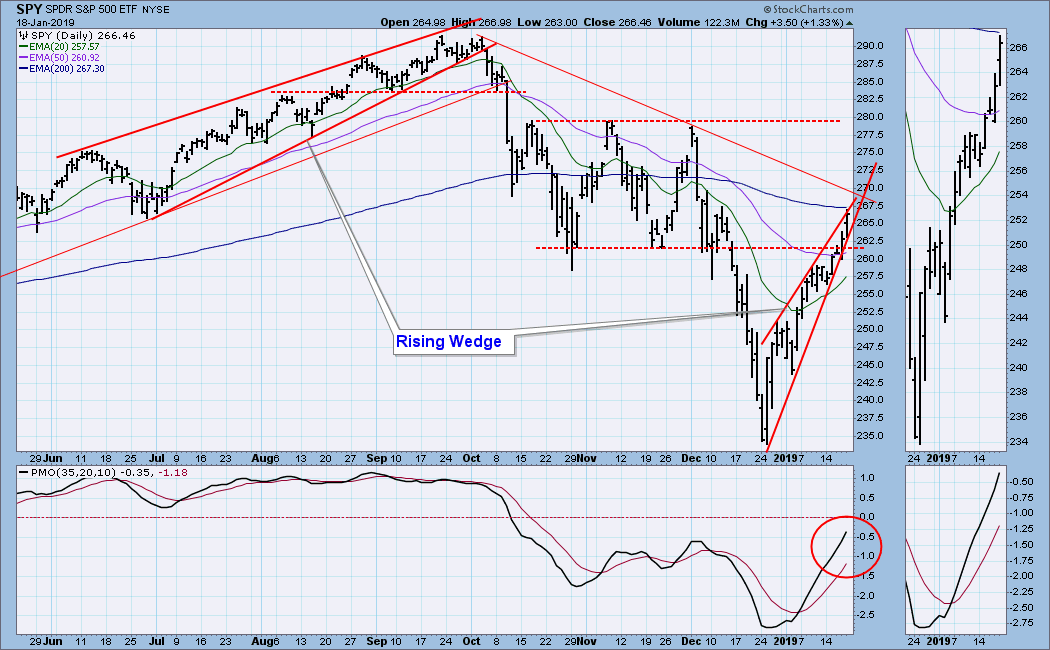
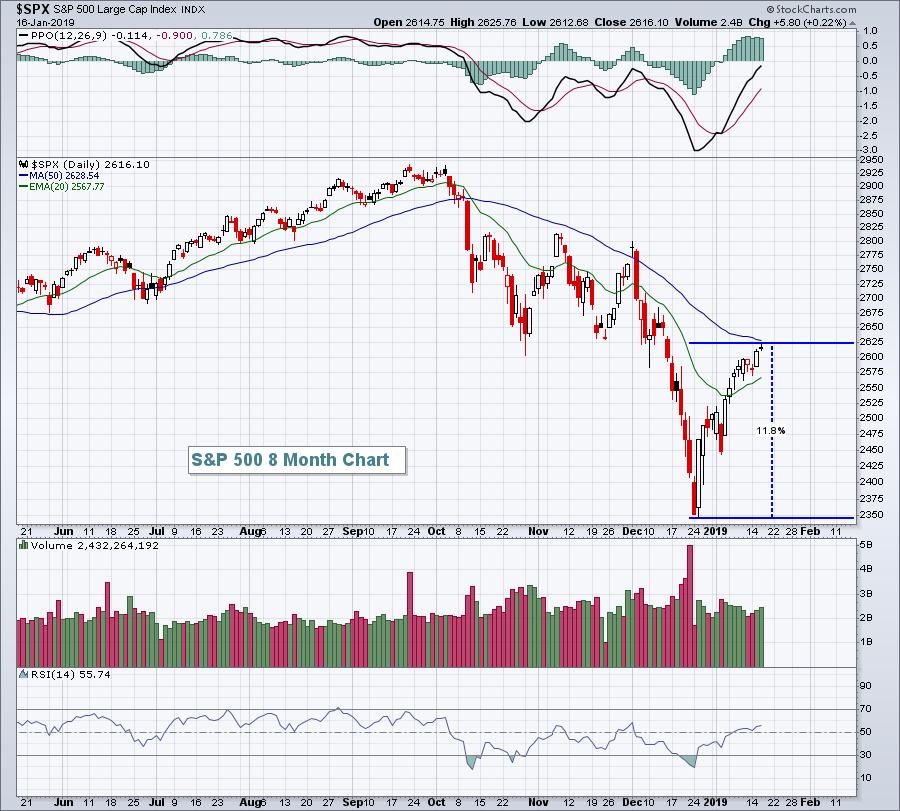
DP Alert: Short-Term Indicators and Mature Rising Wedge Suggest a Downturn
by Erin Swenlin,
Vice President, DecisionPoint.com
Right now, our short-term indicators (and even our climactic ones) are suggesting decline. The rising wedge formation on the SPX is quite bearish, but I also see it as being "mature." This means that price is getting very close to the apex of the wedge. I'll...
READ MORE
MEMBERS ONLY

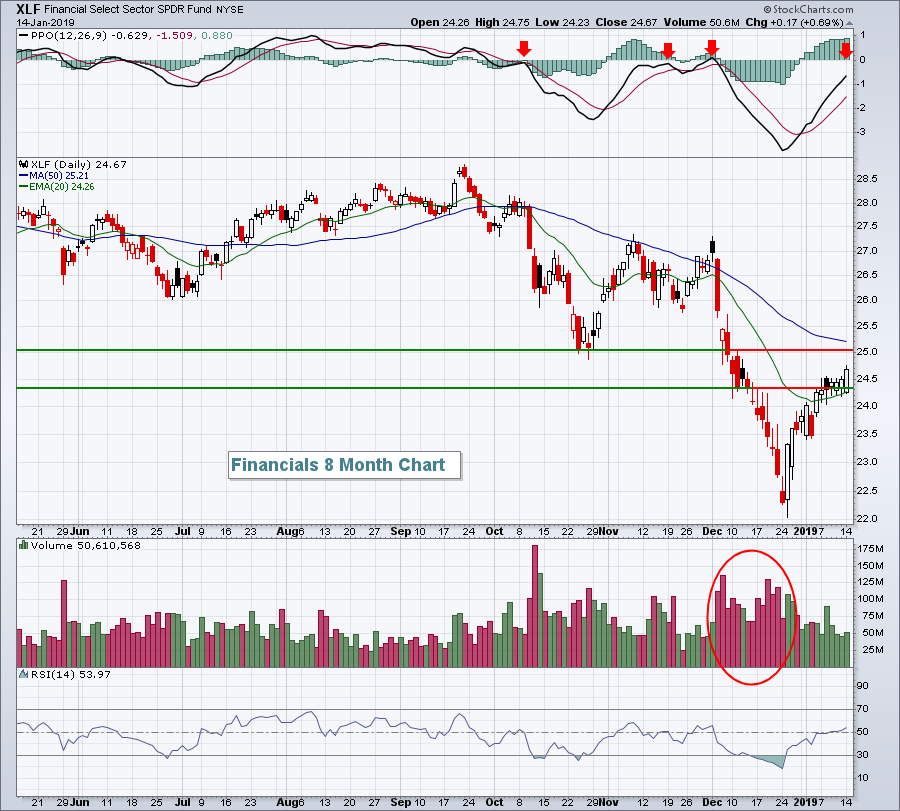
FINANCIAL STOCKS LEAD MARKET HIGHER -- OVERSOLD READINGS SUPPORT A RALLY -- BUT THEIR MAJOR TREND IS STILL DOWN -- THE S&P 500 NEARS OVERHEAD RESISTANCE WHILE THE VIX TESTS SUPPORT
by John Murphy,
Chief Technical Analyst, StockCharts.com
FINANCIAL SPDR CLEARS 50-DAY AVERAGE ... After months of poor absolute and relative performance, financial stocks are starting to show some upside leadership. The daily bars in Chart 1 show the Financial Sector SPDR (XLF) gapping higher today and trading above its 50-day moving average (blue circle). That would be enough...
READ MORE
MEMBERS ONLY

Big Sectors Drive Short-term Breakout in SPY
by Arthur Hill,
Chief Technical Strategist, TrendInvestorPro.com
* Stocks Bid to Extend Higher.
* SPY Enters the Prior Consolidation.
* Big Sectors Join the Breakout Parade.
... The S&P 500 SPDR (SPY) and several sector SPDRs broke out of short-term consolidations in a bid to extend the upswing that began on December 26th. While I remain in the bearish...
READ MORE
MEMBERS ONLY
10 S&P 500 Stocks That Seasonally Outperform From February Through April
by Tom Bowley,
Chief Market Strategist, EarningsBeats.com
Market Recap for Tuesday, January 15, 2019
We saw an across-the-board advance led by healthcare (XLV, +1.80%), communication services (XLC, +1.66%) and technology (XLK, +1.51%). All of our major indices jumped as NASDAQ shares soared by 1.71%. The S&P 500 rose 1.07%. After...
READ MORE
MEMBERS ONLY

Palo Alto Networks Breaks from the Pack
by Arthur Hill,
Chief Technical Strategist, TrendInvestorPro.com
Most stocks have struggled since November, but Palo Alto Networks managed to reverse at a key area and break above a resistance zone.
The chart below shows PANW with weekly bars over the last 3 years. The stock broke to new highs in February 2018 and more than doubled from...
READ MORE
MEMBERS ONLY

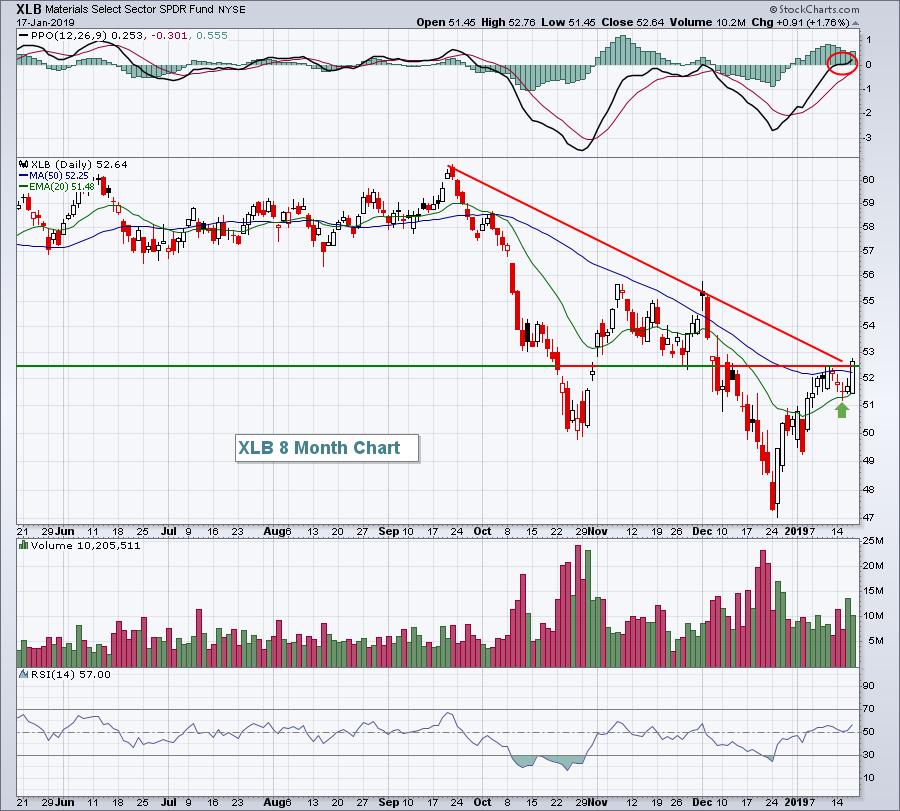
And the Winning Sector is....
by Erin Swenlin,
Vice President, DecisionPoint.com
I decided to review the Sector Summary, Sector CandleGlance Charts and our DP Sector Scoreboard to see which sector(s) were "winners." In all honesty, depending on the timeframe, various sectors rein supreme. However, there is one particular sector that has performed well across all timeframes.
Let'...
READ MORE
MEMBERS ONLY

Forget the Price and Anchor to the Trend

by David Keller,
President and Chief Strategist, Sierra Alpha Research
Anchoring is a behavioral phenomenon wherein we, as people, lock in to a specific reference point that then affects our subsequent decisions.
When I taught technical analysis at Brandeis University, I asked one group of students to tell me where the S&P 500 would be at the end...
READ MORE
MEMBERS ONLY
Banks Rally On Citigroup's Results, But Likely To Struggle Today With JP Morgan's
by Tom Bowley,
Chief Market Strategist, EarningsBeats.com
Market Recap for Monday, January 14, 2019
The losses on Monday were not huge, but there did seem to be selling in most areas of the market. 10 of 11 sectors finished lower as financials (XLF, +0.69%) was the only sector to finish in positive territory. That sector'...
READ MORE
MEMBERS ONLY

Market Hits Resistance, So What's Next?
by Martin Pring,
President, Pring Research
* Averages Reach Resistance
* Selected Emerging Markets Starting to Look Interesting
Last week, I wrote that, while my view on the primary trend remained bearish, I thought the lows established a couple of weeks or so ago stood a good chance of holding for a while. That view was based on...
READ MORE
MEMBERS ONLY

Coca-Cola Loses Some Fizz
by Arthur Hill,
Chief Technical Strategist, TrendInvestorPro.com
Stocks surged over the last 12 days with the S&P 500 gaining over 10% and moving above its late December high. Coca-Cola (KO) was leading the market with a new high in November, but did not partake in the broad market rally here in January. SPY is up...
READ MORE
MEMBERS ONLY

The 800-pound Gorilla Hits Resistance
by Arthur Hill,
Chief Technical Strategist, TrendInvestorPro.com
I highlighted the confluence of data points that argue for resistance in the S&P 500 last week and would like to review this as we start a new week. Note that I only focus on resistance when the bigger trend is down. Why? Because resistance levels have a...
READ MORE
MEMBERS ONLY
Will Earnings Sustain The Current Rally? Probably Not
by Tom Bowley,
Chief Market Strategist, EarningsBeats.com
Market Recap for Friday, January 11, 2019
Healthcare (XLV, +0.33%) and consumer staples (XLP, +0.29%) paced a bifurcated market on Friday as the Russell 2000 eked out a 2 point gain. Despite rallying most of the session after a poor start, the Dow Jones, S&P 500...
READ MORE
MEMBERS ONLY
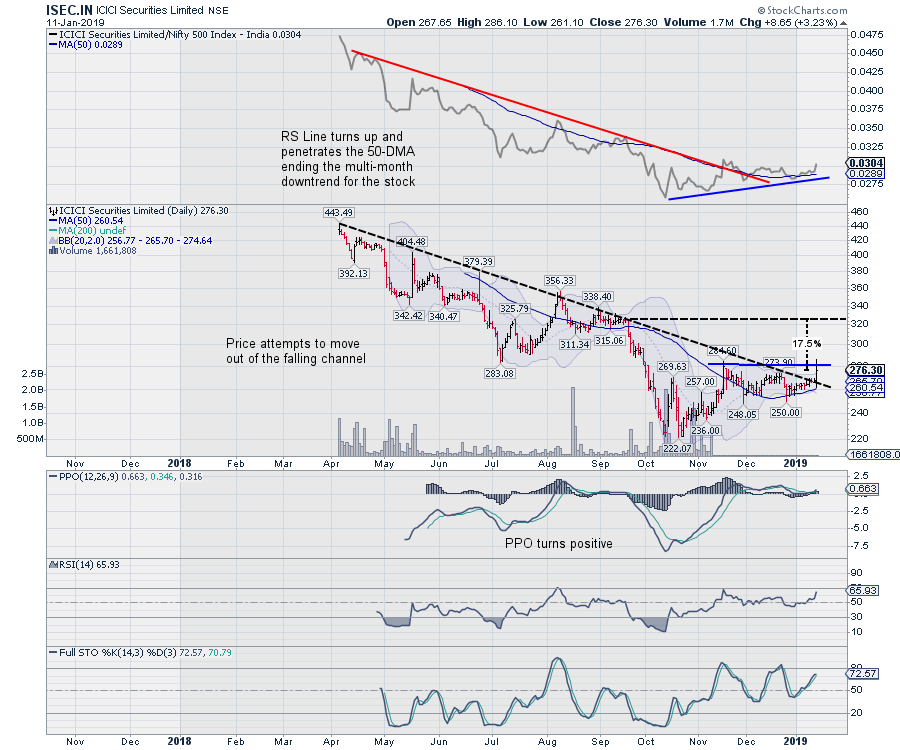
ICICI Securities: Interesting Days Ahead
by Milan Vaishnav,
Founder and Technical Analyst, EquityResearch.asia and ChartWizard.ae
ICICI Securities Ltd. (ISEC.IN)
In addition to being the pioneers in the e-brokerage business in India, ICICI Securities is a technology-based firm offering a wide range of financial services including investment banking, institutional broking, retail broking, private wealth management and financial product distribution.
The stock has a short listing...
READ MORE
MEMBERS ONLY
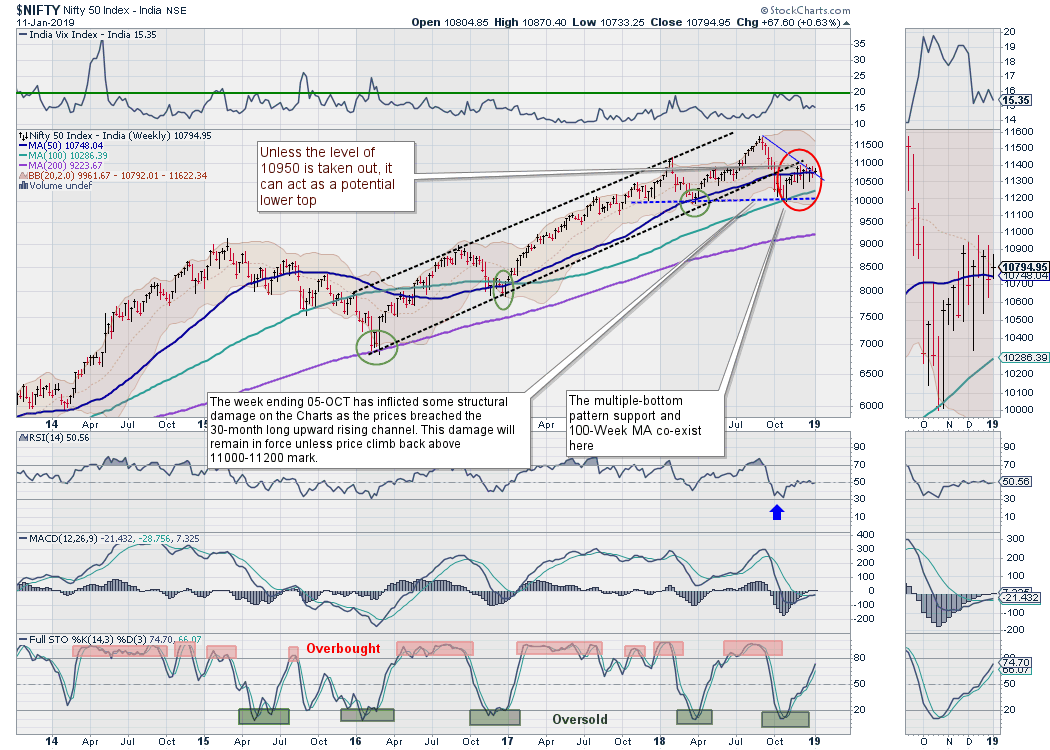
NIFTY Mildly Penetrates The 50-Week MA; Moving Past These Levels is Necessary For A Sustained Up-Move
by Milan Vaishnav,
Founder and Technical Analyst, EquityResearch.asia and ChartWizard.ae
It was a volatile end to the week as the NIFTY index oscillated in a 100-point range on Friday, finally settling with a modest loss after rebounding from the lower levels. Just like the week before, no major downsides were seen. The NIFTY just barely managed to pierce the 50-Week...
READ MORE
MEMBERS ONLY
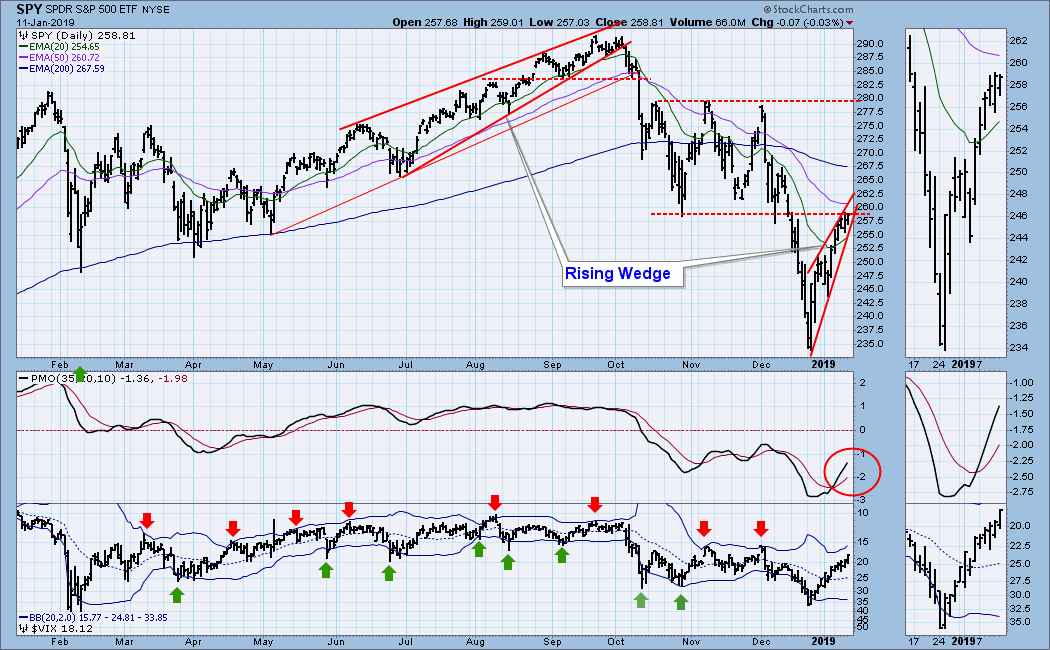
DP Weekly Wrap: Expect Breakdown from Rising Wedge
by Carl Swenlin,
President and Founder, DecisionPoint.com
One of my favorite chart patterns is the wedge. Rising or falling, they arrive frequently and usually resolve predictably. On this chart there happen to be two rising wedge formations. The first one led us into the bull market top in September/October of 2018. It resolved downward, as expected,...
READ MORE
MEMBERS ONLY

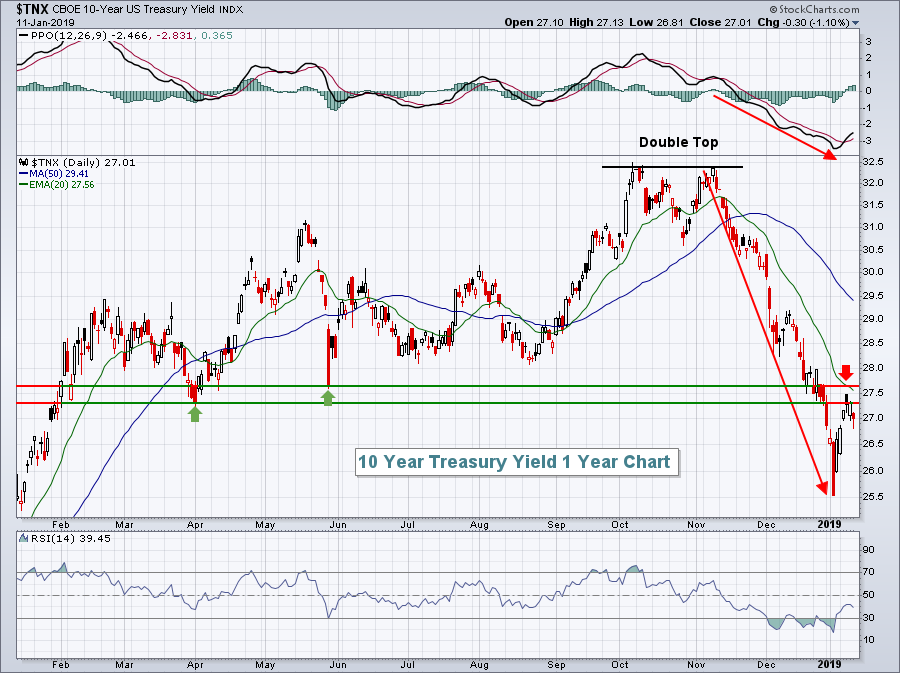
RATIO ANALYSIS SHOWS A MAJOR SHIFT OUT OF STOCKS AND INTO BONDS -- ALL BOND CATEGORIES OUTPERFORMED STOCKS SINCE OCTOBER -- TREASURIES ARE DOING BETTER THAN INVESTMENT GRADE CORPORATES -- WHILE HIGH YIELD JUNK BONDS ARE THE WEAKEST BOND CATEGORY
by John Murphy,
Chief Technical Analyst, StockCharts.com
COMPARISON OF TWO VANGUARD FUNDS SHOWS BONDS IN THE LEAD ... In good times when investors are confident about the economy, they usually favor stocks over bonds. One of the ways we can tell when investors are starting to lose confidence is when they start favoring bond holdings over stocks. And...
READ MORE
MEMBERS ONLY

Weekly Market Review & Outlook (with Video) - Looking Outside the U.S. Stock Market
by Arthur Hill,
Chief Technical Strategist, TrendInvestorPro.com
* Big Markets in Big Downtrends.
* Bullish Breadth Surge.
* Counting New Highs on One Hand.
* Vast Majority of Stocks in Downtrends.
* A Return to the Breakdown.
* A Potential Reversal Area.
* Finding Pockets of Strength.
* India Starts to Drag.
* Indonesia Extends on Breakout.
* New Zealand Holds above October Lows.
* Singapore Dollar Surges....
READ MORE
MEMBERS ONLY
Bear Markets and Drawdowns
by Greg Morris,
Veteran Technical Analyst, Investor, and Author
The month of December 2018 was a bad month for the market; the rally in the last week of the month was nice but small compared to the month’s decline. 2019 has so far continued the upward move, so I thought it was time to show some data on...
READ MORE
MEMBERS ONLY

Relative Rotation Graphs And Factor ETFs
by Julius de Kempenaer,
Senior Technical Analyst, StockCharts.com
It's Friday morning in Amsterdam and I just dropped my daughter off at school. On the way to my office, I usually stop at the local Coffee Company for a cappuccino and reading some, market-related, news, blogs etc.
For some reason, I noticed a lot of talk and...
READ MORE