MEMBERS ONLY
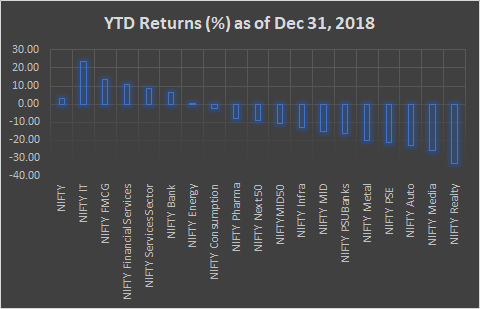
Special Note: The Year That Was & Sectors to Look At In 2019

by Milan Vaishnav,
Founder and Technical Analyst, EquityResearch.asia and ChartWizard.ae
The last trading session of 2018 was rather dull, with the markets ending on a flat note. The year itself, however, stood in stark contrast to its last trading day. Throughout the previous year, the NIFTY was consistently affected by events both global and domestic in nature. These included, among...
READ MORE
MEMBERS ONLY

Sector SPDRs Firm with a Few Piercing Patterns

by Arthur Hill,
Chief Technical Strategist, TrendInvestorPro.com
Stocks rebounded last week and recovered part of their losses from the prior week. Long black candlesticks formed the week before Christmas and most sector SPDRs recovered with long white candlesticks the following week. A black candlestick forms when the close is below the open, while a white candlestick forms...
READ MORE
MEMBERS ONLY

The NASDAQ Composite Stumbles into 2019

by Bruce Fraser,
Industry-leading "Wyckoffian"
For stock indexes, 2018 started dramatically and ended with even more drama. In January a Buying Climax (BC) stopped the long term uptrend of stock indexes and a sharp Automatic Reaction (AR) produced an important Change of Character from a trending into a trading range market environment. This sequence of...
READ MORE
MEMBERS ONLY
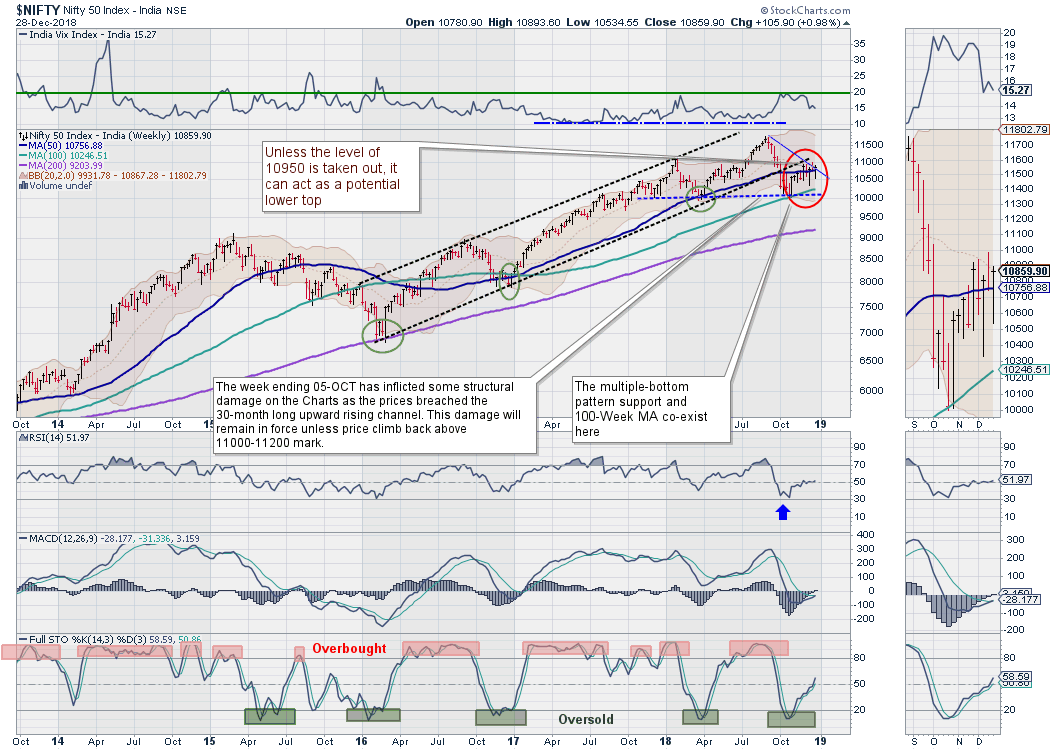
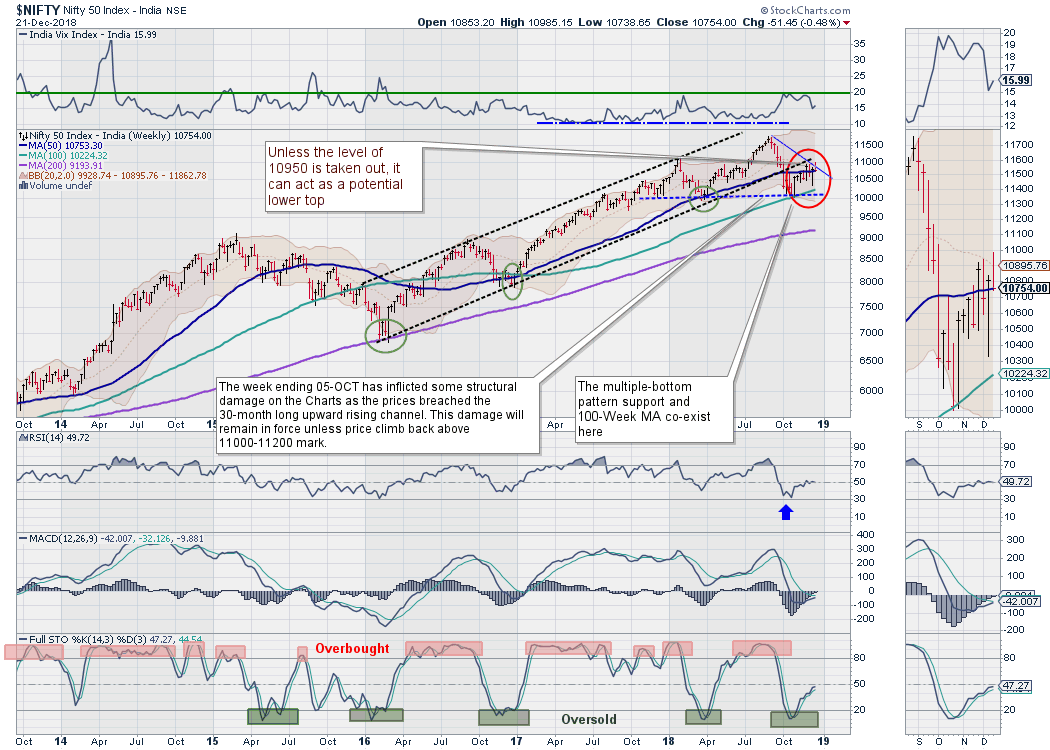
First Week Of 2019 To See NIFTY Remain Indecisively Bullish; Moving Past 10950 Still Important
by Milan Vaishnav,
Founder and Technical Analyst, EquityResearch.asia and ChartWizard.ae
Over the past week, the markets continued to deal with overhead resistances on expected lines. Once again, it was a volatile week, with the NIFTY oscillating in a wide range as it dealt with a couple of important resistance levels on the charts. The benchmark index has attempted to penetrate...
READ MORE
MEMBERS ONLY
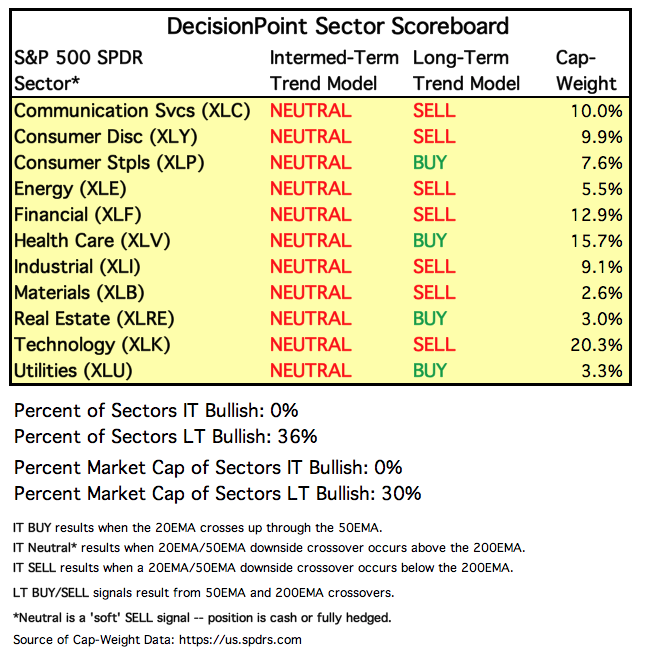
DP Weekly/Monthly Wrap: Unanimously Not Bullish

by Carl Swenlin,
President and Founder, DecisionPoint.com
On Friday the signal for the Utilities sector changed from BUY to NEUTRAL, making it the last of the 11 S&P 500 sectors to lose its bullish stance. NEUTRAL sounds kind of, well, neutral, but it is really a 'soft' SELL signal because the position changes...
READ MORE
MEMBERS ONLY

Help! I've Fallen and I Can't Get Up

by Greg Morris,
Veteran Technical Analyst, Investor, and Author
Well, what do you think of 2018 so far? As a trend follower, it has been difficult. Reminds me of 2011, which happened to be the worst year my 25-year-old model has ever had. Chart A shows the Dow Jones Industrial Average for all of 2011 with some data before...
READ MORE
MEMBERS ONLY
Afternoon Strength Lifts Wall Street For 2nd Consecutive Session

by Tom Bowley,
Chief Market Strategist, EarningsBeats.com
Market Recap for Thursday, December 27, 2018
The final two hours on Wall Street yesterday was quite the finish. After languishing deep in red territory throughout much of the session, the bulls took complete charge into the close. The Dow Jones, down more than 600 points just past 2pm EST,...
READ MORE
MEMBERS ONLY
Support Has Been Established, Now How High Might We Bounce?
by Tom Bowley,
Chief Market Strategist, EarningsBeats.com
Market Recap for Wednesday, December 26, 2018
After gapping higher on Wednesday, our major indices retreated initially to lose all of its opening gains. The Dow Jones traded approximately 300 points higher right out of the gates, but within 90 minutes had lost those gains and was down 80 points....
READ MORE
MEMBERS ONLY
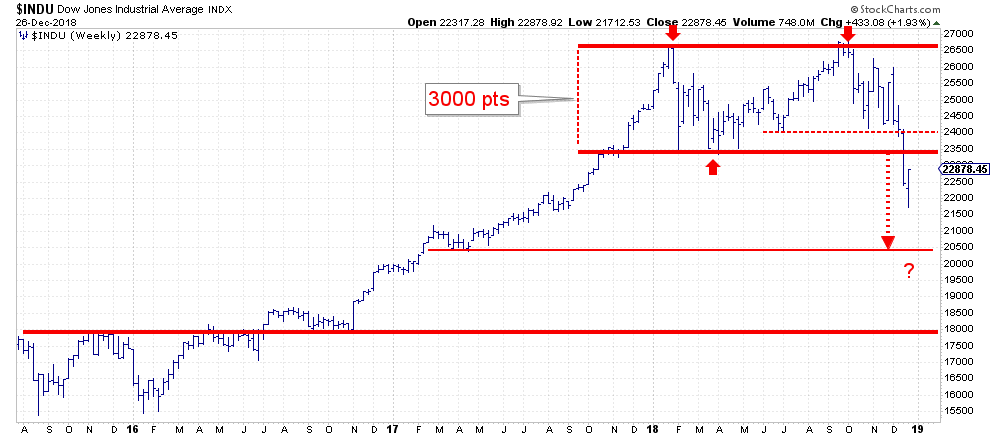
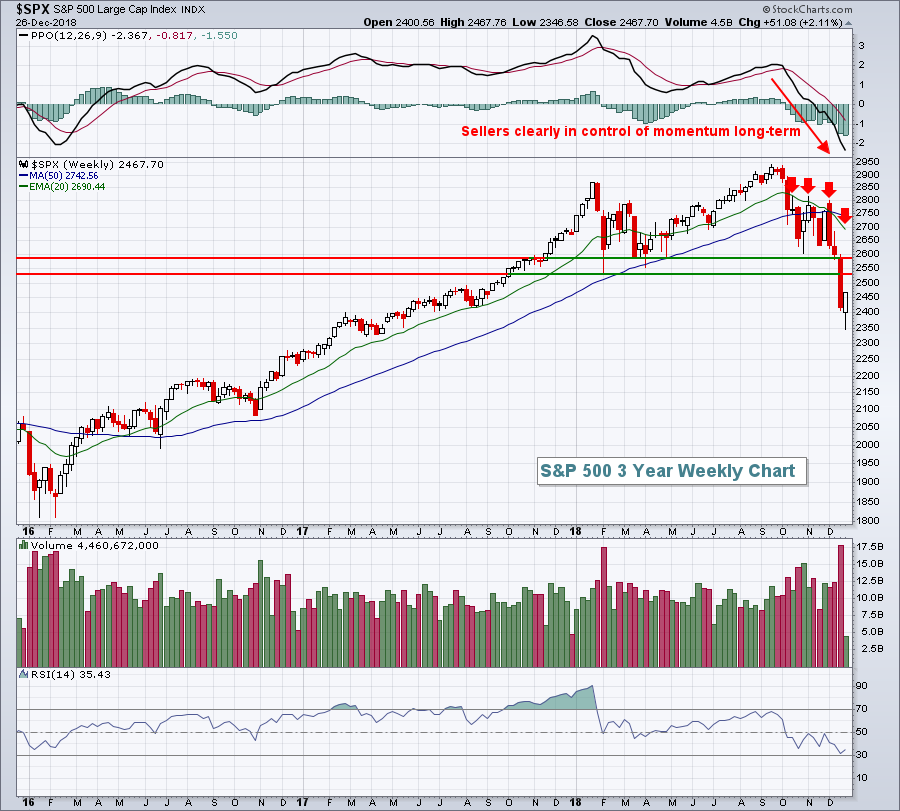
Okay, So You Rallied 1000 Points...? That Don't Impress Me Much.

by Julius de Kempenaer,
Senior Technical Analyst, StockCharts.com
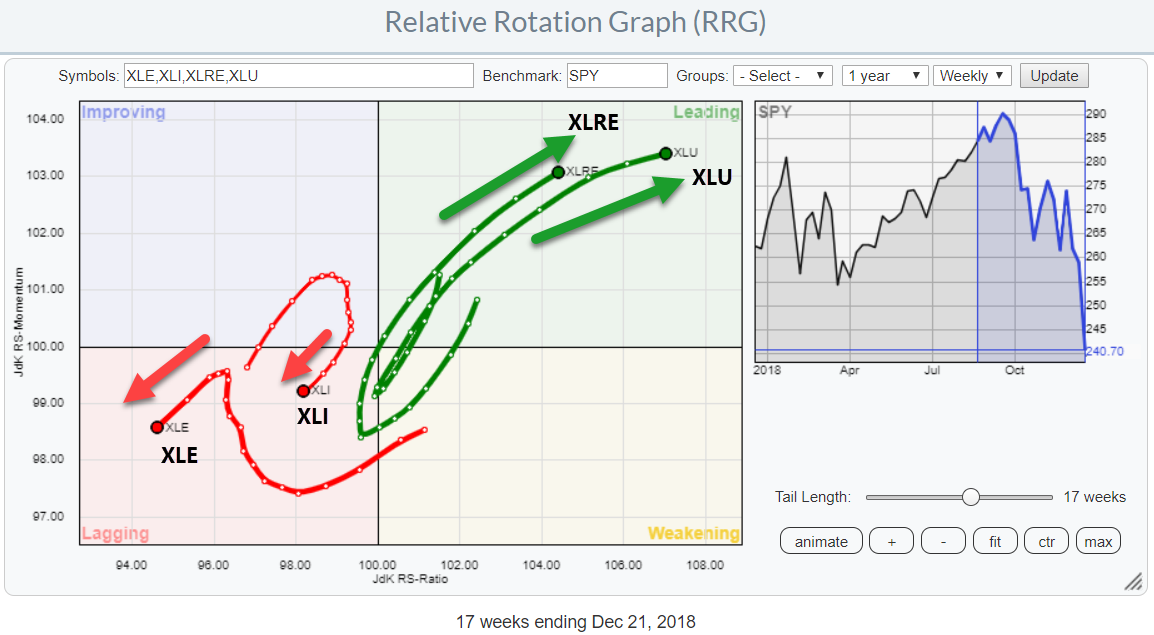
Yesterday, on boxing day, the Dow jumped 1000 points from its 52-week low which, coincidentally, was also set yesterday. Never a dull moment. But, what does it mean?
Looking at the weekly chart above, at least IMHO, it means only a (small) recovery of the damage that has been done...
READ MORE
MEMBERS ONLY

DP Alert: Market Whiplash - Possible Island Reversal for Bonds

by Erin Swenlin,
Vice President, DecisionPoint.com
It's been a pretty interesting Christmas week so far. On Christmas Eve, Santa definitely stayed away as the market tumbled into deep lows. Today, however, it would appear that Santa finally arrived. Yes, Virginia, apparently there is a Santa Claus - for the market. So enjoy some holiday...
READ MORE
MEMBERS ONLY
We're Nearing Our First Major Bear Market Bottom
by Tom Bowley,
Chief Market Strategist, EarningsBeats.com
Market Recap for Monday, December 24, 2018
It was an abbreviated session on Monday, but the losses were not abbreviated. The Dow Jones lost another 653 points, or 2.91%, while the S&P 500, NASDAQ and Russell 2000 posted losses of 2.71%, 2.21% and 1.95%...
READ MORE
MEMBERS ONLY

A Long-term Breadth Signal Triggers
by Arthur Hill,
Chief Technical Strategist, TrendInvestorPro.com
AD Percent for the S&P 500 dipped below -90% on Monday and this was the sixth reading below -90% this year. AD Percent equals advances less declines divided by total issues. Thus, if 25 stocks advance (5%) and 475 stocks decline (95%), AD Percent equals -90% ((25 -...
READ MORE
MEMBERS ONLY
"How The Grinch Stole Christmas" Featuring Jerome Powell
by Tom Bowley,
Chief Market Strategist, EarningsBeats.com
Market Recap for Friday, December 21, 2018
Growth stocks remain under significant pressure as the stock market is quickly repricing them based on bear market rules. While I believe the sudden drop in so many critical areas simultaneously told us of the impending S&P 500 breakdown and ensuing...
READ MORE
MEMBERS ONLY

A Rare Extreme for the Russell 2000
by Arthur Hill,
Chief Technical Strategist, TrendInvestorPro.com
The Russell 2000 peaked at 1740 in mid August and fell below 1300 over the last 15 weeks. The index is now down 11 of the last 15 weeks and extremely oversold. Even though the long-term trend is clearly down, this extreme oversold condition could give way to a counter-trend...
READ MORE
MEMBERS ONLY
Relative Rotation Graph Shows BOB (EXC & WELL) vs WOW (NBL & FTV) Stocks
by Julius de Kempenaer,
Senior Technical Analyst, StockCharts.com
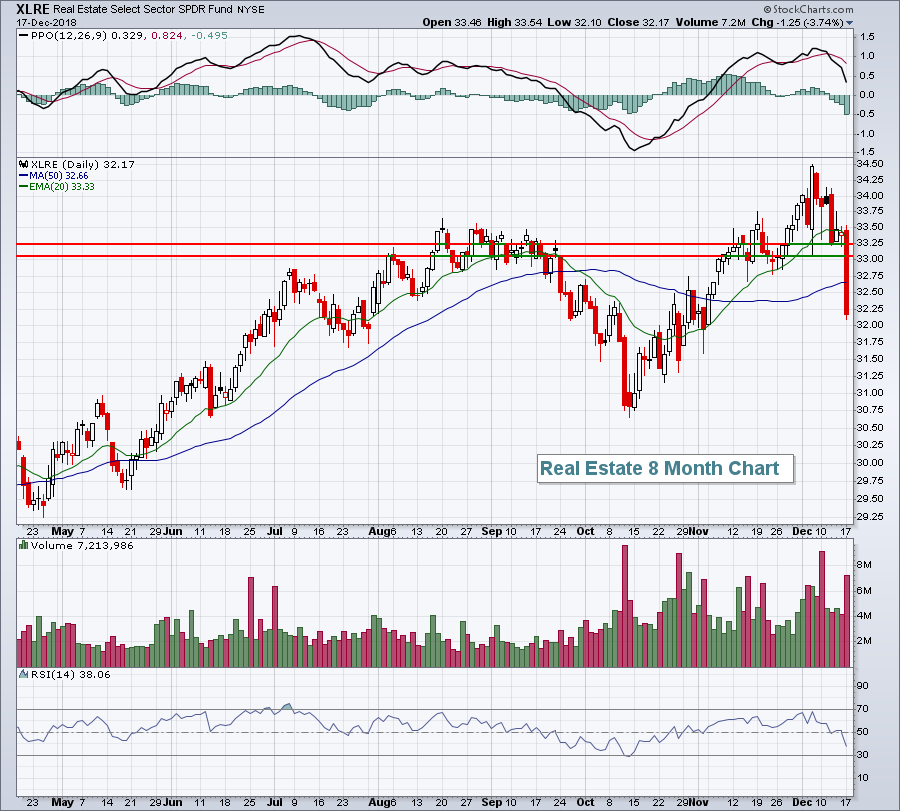
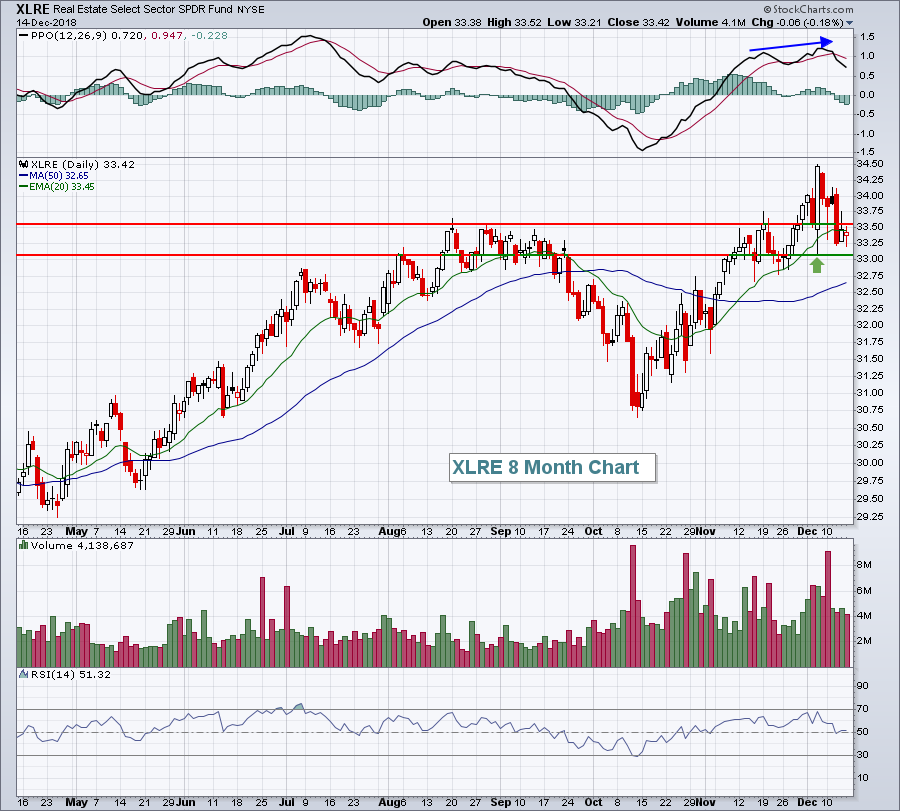
In my previous post, I highlighted both the Real-Estate and the Utilities sectors as (strong) outperformers during this weak period for stocks in general. This "Double + for Utilities and Real Estate on Relative Rotation Graph" pointed to the position inside the leading quadrant for both sectors on both...
READ MORE
MEMBERS ONLY
Week Ahead: NIFTY may relatively out-perform globally; upsides though, may remain capped
by Milan Vaishnav,
Founder and Technical Analyst, EquityResearch.asia and ChartWizard.ae
Before the start of this week, we had highlighted the possibility of NIFTY facing overhead resistance as it was inching higher. We also expected the week to remain much more volatile than normal. In line with this forecast, the week that went by remained highly volatile, with the index oscillating...
READ MORE
MEMBERS ONLY
DP Weekly Wrap: Are Things As Bad As They're Going To Get?
by Carl Swenlin,
President and Founder, DecisionPoint.com
Less than three months ago there was a great lament about how employers couldn’t fill job positions because of a shortage of job seekers. This week FedEx announced voluntary employee buyouts, presumably to reduce payroll. In view of this, I offer you the Swenlin Basic Economic Theory: Things get...
READ MORE
MEMBERS ONLY

PREVIOUS INSTANCES OF FED TIGHTENING ACCOMPANIED RISING COMMODITY PRICES -- THE FED IS RAISING RATES NOW WHILE COMMODITIES ARE PLUNGING -- WEAK CHINESE MARKET IS PULLING COMMODITIES LOWER -- AND REFLECTS A SLOWING GLOBAL ECONOMY

by John Murphy,
Chief Technical Analyst, StockCharts.com
LAST TWO YIELD CURVE INVERSION RESULTED FROM RISING COMMODITY PRICES ... My Wednesday morning message suggested that a sharp drop in the price of oil and other commodities argued for a more dovish tone from the Fed. That message also explained that previous Fed tightening cycles were usually done to combat...
READ MORE
MEMBERS ONLY

Weekly Market Review & Outlook (with video) - Oversold is a Double-Edged Sword
by Arthur Hill,
Chief Technical Strategist, TrendInvestorPro.com
* A Clear Signal on the Monthly Chart.
* Oversold is a Double-Edged Sword.
* Getting to Washout Levels (High-Low Percent).
* Quarterly Rate-of-Change Signals a Shift.
* VIX has Yet to Spike.
* Futuristic Food for Thought.
* Notes from the Art's Charts ChartList.
... A Clear Signal on the Monthly Chart ...
Even though we...
READ MORE
MEMBERS ONLY
We're Looking At A Category 3 Stock Market Hurricane Making Landfall
by Tom Bowley,
Chief Market Strategist, EarningsBeats.com
Market Recap for Thursday, December 20, 2018
If you haven't noticed, I use a lot of weather analogies in describing the stock market. It's by design as forecasting the stock market has a lot of similarities to forecasting the weather. Meteorologists are often scrutinized as weather...
READ MORE
MEMBERS ONLY
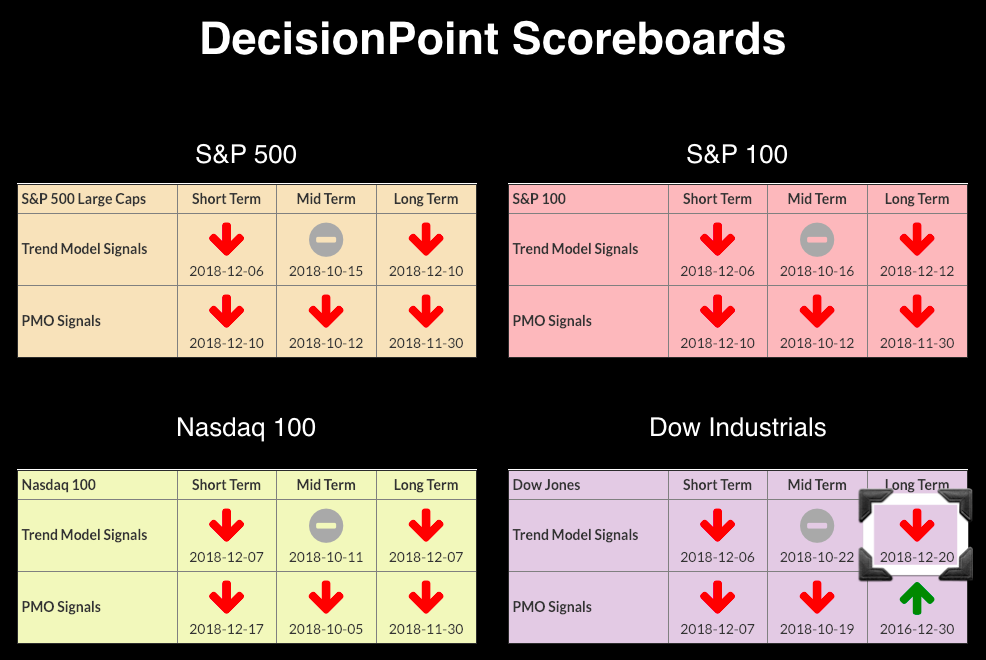
DP Bulletin: One Lone BUY Signal Remains on the Scoreboards
by Erin Swenlin,
Vice President, DecisionPoint.com
Today, the Dow finally logged its Long-Term Trend Model SELL signal. This signal was triggered when the 50-EMA crossed below the 200-EMA. The Scoreboards below are ugly. The remaining BUY signal will be gone on the final trading day of the month - I highly doubt the PMO will be...
READ MORE
MEMBERS ONLY
Fed Hikes, Promises More In 2019; Banks In Big Trouble
by Tom Bowley,
Chief Market Strategist, EarningsBeats.com
Market Recap for Wednesday, December 19, 2018
This was a Fed day that could have lasting damaging effects. Fed Chair Jerome Powell and his band of cronies decided to ignore the one piece of data that's probably the best leading indicator - the U.S. stock market. The...
READ MORE
MEMBERS ONLY
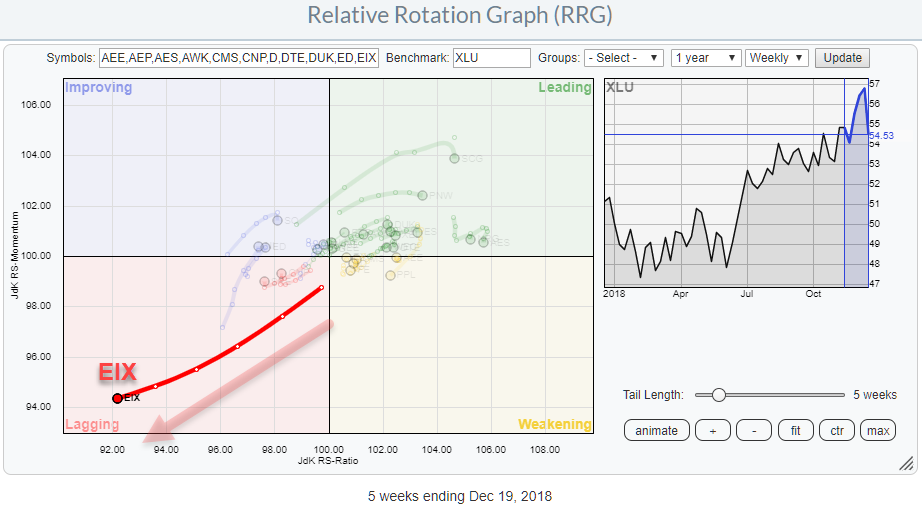
Utilities are OK but it's better to avoid EIX
by Julius de Kempenaer,
Senior Technical Analyst, StockCharts.com
The Utilities sector is acting as a safe haven for a lot of investors that need to park their money in the stock market because they cannot, or are not allowed to, hold all or significant amounts of cash when markets are going down.
These are the periods when relative...
READ MORE
MEMBERS ONLY
DP Alert: A Year Without a Santa Claus?
by Erin Swenlin,
Vice President, DecisionPoint.com
You might be chuckling at the title which pays homage to the Rankin/Bass stop-motion animated classic A Year Without a Santa Claus. In the show, it takes two elves, a little boy and a young reindeer to prove to a despondent Santa that everyone does indeed misses him and...
READ MORE
MEMBERS ONLY

A Monster Momentum Shift in the 30-yr Yield
by Arthur Hill,
Chief Technical Strategist, TrendInvestorPro.com
It was not long ago that the 30-yr T-Yield ($TYX) was breaking above a three year resistance line and the outlook for yields was bullish (bearish for bonds). Admittedly, I was in that camp. The tables have turned as the 30-yr Yield failed to hold the breakout and sliced below...
READ MORE
MEMBERS ONLY

The Fed Unnerves Gold Market

by Martin Pring,
President, Pring Research
In my December Market Roundup webinar, I touched on the idea that the economy had begun to seriously slow down. Wednesday’s Fed action, actual and potential for next year, will amplify that process. The equity markets are obviously paying attention, but the increased probability of higher rates and a...
READ MORE
MEMBERS ONLY

THE FED CAN'T AFFORD TO MAKE A MISTAKE TODAY -- HIGHER SHORT-TERM RATES RISK AN INVERTED YIELD CURVE -- WHILE PLUNGING OIL PRICE SHOWS WEAKER INFLATION -- AND U.S. STOCKS ARE UNDERGOING A MAJOR TEST OF THEIR EARLY 2018 LOWS
by John Murphy,
Chief Technical Analyst, StockCharts.com
TODAY IS A BIG DAY FOR THE FED -- AND FOR THE MARKETS ... Today is one of the most important Fed days in recent memory. That's because there's a lot riding on what it does this afternoon; or doesn't do. It's widely...
READ MORE
MEMBERS ONLY
On Fed Day, The Treasury Market Is Painting A Bearish Picture
by Tom Bowley,
Chief Market Strategist, EarningsBeats.com
Special Event
At 4:30pm EST today, I'll be joining John Hopkins, President of EarningsBeats.com, for a special "2019 Stock Market Outlook" webinar. It's a FREE event where I'll be discussing likely market direction in 2019 and areas of the market...
READ MORE
MEMBERS ONLY

SystemTrader - Aggregating Trends and Oversold Conditions - Finance Sector is Most Oversold
by Arthur Hill,
Chief Technical Strategist, TrendInvestorPro.com
* Setting the Stage.
* Defining Trend and Condition.
* Running the Scan.
* Uptrends versus Downtrends.
* Overbought versus Oversold.
* Uptrend and Oversold.
* Uptrend and Mildly Oversold.
* Scanning for RSI Ranges.
* Conclusions.
... Setting the Stage
... Instead of testing an actual system, this System Trader article will show scatter plots for S&P 500...
READ MORE
MEMBERS ONLY

Investors Don't Like to Lose

by David Keller,
President and Chief Strategist, Sierra Alpha Research
Everyone believed they had a sound approach to investment during the extended bull market of 2009-2018. When everything’s gaining in price, slowly and steadily, it’s easy for confidence in your process to become overconfidence in your process.
To quote a phrase, “Never confuse brains with a bull market....
READ MORE
MEMBERS ONLY
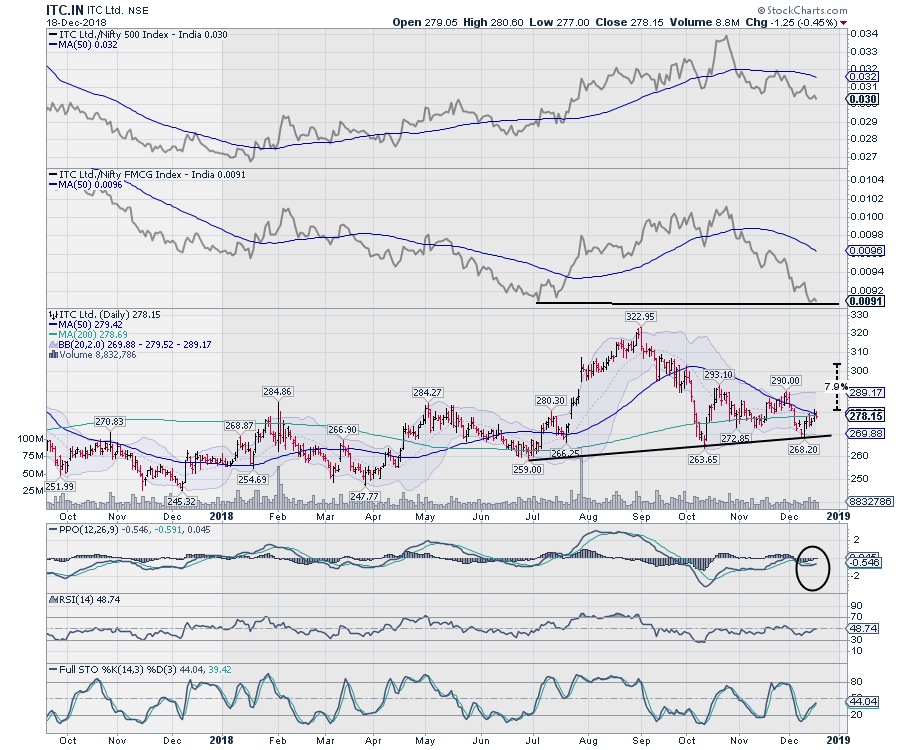
ITC and Adani Ports
by Milan Vaishnav,
Founder and Technical Analyst, EquityResearch.asia and ChartWizard.ae
Before I begin, let me wish all our readers, friends and colleagues a very Happy Holidays and the best of times to come in 2019!
The Indian Equity markets have witnessed immense volatility over the past couple of days. Amid this volatile environment, it makes sense to adopt a stock-specific...
READ MORE
MEMBERS ONLY

Global Overview of 2018 with Seven PerfCharts - On Trend Preview
by Arthur Hill,
Chief Technical Strategist, TrendInvestorPro.com
... Today's show, On Trend, provides a review of 2018, which is the year of few winners (so far). With less than two weeks before yearend, I would not expect too much to change. The show starts with seven PerfCharts to focus on seven different groups around the globe....
READ MORE
MEMBERS ONLY
It Was Just Another Manic Monday
by Tom Bowley,
Chief Market Strategist, EarningsBeats.com
Market Recap for Monday, December 17, 2018
Every component stock in the Dow Jones Industrial Average fell on Monday as the index dropped another 500 points. The S&P 500 lost major closing price support at 2581, crude oil ($WTIC) threatened to break below $50 per barrel, small caps...
READ MORE
MEMBERS ONLY

Catch A Falling Knife?
by Martin Pring,
President, Pring Research
* The Market Remains Oversold
* More Trend Damage Triggered
* Key Ratios Have Just Broken to New Lows
As a kid, I used to love building sand castles and defending them against the ensuing wave action. If the tide was coming in, however, it always proved to be a fool’s errand...
READ MORE
MEMBERS ONLY

Momentum Turns for Big Blue
by Arthur Hill,
Chief Technical Strategist, TrendInvestorPro.com
IBM is one of the worst performing stocks in the S&P 500 this year with an 18% decline year-to-date - and it could get worse.
First and foremost, the long-term trend is down because the stock recorded a 52-week low in late October, the 50-day moving average is...
READ MORE
MEMBERS ONLY
S&P 500 Nearing Significant Breakdown, Bull Market Running Out Of Steam
by Tom Bowley,
Chief Market Strategist, EarningsBeats.com
Market Recap for Friday, December 14, 2018
The U.S. stock market suffered another big blow to its current 9+ year bull market on Friday. Culprits for the selling included Johnson & Johnson (JNJ, -10.30%) in the healthcare space (XLV, -3.37%), easily the worst performing sector, Adobe Systems...
READ MORE
MEMBERS ONLY

Article Summaries: 9/2018 - 12/2018
by Greg Morris,
Veteran Technical Analyst, Investor, and Author
Periodically I write an article, such as this one, that reviews the past few months of articles. Why on Earth would I do this? Primarily for two reasons. One is that many new readers are involved and often they do not go back and look at the past articles. Two...
READ MORE
MEMBERS ONLY
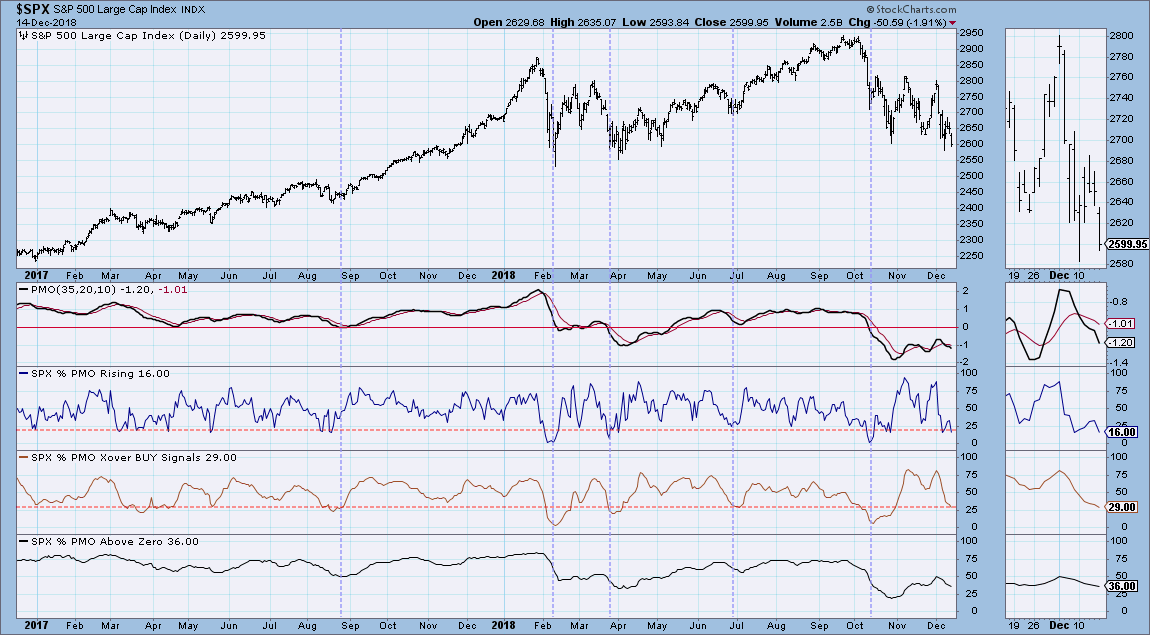
PMO Analysis - Wrong Direction and Not Oversold Enough
by Erin Swenlin,
Vice President, DecisionPoint.com
The Price Momentum Oscillator (PMO) is a great measure of acceleration/deceleration of price for individual entities. Combining each component's PMO readings within an index is especially advantageous in allowing us to understand how overbought or oversold it is in three timeframes. Although readings are oversold, they are...
READ MORE
MEMBERS ONLY
Want To Know The Difference Between A Correction And A Bear Market?
by Tom Bowley,
Chief Market Strategist, EarningsBeats.com
Not a whole lot.
I guess there are three primary differences. First, there's the percentage drop as corrections are generally considered to see a drop of less than 20%, while bear markets tend to see declines well in excess of 20%. Second, a bear market tends to last...
READ MORE
MEMBERS ONLY

LONGER-RANGE INDICATORS REMAIN BEARISH FOR U.S. STOCKS -- RETEST OF EARLY 2018 LOWS SHOULD DETERMINE IF STOCKS ARE IN A BEAR MARKET -- STOCKS OFF TO BAD DECEMBER START -- FAILURE OF SANTA CLAUS RALLY TO SHOW WOULD BE A BAD SIGN FOR THE NEW YEAR
by John Murphy,
Chief Technical Analyst, StockCharts.com
WEEKLY S&P 500 CHART CONTINUES TO LOOK TOPPY... There's a reason why every short-term rally attempt over the past couple of months has failed. That's because longer-range indicators have turned bearish and remain so. It's more difficult for bounces on daily charts...
READ MORE