MEMBERS ONLY
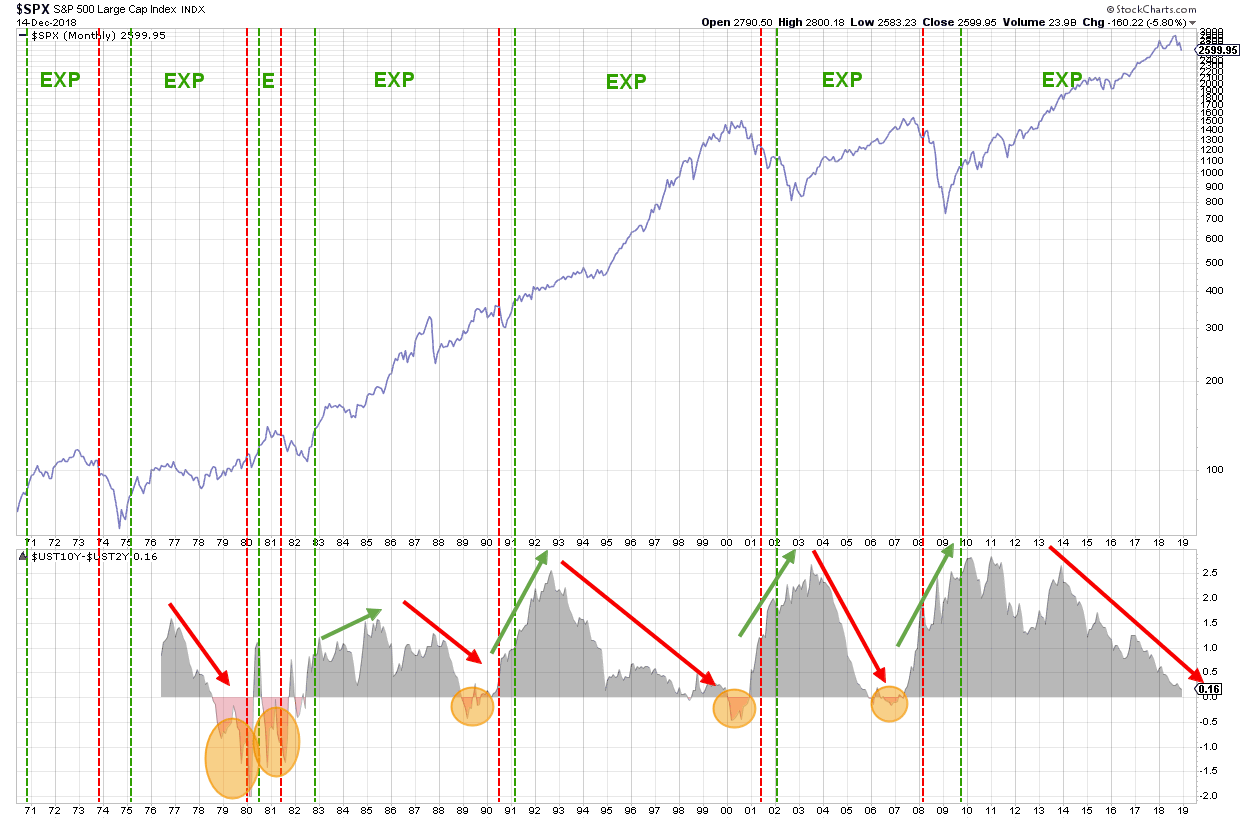
The Yield Curve And The Business Cycle

by Julius de Kempenaer,
Senior Technical Analyst, StockCharts.com
The "Yield Curve" is a term often used in finance and refers to the relationship between (government) bonds with various maturities.
The "Normal" relationship between the yield on various maturities is that the longer you lend money to someone. In this case the US government, the...
READ MORE
MEMBERS ONLY
Consider This New Year's Stock Market Resolution And Change Your Financial Future

by John Hopkins,
President and Co-founder, EarningsBeats.com
First, I'd like to wish everyone a Merry Christmas and a Happy New Year!
2018 has been a wild ride with volatility returning to extreme levels. Unfortunately, 2019 looks like it will get even worse. I believe we're in a bear market and, at EarningsBeats.com,...
READ MORE
MEMBERS ONLY

Support Levels in Downtrends? Fuggedaboutit!

by Arthur Hill,
Chief Technical Strategist, TrendInvestorPro.com
As obvious as it seems, lower lows and lower highs are the order of the day in a downtrend. Thus, prices are expected to break prior lows and continue lower when the trend is down. Taking this downtrend concept one step further, one could also assume that support levels within...
READ MORE
MEMBERS ONLY
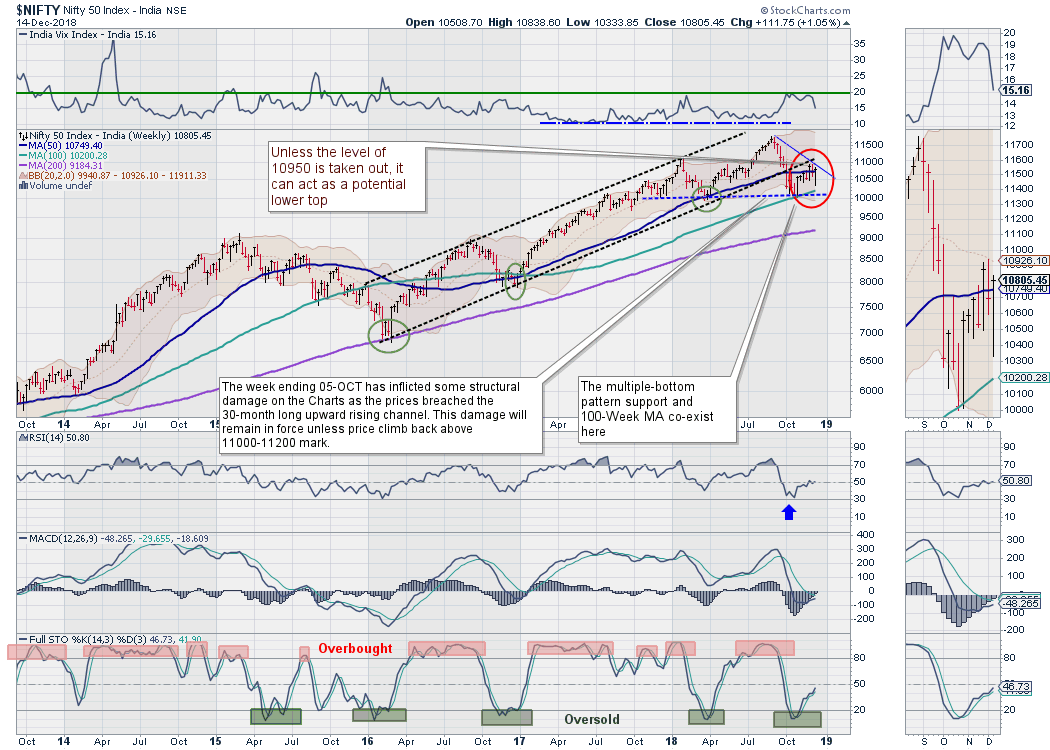
Week Ahead: Nifty continues to trade below key resistance levels despite strong pullback

by Milan Vaishnav,
Founder and Technical Analyst, EquityResearch.asia and ChartWizard.ae
In our previous weekly note, we noted that we were expecting a rough ride for the Markets. Over the course of the last week, the markets dealt with the state election results and the sudden resignation of the RBI Governor. Volatility ruled the roost, with the NIFTY seeing swings in...
READ MORE
MEMBERS ONLY
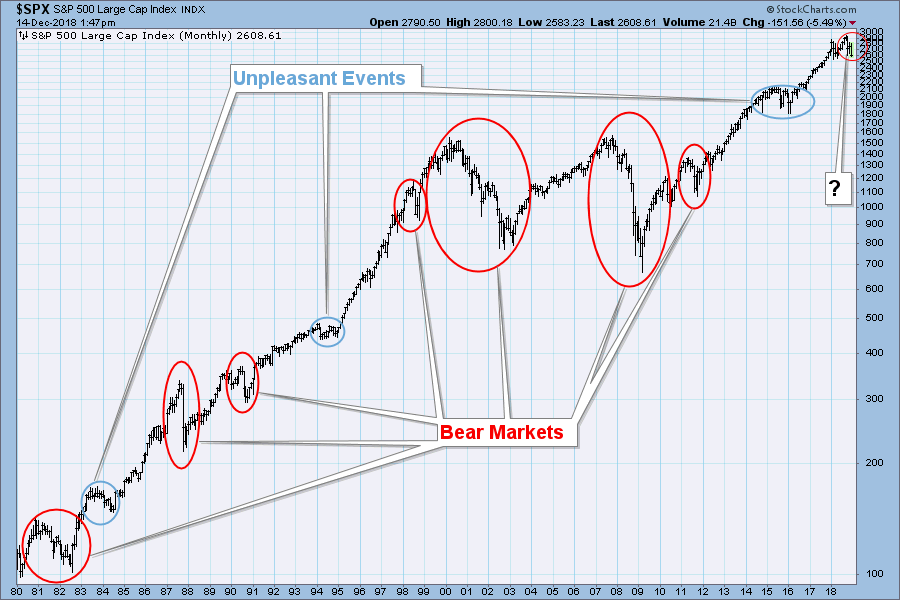
DP Weekly Wrap: Bear Market? Never Seen One.

by Carl Swenlin,
President and Founder, DecisionPoint.com
The chart below shows the entire period during which I have been involved in stock market analysis, and, as you can see, the title of this article definitely does not apply to me. If a decline of -20% or more qualifies as a bear market, then I have experienced seven...
READ MORE
MEMBERS ONLY
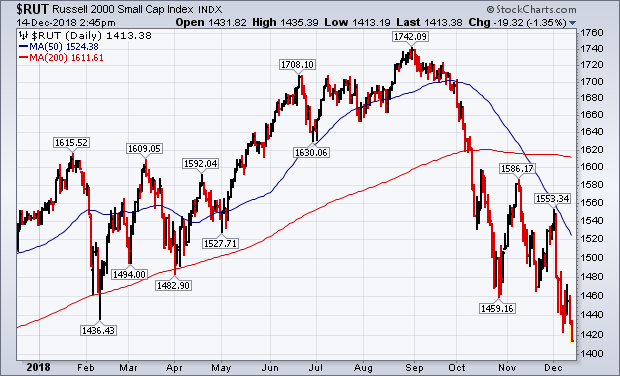
Russell 2000 Small Cap Index and the Dow Transports Fall to 52-Week Lows

by John Murphy,
Chief Technical Analyst, StockCharts.com
Editor's Note: This article was originally published in John Murphy's Market Message on Friday, December 14th at 2:32pm ET.
Two of the earliest warning signs since October that the stock market was in trouble was the fact that economically-sensitive stock groups like small caps and...
READ MORE
MEMBERS ONLY

HEAVY SELLING PUSHES U.S. STOCK INDEXES NEAR DECEMBER LOWS -- EARLY 2018 LOWS ARE NEXT -- RUSSELL 2000 SMALL CAP INDEX AND THE DOW TRANSPORTS FALL TO 52-WEEK LOWS -- SO DOES THE S&P RETAIL SPDR -- THAT'S A BAD SIGN FOR THE STOCK MARKET AND THE ECONOMY
by John Murphy,
Chief Technical Analyst, StockCharts.com
HEADING BACK TO EARLY 2018 LOWS... After a unimpressive bounce this week, stock prices are ending week under heavy selling pressure. The first three charts show the Dow Industrials, the S&P 500, and the Nasdaq Composite nearing new lows for the month of December, which puts them on...
READ MORE
MEMBERS ONLY

Portfolio Management and Asset Allocation: Supercharge These Using Powerful Morningstar Tools

by Gatis Roze,
Author, "Tensile Trading"
The most important thing in my life is not money — it is my time and my health. These two items are far more important to me than monetary assets. As a result, I’m always focused on how I spend my time and less on how I spend my money....
READ MORE
MEMBERS ONLY

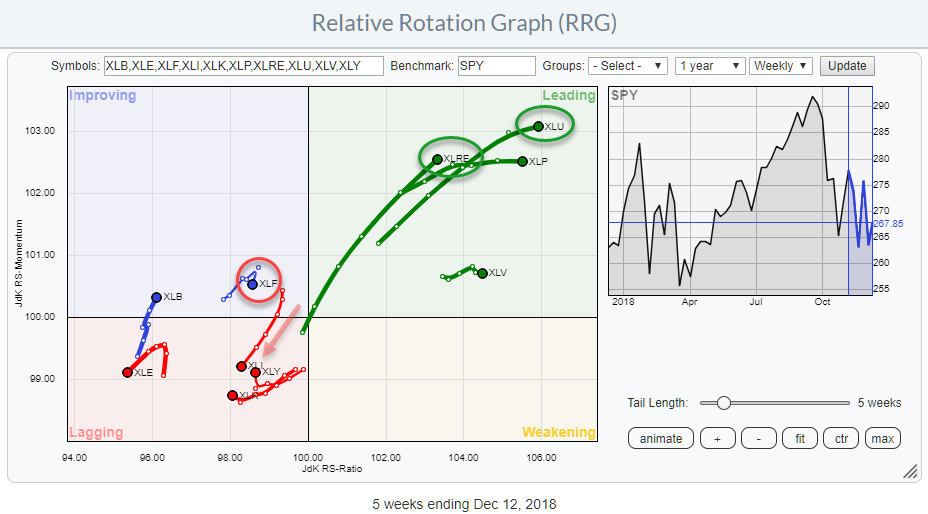
Weekly Market Review & Outlook (with video) - Beware of the Next Dubious Support Level
by Arthur Hill,
Chief Technical Strategist, TrendInvestorPro.com
* Support Levels are Dubious in Downtrends.
* Continuation Patterns after Breakdowns.
* Mid-caps and Small-caps Lead Lower.
* Bonds Catch Bid as Stocks Fall.
* 10-yr Yield and Oil Fall Together.
* Gold Ignores Dollar Strength.
* Is it Really Worth It?
* XLU Hits New High.
* XLP Corrects within Uptrend.
* XLV Consolidates after New High.
* Notes...
READ MORE
MEMBERS ONLY
Here's A Bear Market Chart You Can't Afford To Miss!

by Tom Bowley,
Chief Market Strategist, EarningsBeats.com
Market Recap for Thursday, December 13, 2018
The U.S. stock market attempted to stage rallies on Thursday, initially in the morning session and then again in the final hour. But astute technicians that follow more than the headline Dow Jones and S&P 500 numbers realized it was...
READ MORE
MEMBERS ONLY

STOCKS ARE GOING BACK ON THE DEFENSIVE
by John Murphy,
Chief Technical Analyst, StockCharts.com
SHORT-TERM BOUNCE HAS RUN ITS COURSE ... This week's modest rebound in stocks has been unimpressive and appears to have run its course. Lack of upside volume and weak breadth also show that investors have stayed on the sidelines, or have sold into this week's rebound. Sector...
READ MORE
MEMBERS ONLY

Breadth Remains Weak on Reversal Attempt
by Arthur Hill,
Chief Technical Strategist, TrendInvestorPro.com
* An Attempt at a Candlestick Reversal.
* Breadth Fails to Impress.
* More Stocks Breaking 50-day EMA.
* On Trend on StockCharts TV.
... An Attempted Candlestick Reversal
... The S&P 500 firmed over the last few days, but breadth remains weak overall. The first chart shows candlesticks over the last few months...
READ MORE
MEMBERS ONLY
A Great Day Turns Good With Afternoon Selling; Internet Stocks Bottoming?
by Tom Bowley,
Chief Market Strategist, EarningsBeats.com
Market Recap for Wednesday, December 12, 2018
The opening gap higher on Wednesday added to the recent stock market advance and the bulls stretched those early morning gains into the afternoon session. But much of those intraday profits faded as the session wore on and an across-the-board advance really didn&...
READ MORE
MEMBERS ONLY
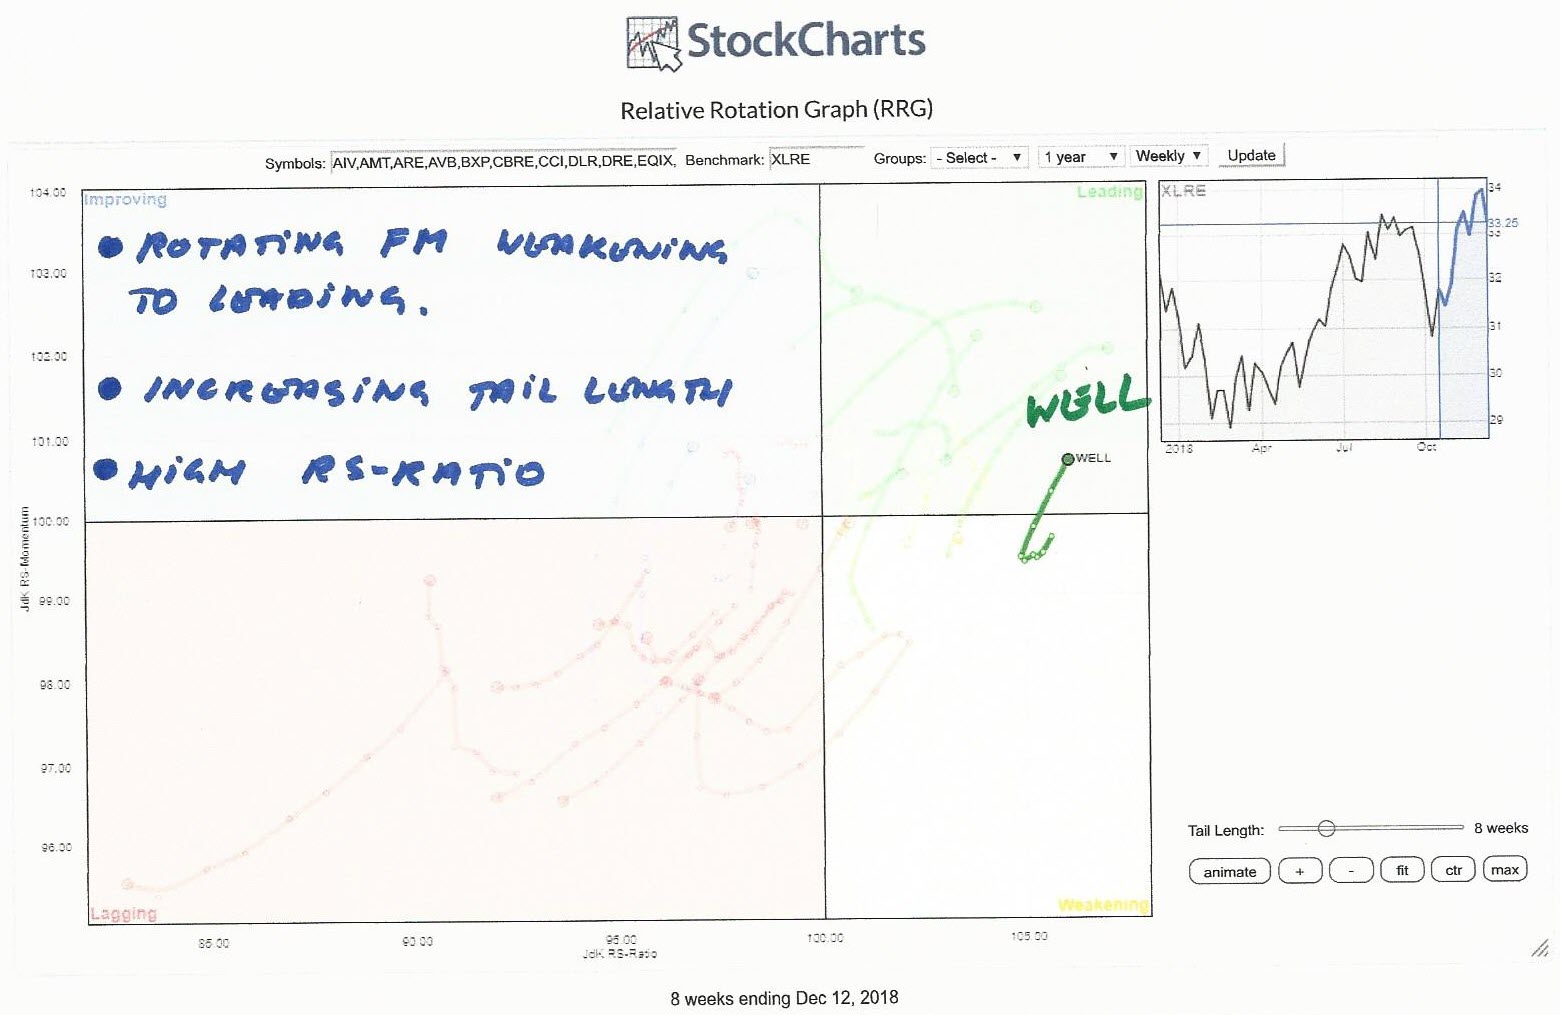
Oh WELL... What Can I Say?
by Julius de Kempenaer,
Senior Technical Analyst, StockCharts.com
On the Relative Rotation Graph, the Real-estate sector is one of the better performing sectors vis-a-vis the S&P 500 index.
The RRG above shows the rotation of all the stocks in XLRE against XLRE. This gives us a picture of the relative positions for all these stocks against...
READ MORE
MEMBERS ONLY

MONDAY'S UPSIDE REVERSAL DAY MAY HAVE SIGNALLED SHORT-TERM BOTTOM -- THAT COULD LEAD TO DECEMBER REBOUND TO OVERHEAD RESISTANCE -- A STUDY OF SMALLER OR EQUAL WEIGHTED INDEXES SUGGESTS A RETEST OF EARLY 2018 LOWS MAY HAVE ALREADY TAKEN PLACE
by John Murphy,
Chief Technical Analyst, StockCharts.com
S&P 500 MAY BE FORMING SHORT-TERM BOTTOM... My message from last Friday suggested that the S&P 500 was likely to drop below its October low, which could lead to a retest of its early 2018 lows (more on that last point shortly). Chart 1 shows Monday&...
READ MORE
MEMBERS ONLY

Mind the Gaps in L Brands
by Arthur Hill,
Chief Technical Strategist, TrendInvestorPro.com
A long-term downtrend, two gaps down and a move back below the falling 200-day could spell trouble for L Brands.
The stock has been quite volatile since summer, but the overall trend remains down. LB hit a 52-week low in early September, the 50-day SMA (not shown) is below the...
READ MORE
MEMBERS ONLY
Double + For Utilities And Real Estate On Relative Rotation Graph
by Julius de Kempenaer,
Senior Technical Analyst, StockCharts.com
The market keeps throwing us curve balls on a daily basis. The Relative Rotation Graph above translates these curve balls into (sector-) rotational patterns.
The weekly chart above shows continuing strength for Utilities and Real Estate as they continue to move higher on both axes of the RRG.
Staples and...
READ MORE
MEMBERS ONLY
Bearish Patterns Taking Shape in EW Sectors and Semiconductor ETFs/Stocks
by Arthur Hill,
Chief Technical Strategist, TrendInvestorPro.com
* Bearish Patterns in Big EW Sectors.
* Internal Weakness Hits Consumer Staples.
* Semiconductor ETFs Bounce after Breakdowns.
* Intel Fails at 200-day as Broadcom Breaks Out.
* Four more Wedge Breaks.
* On Trend on Youtube.
... Bearish Patterns in Big EW Sectors
... While the sector SPDRs capture what is happening with large-cap stocks, the...
READ MORE
MEMBERS ONLY
Early Gains Wiped Out As U.S. Equities Finish In Bifurcated Fashion
by Tom Bowley,
Chief Market Strategist, EarningsBeats.com
Market Recap for Tuesday, December 11, 2018
Volatile action on Tuesday resulted in a bifurcated market. The NASDAQ managed to cling to gains at the close, while the Dow Jones, S&P 500 and Russell 2000 saw early morning gains turn into losses by the close. Leadership came mostly...
READ MORE
MEMBERS ONLY
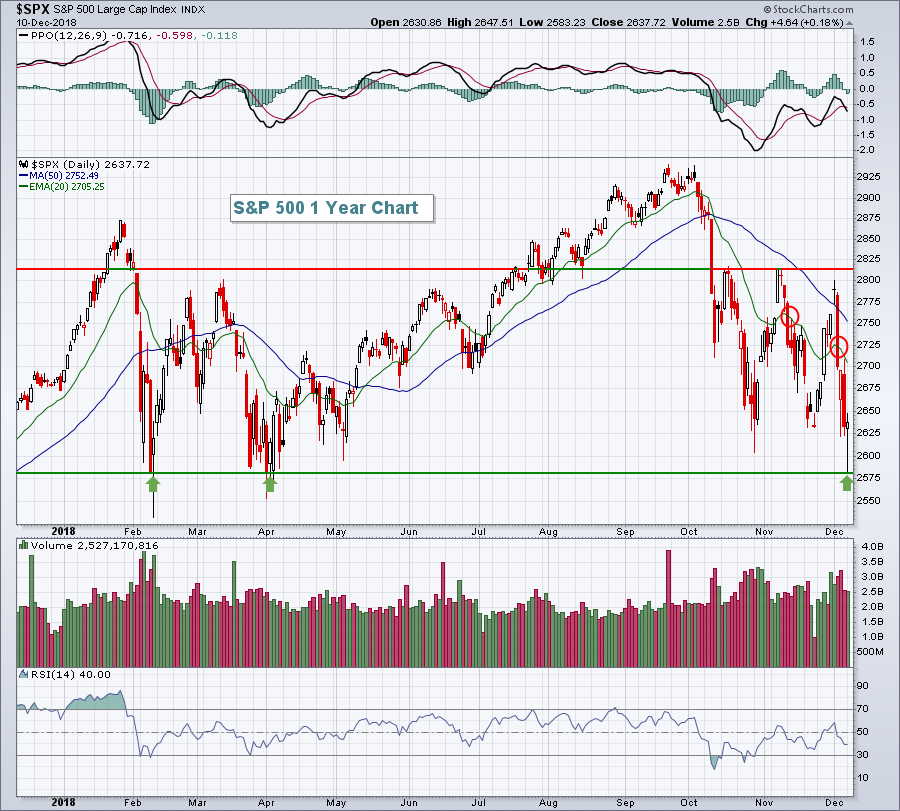
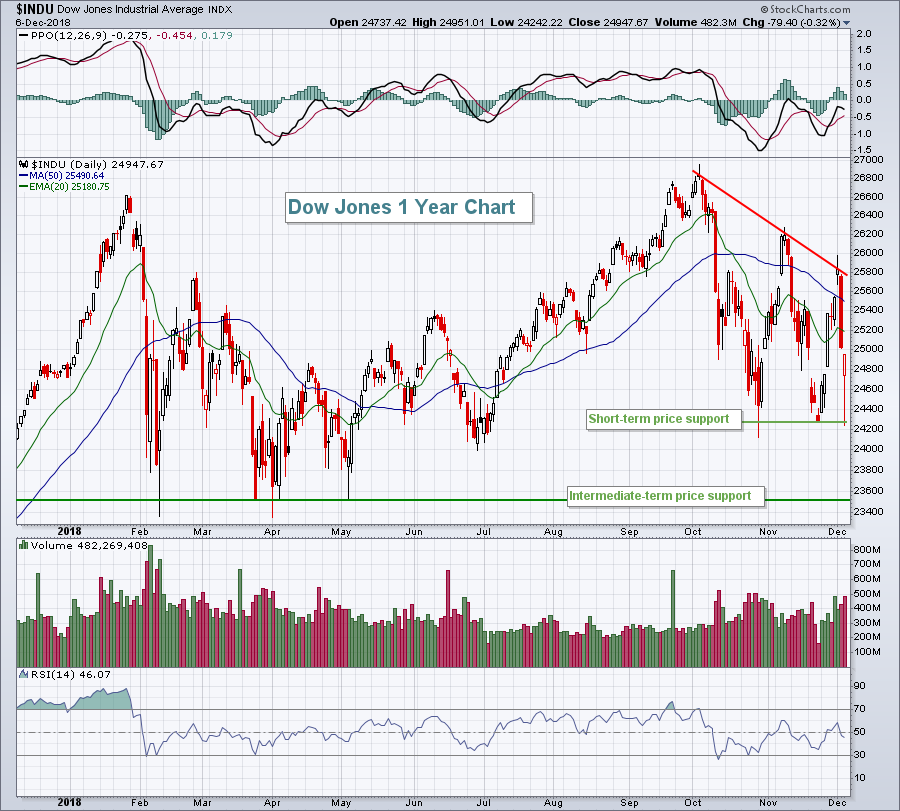
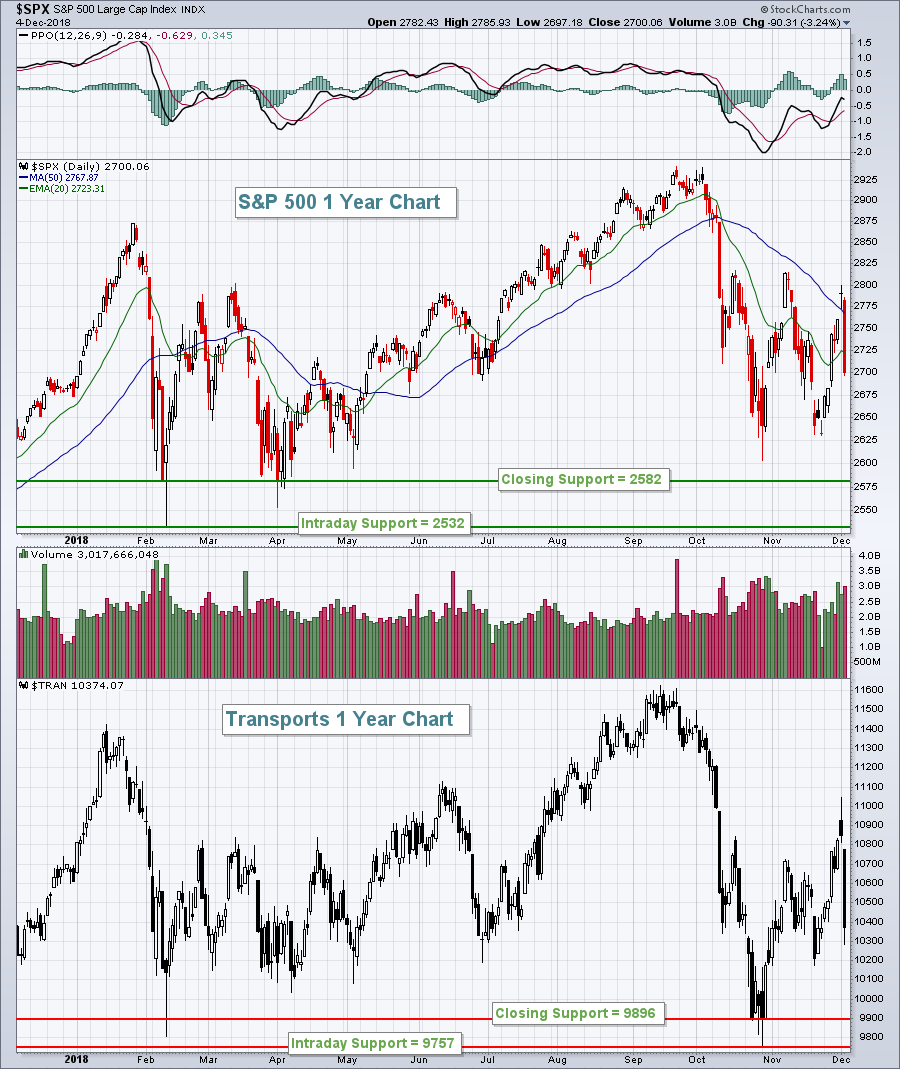
S&P 500 Touches MAJOR Price Support; One Ingredient Missing For Bear Market
by Tom Bowley,
Chief Market Strategist, EarningsBeats.com
Market Recap for Monday, December 10, 2018
Yesterday was significant for one very important technical development. The February 2018 low close of 2582 was within a whisker on Monday as the S&P 500 hit an intraday low of 2583 before rallying strongly. Technology (XLK, +1.38%) led the...
READ MORE
MEMBERS ONLY

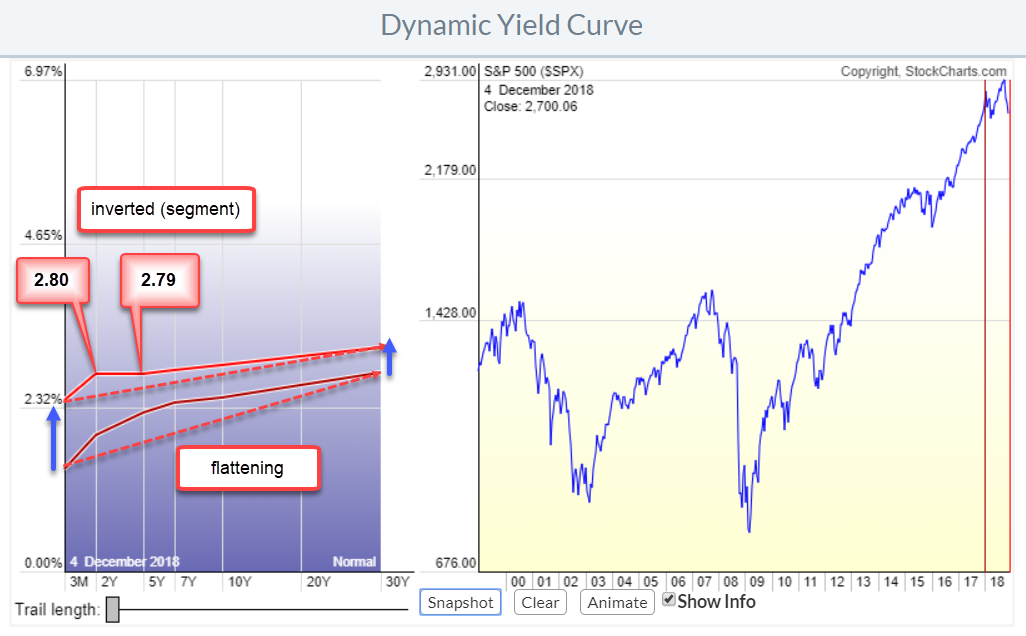
Yield Curve Inversion?

by Bruce Fraser,
Industry-leading "Wyckoffian"
The recent weakness in the stock market was partially attributed to the flattening of the ‘Yield Curve’. When bond yields (typically U.S. Treasuries) are plotted in order of their time to maturity, a Yield Curve is the result. Typically, the shortest maturity instruments (T-Bills) have the lowest yield and...
READ MORE
MEMBERS ONLY
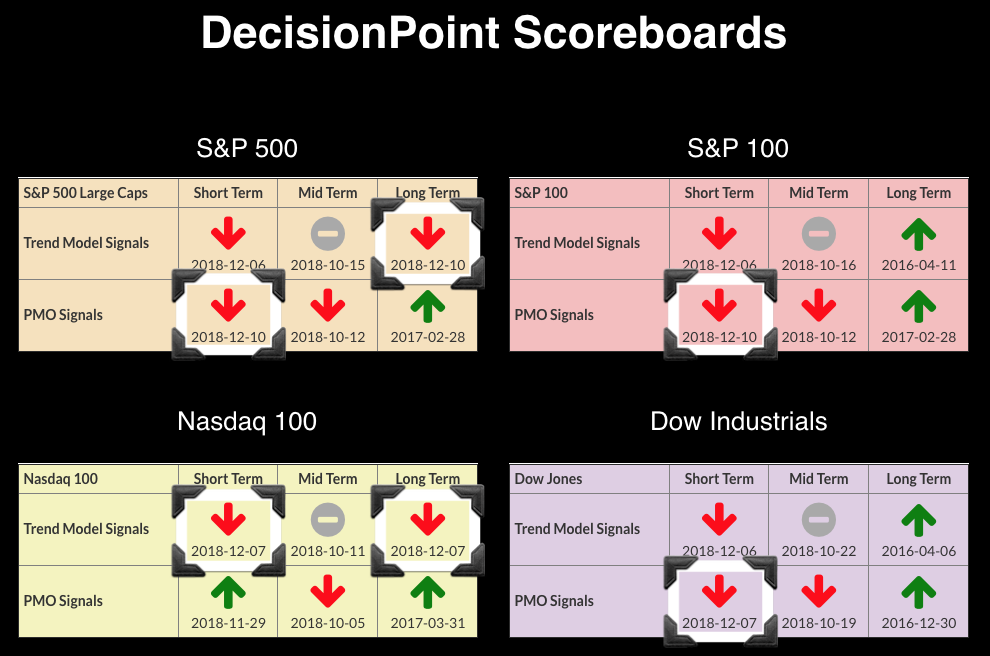
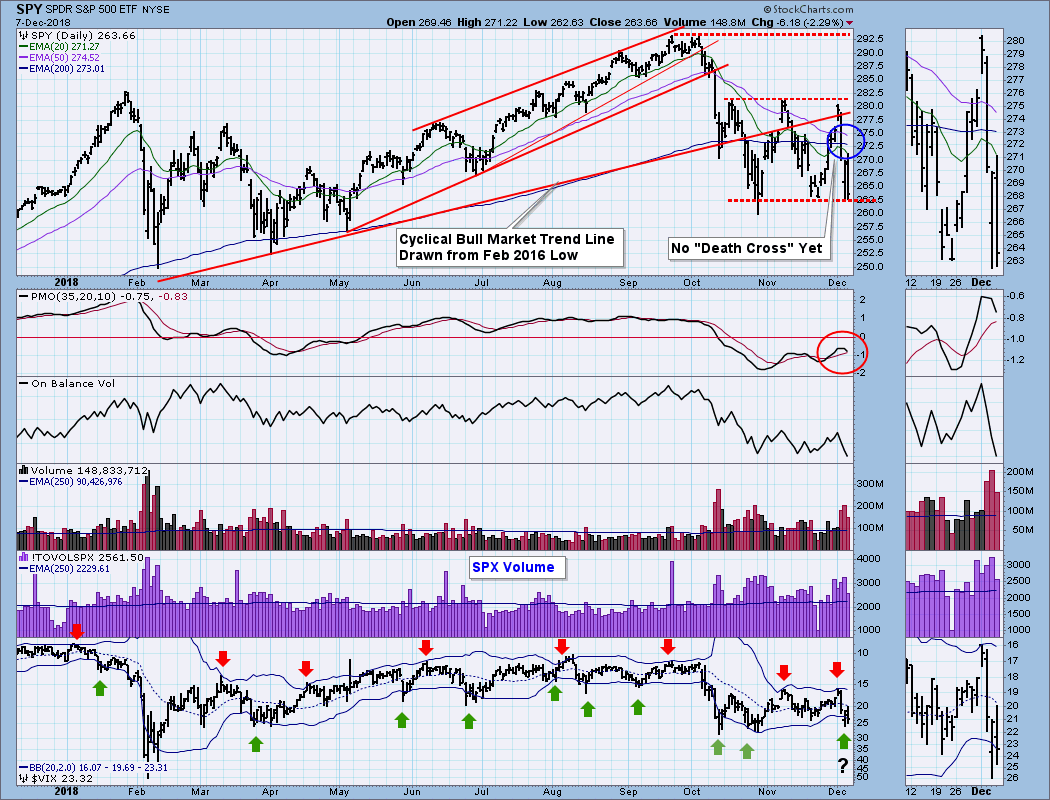
Two EMA "Death Crosses" on NDX and SPX = LT Trend Model SELLs

by Erin Swenlin,
Vice President, DecisionPoint.com
I've always thought the moniker "death cross" was terribly dramatic (and I still do). However, this time around, it does seem ominous. The SPX lost its Long-Term Trend Model BUY signal, a signal that had been in place since early 2016. These signals don't...
READ MORE
MEMBERS ONLY
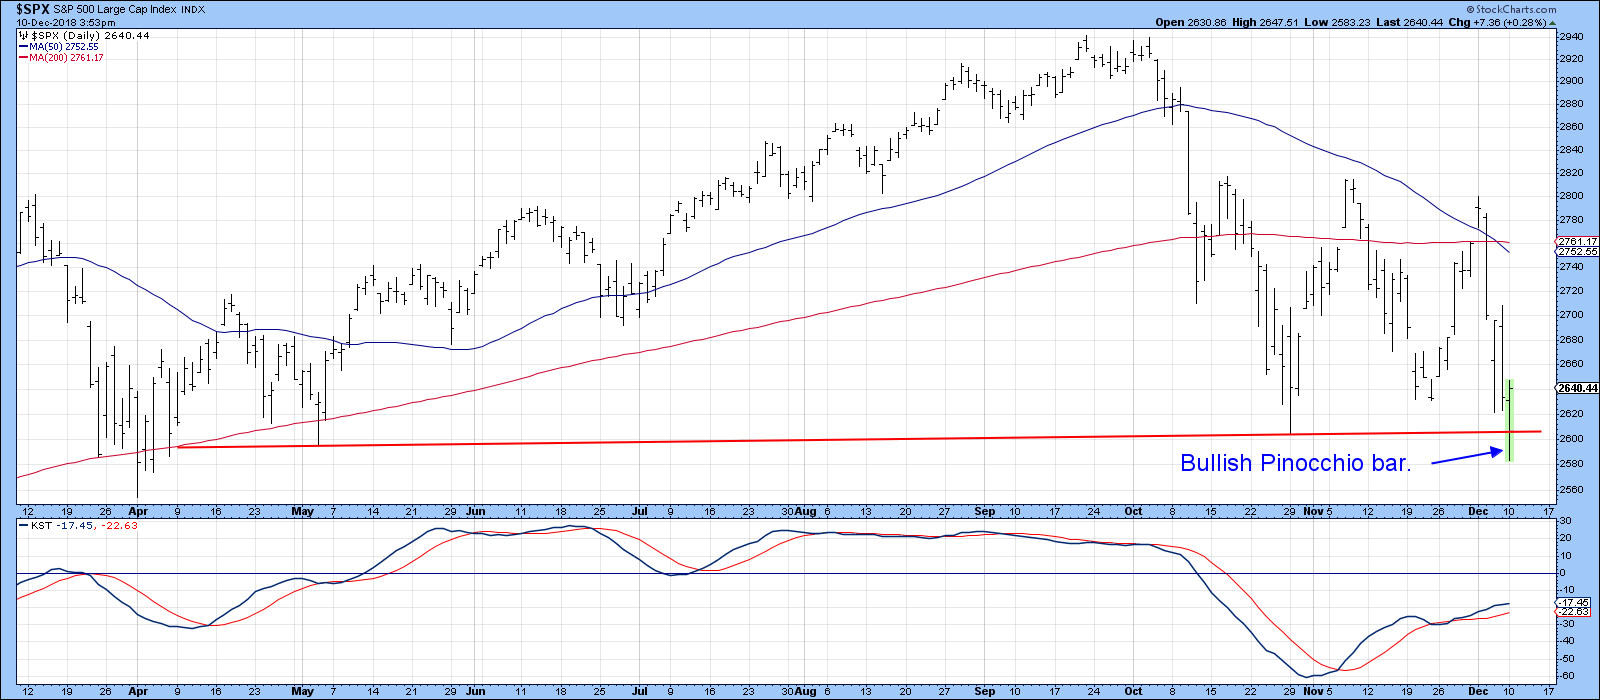
Year-End Rally Here We Come?

by Martin Pring,
President, Pring Research
* Pinocchio Lies
* Oversold Sentiment Indicators
* Oversold Oscillators
Pinocchio Lies
Monday’s action was what I call “scary bullish.” First, we saw prices sell-off sharply, only to then rebound as if nothing had happened. Well, something did happen - the formation of a bullish Pinocchio bar on several Indexes. Chart 1...
READ MORE
MEMBERS ONLY

Interview with Japanese Trader: Takehiro Hikita - Part 2

by Greg Morris,
Veteran Technical Analyst, Investor, and Author
This is the final part of an interview with Takehiro Hikita; see the first part here.
Mr. Takehiro Hikita has graciously provided me with a large amount of insight into the candle pattern philosophy. I have never met anyone so devoted to the detailed study of a concept as he....
READ MORE
MEMBERS ONLY

Southwest Airlines Reverses with a Gap
by Arthur Hill,
Chief Technical Strategist, TrendInvestorPro.com
Southwest Airlines (LUV) is in a long-term downtrend and the recent failure near the death cross points to further downside.
First and foremost, the long-term trend is down because LUV hit a new 52-week low in late October and price is below the 200-day SMA. In addition, the 50-day SMA...
READ MORE
MEMBERS ONLY

SystemTrader - The Real Value of the Death Cross and Broad Market Signals
by Arthur Hill,
Chief Technical Strategist, TrendInvestorPro.com
* Setting the Stage.
* Defining the Death Cross.
* 9 of the Last 2 Bear Markets.
* Comparing Different Crossover Signals.
* SMAs versus EMAs.
* SPY with Dividends vs $SPX Without.
* The Moving Average Sweet Spot.
* Conclusions (Adjusting Exposure).
... Setting the Stage ...
The financial media is awash with reports on the "death cross&...
READ MORE
MEMBERS ONLY
Falling Transports Lead To Further Losses On Wall Street
by Tom Bowley,
Chief Market Strategist, EarningsBeats.com
Market Recap for Friday, December 7, 2018
Friday marked the end of a rough day and a rough week for U.S. equities. Strength was found in utilities (XLU, +0.37%), the only sector to end in positive territory to close out the week. Gold miners ($DJUSPM, +2.36%) and...
READ MORE
MEMBERS ONLY
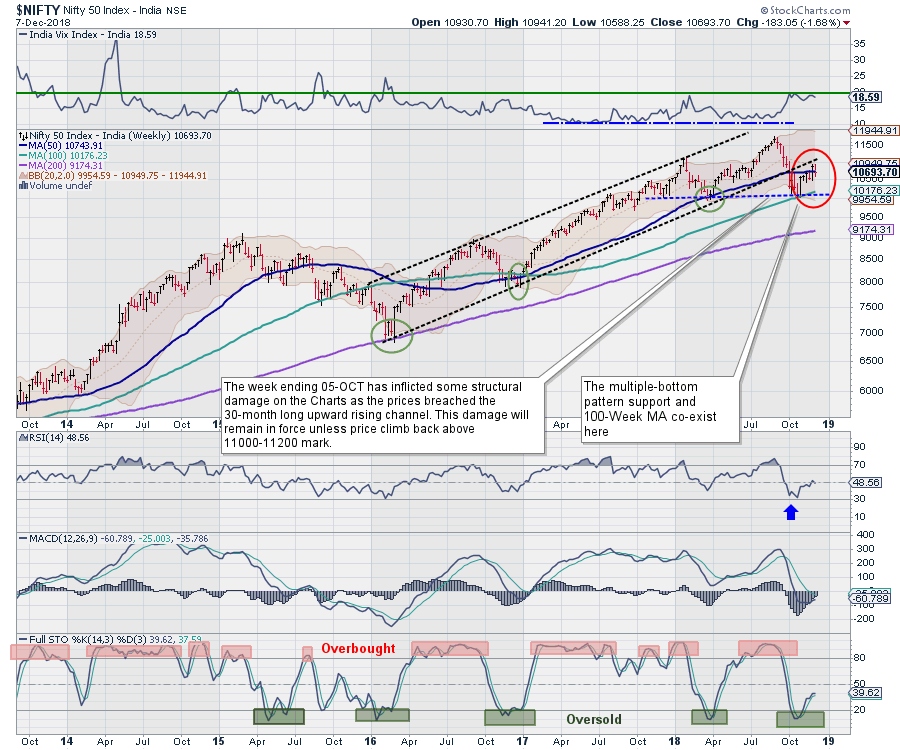
Coming week to remain volatile for NIFTY; dealing with volatility infused by results of State Elections important
by Milan Vaishnav,
Founder and Technical Analyst, EquityResearch.asia and ChartWizard.ae
It wasn't smooth sailing for the equity markets as the previous week remained quite volatile, with the markets oscillating both ways to finally end the week in the red. The benchmark index NIFTY50 had moved past its 50-Week MA earlier, but it has failed to sustain that level....
READ MORE
MEMBERS ONLY
DP Weekly Wrap: Still In Trading Range Despite Fireworks
by Carl Swenlin,
President and Founder, DecisionPoint.com
There will probably be a lot of people mentioning that today there was a "Death Cross" on the S&P 500 chart, and this is important because a Death Cross means that the price index has entered a bear market. Specifically, on the $SPX chart (not shown)...
READ MORE
MEMBERS ONLY

Weekly Market Review & Outlook (with video) - Going Nowhere Fast
by Arthur Hill,
Chief Technical Strategist, TrendInvestorPro.com
* A Bull Market in Noise.
* New Lows Expand.
* Another Week and Another Big Swing..
* NDX Holds Up Better.
* Stocks Holding the 200-day.
* SKYY, HACK and IGV Trace Out Wedges.
* Healthcare Remains the Leader.
* REM, IHI and IHF Hold Up.
* Notes from the Art's Charts ChartList.
... A Bull Market...
READ MORE
MEMBERS ONLY

OIL JUMPS ON OPEC CUTS -- THAT'S GIVING ENERGY SECTOR A BOOST -- FALLING OIL HAS WEIGHED ON BOND YIELDS -- WEAK ENERGY PATCH AND FALLING STOCK PRICES HAVE ALSO WEAKENED HIGH-YIELD BONDS -- S&P 500 APPEARS TO BE TRIANGULATING WHICH FAVORS LOWER PRICES
by John Murphy,
Chief Technical Analyst, StockCharts.com
LARGER THAN EXPECTED OPEC CUTS BOOST CRUDE OIL ... OPEC and Russia finally agreed to a larger-than-expected production cut of 1.2 million barrels a day of crude oil which is lifting the price of that commodity today. It remains to be seen, however, if that's enough to reverse...
READ MORE
MEMBERS ONLY
Big Recovery Temporarily Halts Slide; Nonfarm Payrolls Weak
by Tom Bowley,
Chief Market Strategist, EarningsBeats.com
Market Recap for Thursday, December 6, 2018
The Dow Jones and S&P 500 were both on a crash course for key February price support until buyers re-emerged just past 11am EST. At the low yesterday, the Dow Jones was down nearly 800 points and it had tumbled more...
READ MORE
MEMBERS ONLY
U.S. Stock Futures Plummeting; Caution Is The Word
by Tom Bowley,
Chief Market Strategist, EarningsBeats.com
Market Recap for Wednesday, December 5, 2018
The U.S. stock market was closed.
Pre-Market Action
U.S. futures look set to continue Tuesday's rout. The 10 year treasury yield ($TNX) is lower by 3 basis points to 2.89% as money seeks out safety in the defensive...
READ MORE
MEMBERS ONLY
Why Is Everybody Talking About The Yield Curve? What Is All The Fuss About?
by Julius de Kempenaer,
Senior Technical Analyst, StockCharts.com
The yield curve has become a popular subject recently. Also, a few commentators on the site have mentioned the yield curve and its recent movements in their blogs recently. Read articles by Chief John, Greg Schnell, and Arthur Hill.
In my DITC contribution of 18 October, I showed how Relative...
READ MORE
MEMBERS ONLY
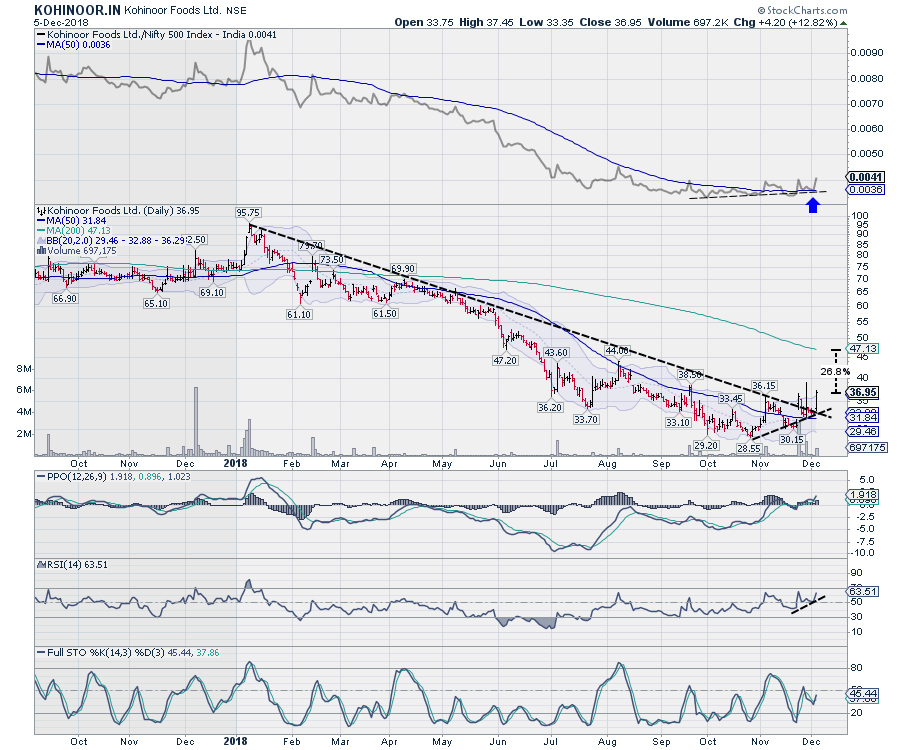
Kohinoor Foods and Godrej Agrovet
by Milan Vaishnav,
Founder and Technical Analyst, EquityResearch.asia and ChartWizard.ae
Kohinoor Foods and Godrej Agrovet have under-performed the broader markets for quite some time. Presently, both of them are set to end their downward trajectory and look for some upward revision in prices over the coming days.
Kohinoor Foods Ltd (KOHINOOR.IN)
After hitting a high of 95.75 in...
READ MORE
MEMBERS ONLY

An Emerging Market Trading above its 200-day
by Arthur Hill,
Chief Technical Strategist, TrendInvestorPro.com
The S&P 500 is below its 200-day moving average and most country indexes are also below their 200-day moving averages. Two emerging countries, however, stand out in this crowd: Indonesia and the Philippines.
The first chart shows the Indonesia iShares (EIDO) and the DJ Indonesia Index ($IDDOW) with...
READ MORE
MEMBERS ONLY
REVIEWING THE PHILOSOPHY OF TECHNICAL ANALYSIS -- CHARTS ACT AS LEADING INDICATORS OF FUNDAMENTAL INFORMATION -- THIS WEEK'S PLUNGE IN BOND YIELDS SUGGESTS ECONOMY WEAKENING -- FALLING STOCKS TOLD US THE SAME THING A MONTH AGO
by John Murphy,
Chief Technical Analyst, StockCharts.com
WHY WE LOOK AT CHARTS ... I've written several messages since the start of October about why the sharp stock market drop that month was most likely the start of a major topping process. Previous messages used Elliott Waves, the unusually old age of the current bull market (and...
READ MORE
MEMBERS ONLY
Impulsive Selling Dominates, Dow Jones Drops 800....What Does It Mean?
by Tom Bowley,
Chief Market Strategist, EarningsBeats.com
Market Recap for Tuesday, December 4, 2018
Don't be swayed by market commentary that discusses lack of volume yesterday as a positive. First of all, the Dow Jones fell 800 points. 800!!! And that's somehow a positive? We lost 20 hour EMA support on the intraday...
READ MORE
MEMBERS ONLY

PLUNGING BOND YIELDS SEND SIGNAL OF ECONOMIC WEAKNESS -- S&P 500 FALLS BELOW 200-DAY AVERAGE AFTER FAILING TEST OF NOVEMBER HIGH -- BIGGEST LOSERS ARE BANKS, SMALL CAPS, SEMIS, AND TRANSPORTS -- UTILITIES HIT NEW HIGHS AND ARE THE ONLY WINNERS
by John Murphy,
Chief Technical Analyst, StockCharts.com
TEN-YEAR TREASURY YIELD PLUNGES BELOW ITS 200-DAY AVERAGE ... Chart 1 shows the 10-Year Treasury yield plunging to the lowest level in three months and falling below its 200-day average for the first time in more than a year. That means that investors are putting a lot of money into Treasury...
READ MORE
MEMBERS ONLY
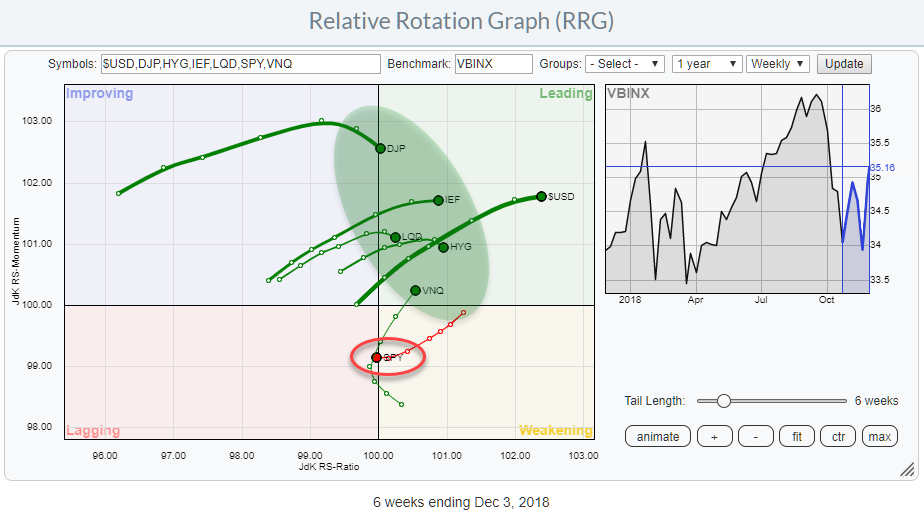
RRG Says Stocks Are The Weakest Asset Class
by Julius de Kempenaer,
Senior Technical Analyst, StockCharts.com
The Relative Rotation Graphs shows the rotation of various asset classes around a balance benchmark portfolio (VBINX).
The message could not be more clear. Stocks (SPY) just crossed over from weakening into the lagging quadrant while ALL other asset classes are inside the leading quadrant.
This is a pretty clear...
READ MORE