MEMBERS ONLY
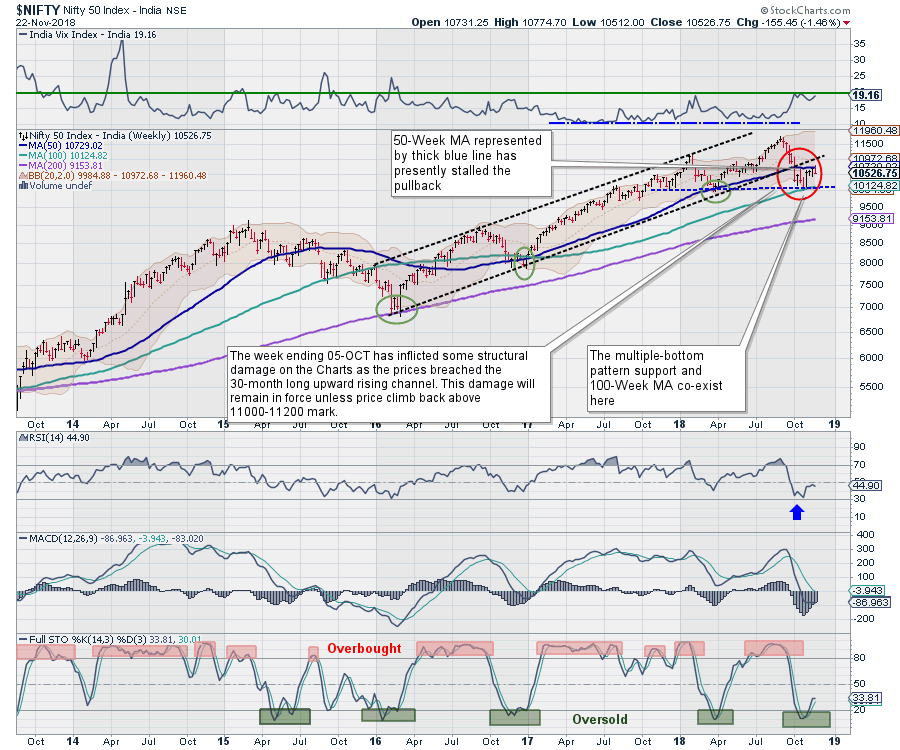
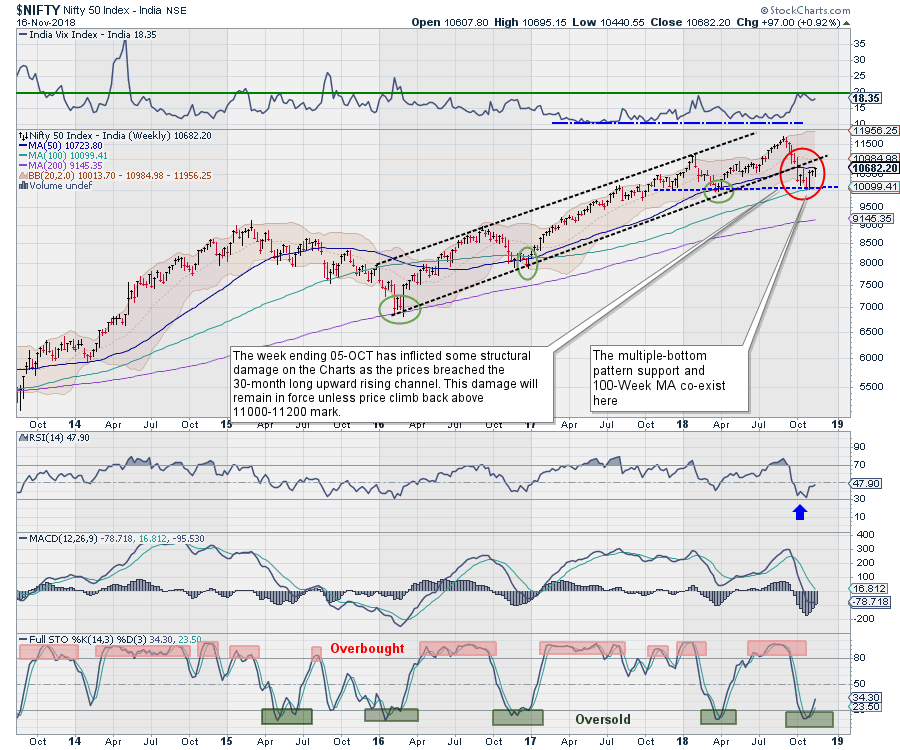
Expiry Week Ahead: NIFTY rules below 50-Week MA for seven weeks; up moves likely to remain capped

by Milan Vaishnav,
Founder and Technical Analyst, EquityResearch.asia and ChartWizard.ae
In this short trading week, the equities ended the week on a negative note. In a week that saw the Markets moving in the 250-points range, the NIFTY ended the week near its lowest point. The benchmark Index lost 155.45 points (-1.46%) on weekly basis.
It was for...
READ MORE
MEMBERS ONLY
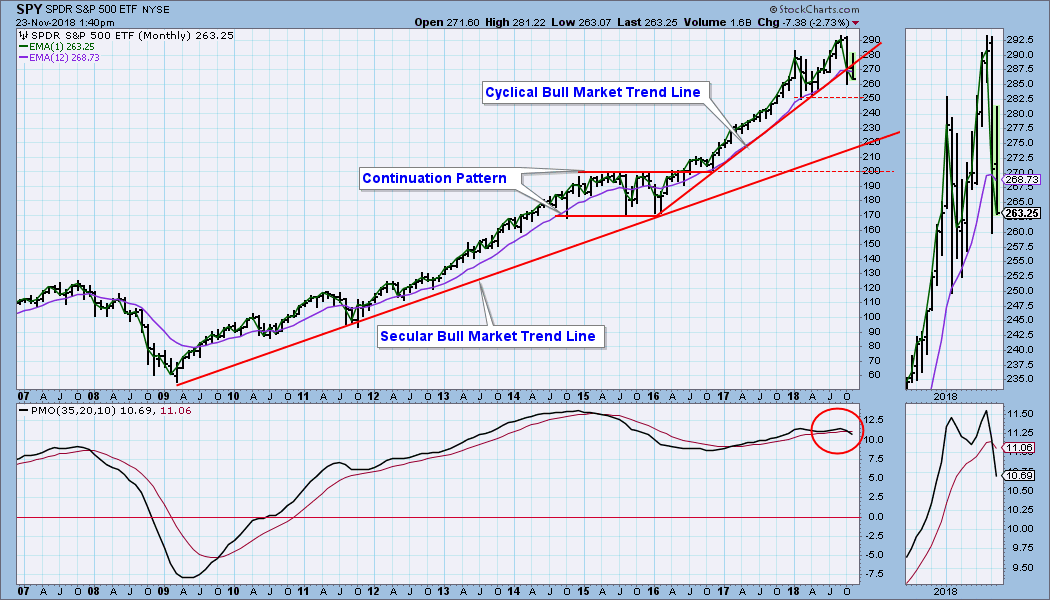
DP Weekly Wrap: Looks Like a Bear to Me

by Carl Swenlin,
President and Founder, DecisionPoint.com
This monthly chart doesn't become final until the end of this month (next Friday), but there is strong evidence here that we are in a bear market. The cyclical bull market rising trend line has been decisively broken, and the monthly PMO is below the signal line and...
READ MORE
MEMBERS ONLY
Friday After Thanksgiving Generally Belongs To The Bulls

by Tom Bowley,
Chief Market Strategist, EarningsBeats.com
Market Recap for Wednesday, November 21, 2018
Wall Street was mostly higher on Wednesday, although, by just about any other measure, it was a disappointing session. The early morning gap higher was essentially where the bullishness ended and there was a slow drift lower throughout the balance of the day....
READ MORE
MEMBERS ONLY
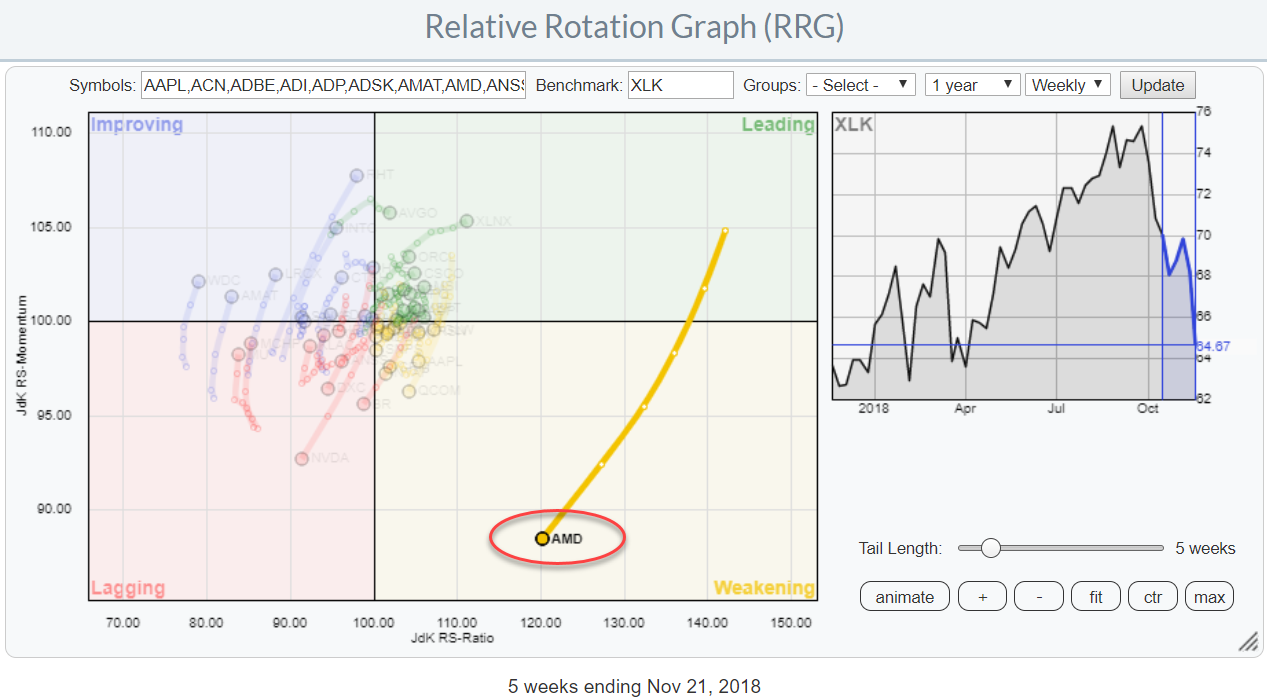
This Technology stock lost 50% of its value but is now hitting support levels.

by Julius de Kempenaer,
Senior Technical Analyst, StockCharts.com
The Relative Rotation Graph for the technology stocks in XLK (Technology select sector SPDR) shows one big outlier that recently went through a big rotation. It crossed from improving to leading in June then pushed to a JdK RS-Ratio value over 140 before rolling over. Three weeks ago the rotation...
READ MORE
MEMBERS ONLY

AN EVENTUAL RETEST OF FIRST HALF LOWS STILL LOOKS LIKELY -- IN ORDER TO PREVENT THAT, OCTOBER LOWS HAVE TO HOLD -- FOR THAT TO HAPPEN, SOME SHORT-TERM CHART BARRIERS NEED TO BE OVERCOME --

by John Murphy,
Chief Technical Analyst, StockCharts.com
S&P 500 IS RETESTING ITS OCTOBER LOW ... Since the nearly nearly three year uptrend that started in stocks in early 2016 appears to have peaked, an eventual retest of early 2018 lows appears likely. That would mean an eventual retest of February/April lows on the S&...
READ MORE
MEMBERS ONLY
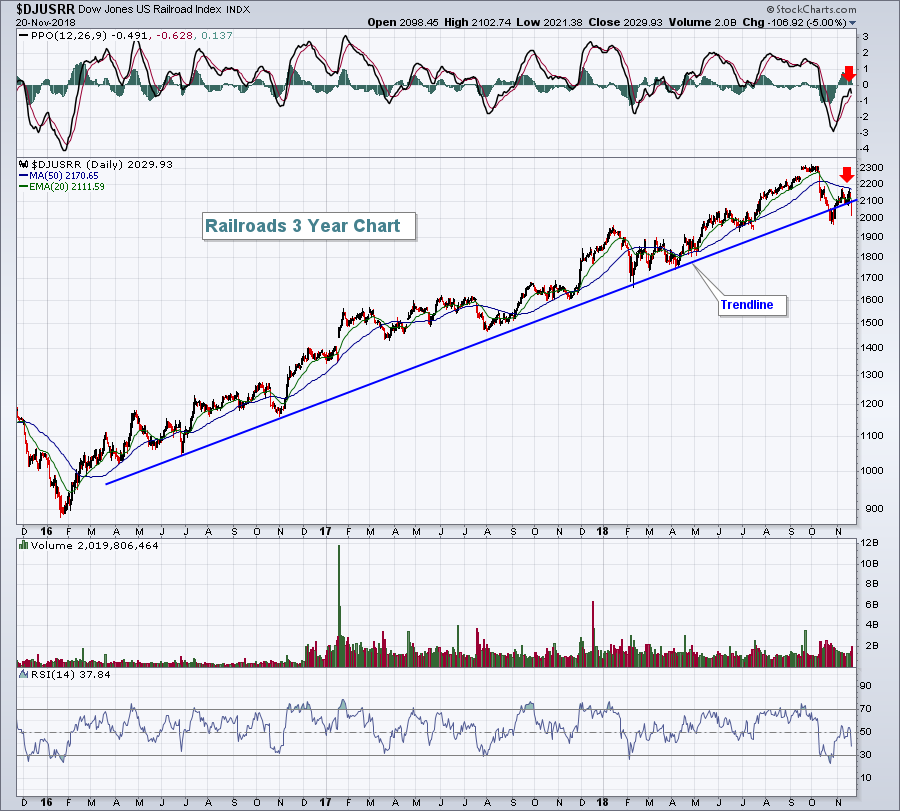
VIX Hits November High; Apparel Retailers, Railroads Crushed
by Tom Bowley,
Chief Market Strategist, EarningsBeats.com
Market Recap for Tuesday, November 20, 2018
It was another ugly day for U.S. equities as the February price support on our major indices draws closer and closer. Volatility shot higher as panicked, impulsive selling once again gripped Wall Street. Energy (XLE, -3.28%), consumer discretionary (XLY, -2.26%...
READ MORE
MEMBERS ONLY

A Global Logistics Player Hits Resistance

by Arthur Hill,
Chief Technical Strategist, TrendInvestorPro.com
United Parcel Service (UPS) is a global player in logistics and package delivery. The outlook for the global economy is surely dimming with the Shanghai Composite ($SSEC) falling all year, the German DAX Index ($DAX) and French CAC Index ($CAC) hitting new lows, and the S&P 500 turning...
READ MORE
MEMBERS ONLY
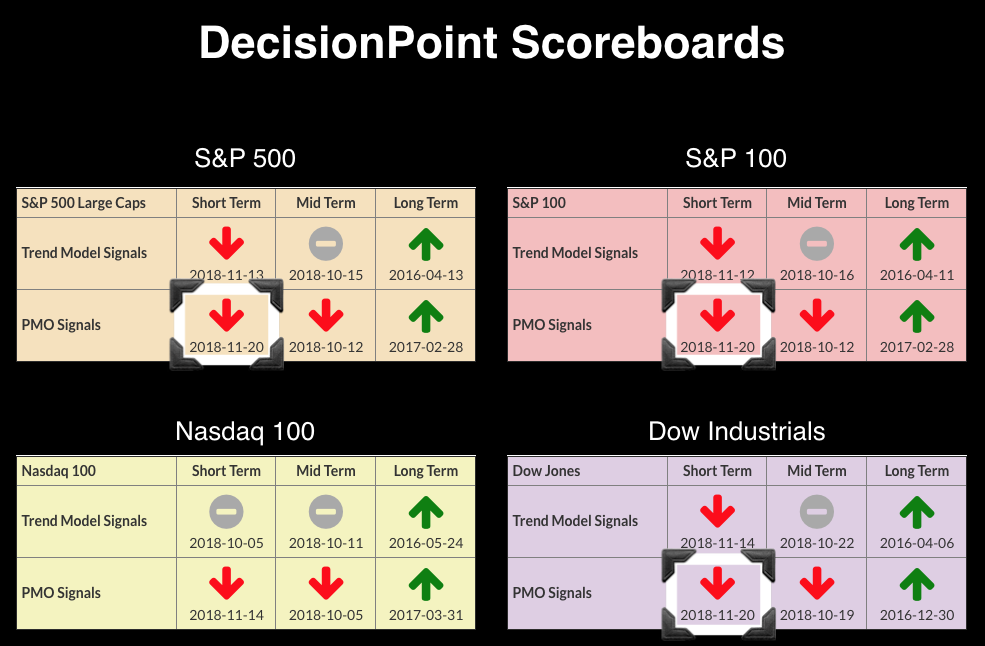
PMO Preludes to Bear Markets - New PMO SELL Signals on Scoreboards

by Erin Swenlin,
Vice President, DecisionPoint.com
The Price Momentum Oscillators (PMOs) seem to have a few unusual characteristics in the period before bear markets. I believe that the current PMO set-up on the SPX is dangerously close to mimicking those bear market preludes. I decided to do a historical study when I noticed all four DP...
READ MORE
MEMBERS ONLY

Plotting breadth indicators on Relative Rotation Graphs - Part I
by Julius de Kempenaer,
Senior Technical Analyst, StockCharts.com
In my contribution to last week's Chartwatchers newsletter, I mentioned my current experiment on using breadth indicators on a Relative Rotation Graph.
In this article, I want to take a look at a few of these setups side by side and see if there is indeed a leading...
READ MORE
MEMBERS ONLY
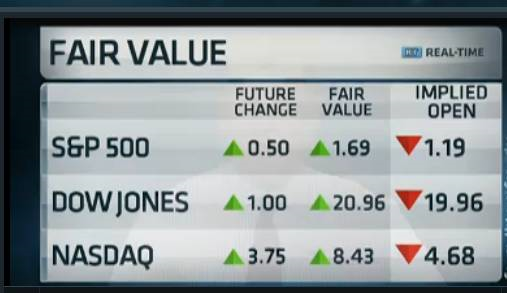
Infatuation with Morning Futures Fair Value

by Greg Morris,
Veteran Technical Analyst, Investor, and Author
Infatuation: in·fat·u·a·tion
Noun: infatuation; plural noun: infatuations
An intense but short-lived passion or admiration for someone or something.
I cannot begin to tell you how often I am asked about morning futures fair value to tell me if I’m going to invest that day based...
READ MORE
MEMBERS ONLY
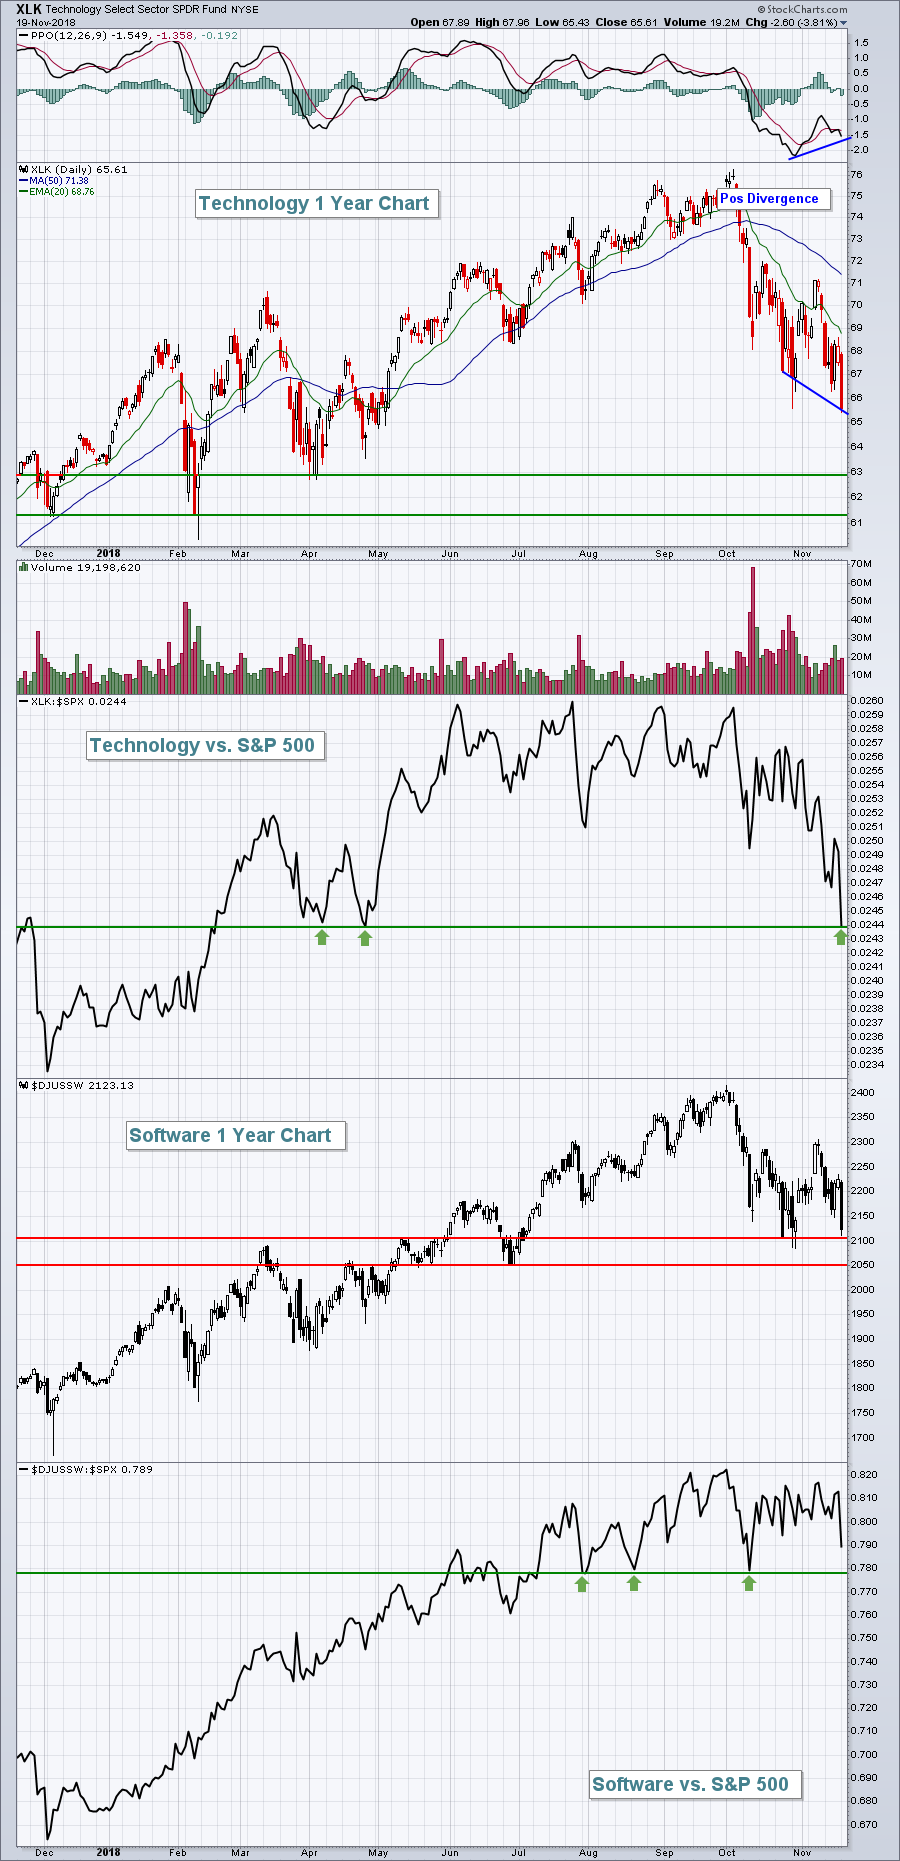
Impulsive Selling Returns And VIX Spikes Amid Technology Assault; Futures Tanking
by Tom Bowley,
Chief Market Strategist, EarningsBeats.com
Market Recap for Monday, November 19, 2018
I'd like to say something good about yesterday's action on Wall Street, but I don't think there's anything to be said. Impulsive selling returned with little in the way of a bid on technology stocks...
READ MORE
MEMBERS ONLY

Confidence Is Eroding Just When It's Needed

by Martin Pring,
President, Pring Research
* Indexes on the Brink
* Confidence Relationships Starting to Break Down
* Watch the Stock/Bond Ratio
Indexes on the Brink
More than once a week, I make sure to check several ratios that tell me whether investors and traders are getting more or less confident. These relationships, which we will get...
READ MORE
MEMBERS ONLY

HEADLINE FROM OCTOBER 13: WEEKLY AND MONTHLY CHARTS ARE SENDING MORE SERIOUS WARNING SIGNS -- ELLIOTT WAVE ANALYSIS ALSO SUGGESTS THAT THE MARKET MAY HAVE COMPLETED ITS NINE-YEAR RUN
by John Murphy,
Chief Technical Analyst, StockCharts.com
CORRECTION: ... My message from last Wednesday showed negative readings on weekly and monthly stock charts, and referred back to an earlier message on that same topic. However, I incorrectly gave a date of May 13. The correct date of that earlier article is October 13, 2018. I also mentioned that...
READ MORE
MEMBERS ONLY
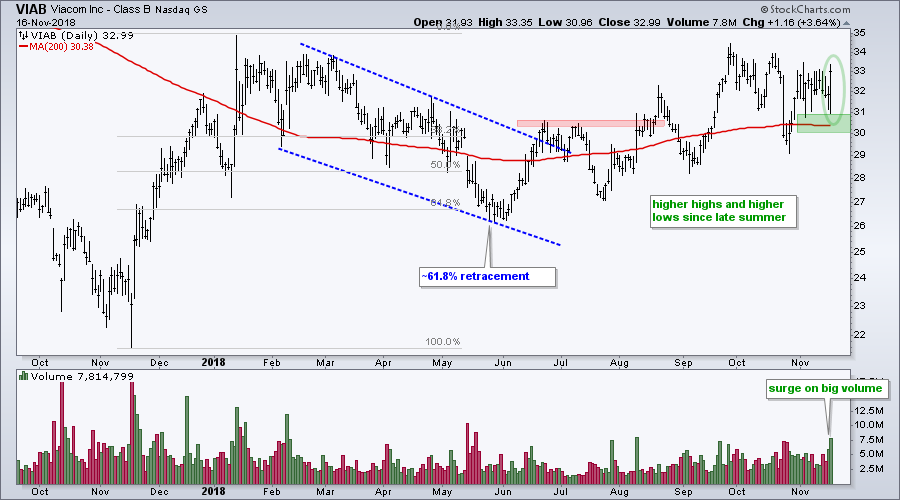
Viacom Makes a Move with Big Volume
by Arthur Hill,
Chief Technical Strategist, TrendInvestorPro.com
Viacom (VIAB) is part of the broadcasting-entertainment industry group, which is part of the Communication Services SPDR (XLC). The stock acted more like a defensive share in the first half of the year by underperforming from January to May. VIAB bottomed in June and outperformed the broader market over the...
READ MORE
MEMBERS ONLY
Small Caps Need To Hold Onto This Price Support
by Tom Bowley,
Chief Market Strategist, EarningsBeats.com
Special Event
Join me and John Hopkins, President of EarningsBeats.com, after the bell today for a 4:30pm EST webinar. I'll be discussing the stocks that I believe represent the best trading opportunities of Q4. These stocks all posted better-than-expected quarterly revenues and EPS and significant accumulation...
READ MORE
MEMBERS ONLY

Volatility, Sentiment, Seasonality and Price - Oh My!
by Arthur Hill,
Chief Technical Strategist, TrendInvestorPro.com
* Defining the Current Market Environment.
* Elliott Wave, Dow Theory and Counter-trend Moves.
* Yearend Seasonality is Bullish.
* Sentiment Reaches Bearish Extremes.
* Focus on the Price Chart!
... Making Adjustments ...
As traders and investors, it is important to understand the current market environment and adjust our strategy accordingly. Are we in a low...
READ MORE
MEMBERS ONLY
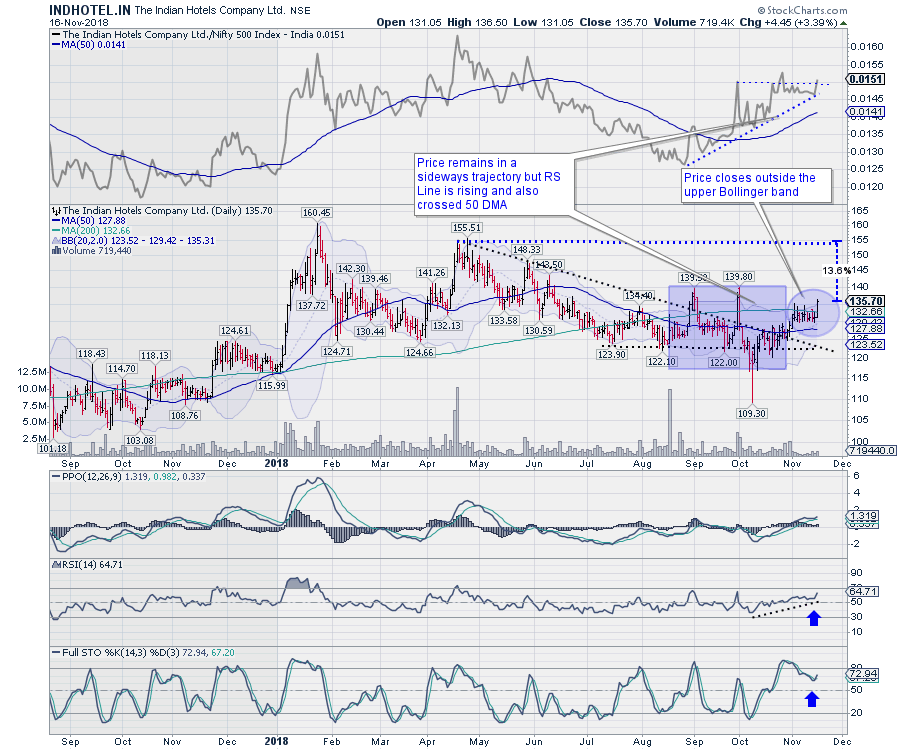
Indian Hotels and Hathway Cables look interesting on Charts
by Milan Vaishnav,
Founder and Technical Analyst, EquityResearch.asia and ChartWizard.ae
The previous week has been very volatile for the NIFTY as the benchmark index remains in the middle of the 150-point turbulent zone of 10600-10750. Two stocks, The Indian Hotels Company Ltd., and Hathway Cable & Datacom Ltd look interesting on the Charts.
The Indian Hotels Company Ltd. (INDHOTEL.IN)...
READ MORE
MEMBERS ONLY
You Must Master These Two Things To Trade Successfully
by Tom Bowley,
Chief Market Strategist, EarningsBeats.com
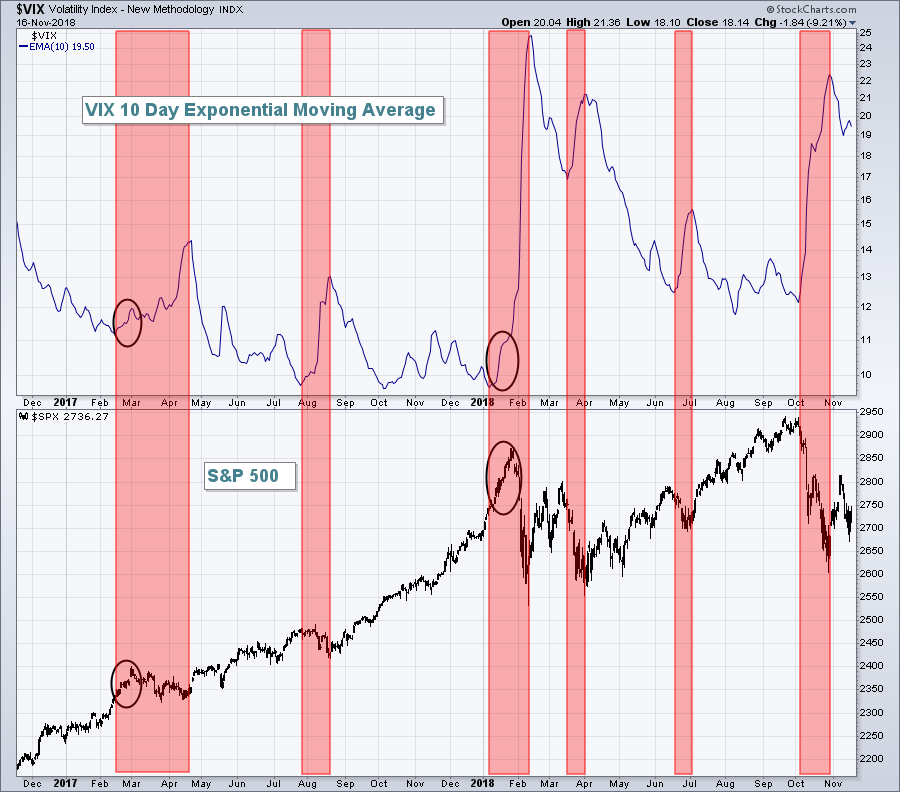
Trading is difficult, emotional and can be quite lonely. We have seen volatility ($VIX) shoot higher, rising from an 11.61 close on October 3rd to a high of 28.84 on October 11th. Since then, we've remained above the key 16-17 support level that typically holds during...
READ MORE
MEMBERS ONLY

STOCK INDEXES STABILIZE BUT LOSE MORE GROUND -- DROP IN RETAILERS AND HOME IMPROVEMENT STOCKS MAKE CONSUMER CYCLICALS MARKET'S WEAKEST SECTOR -- WALMART, MACY'S AND HOME DEPOT FALL ON STRONG EARNINGS -- CONSUMER STAPLES CONTINUE TO OUTPERFORM
by John Murphy,
Chief Technical Analyst, StockCharts.com
DESPITE LATE REBOUND, STOCK INDEXES LOSE GROUND... Despite a rebound on Thursday and Friday, all major U.S. stock indexes lost ground this week. But very little changed on their respective chart patterns. Chart 1 shows an upside reversal on Thursday keeping the Dow Industrials above its 200-day average. But...
READ MORE
MEMBERS ONLY
Taking the Temperature of the Stock Market
by Arthur Hill,
Chief Technical Strategist, TrendInvestorPro.com
The Momentum Factor iShares (MTUM) and the Minimum Volatility iShares (USMV) represent opposing sides of the market. High flying stocks can be found in the momentum ETF, while the more boring issues dominate the minimum volatility ETF.
Using these two ETFs, chartists can quickly take the temperature of the stock...
READ MORE
MEMBERS ONLY
Week Ahead: NIFTY Has Multiple Overhead Resistances to Deal With in This Short Week
by Milan Vaishnav,
Founder and Technical Analyst, EquityResearch.asia and ChartWizard.ae
The Indian Equity Markets spent the entire week on expected lines. The previous week was expected to be turbulent, and the zone of 10600-10750 was set to pose stiff resistance to the Markets. On these analyzed lines, the NIFTY continued to remain volatile all throughout the week. The benchmark Index...
READ MORE
MEMBERS ONLY
You Really CAN Make Money in a Rough Market Environment

by John Hopkins,
President and Co-founder, EarningsBeats.com
The quarter beginning 10-1-18 has been challenging for a lot of traders. The NASDAQ has lost almost 10% while the S&P has lost 6%, both well off the quarter's low. Volatility has reigned with the VIX at elevated levels for most of the quarter. It has...
READ MORE
MEMBERS ONLY
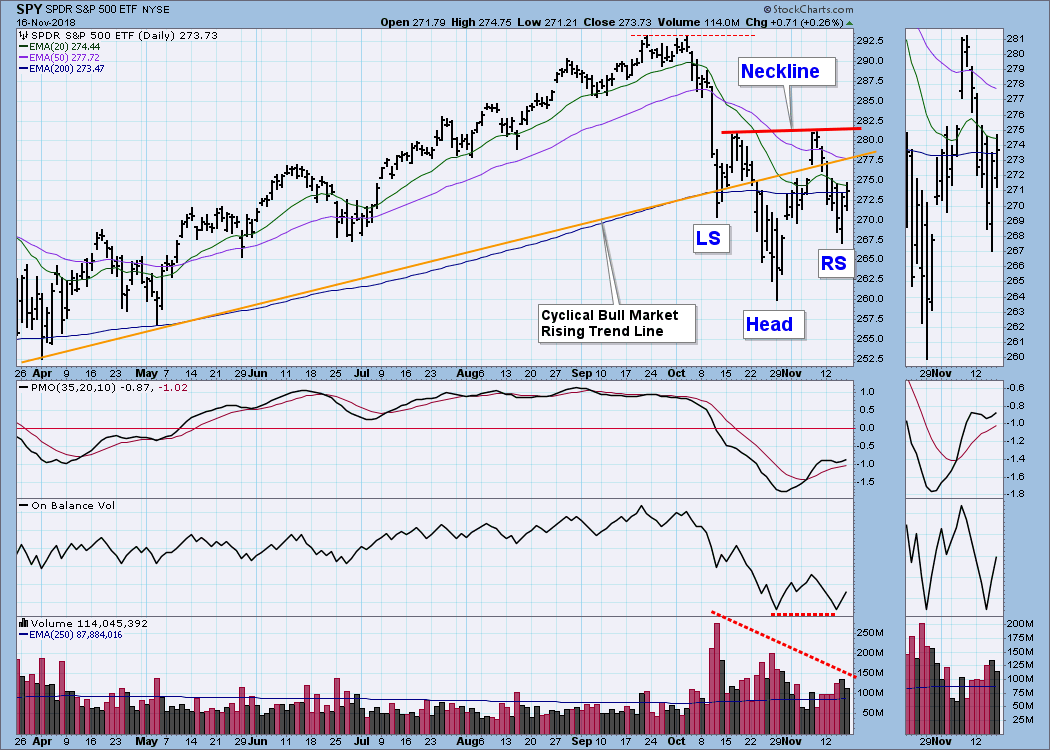
DP Weekly Wrap: Does SPY Have Bullish Reverse H&S? Gold Sentiment Is Looking Contrarian
by Carl Swenlin,
President and Founder, DecisionPoint.com
A lot of people are seeing a reverse head and shoulders pattern developing, and it is really not hard to spot. From Friday's close, it will take a rally of a little less than 3% for price to reach the neckline. Add another 4.5% and new, all-time...
READ MORE
MEMBERS ONLY
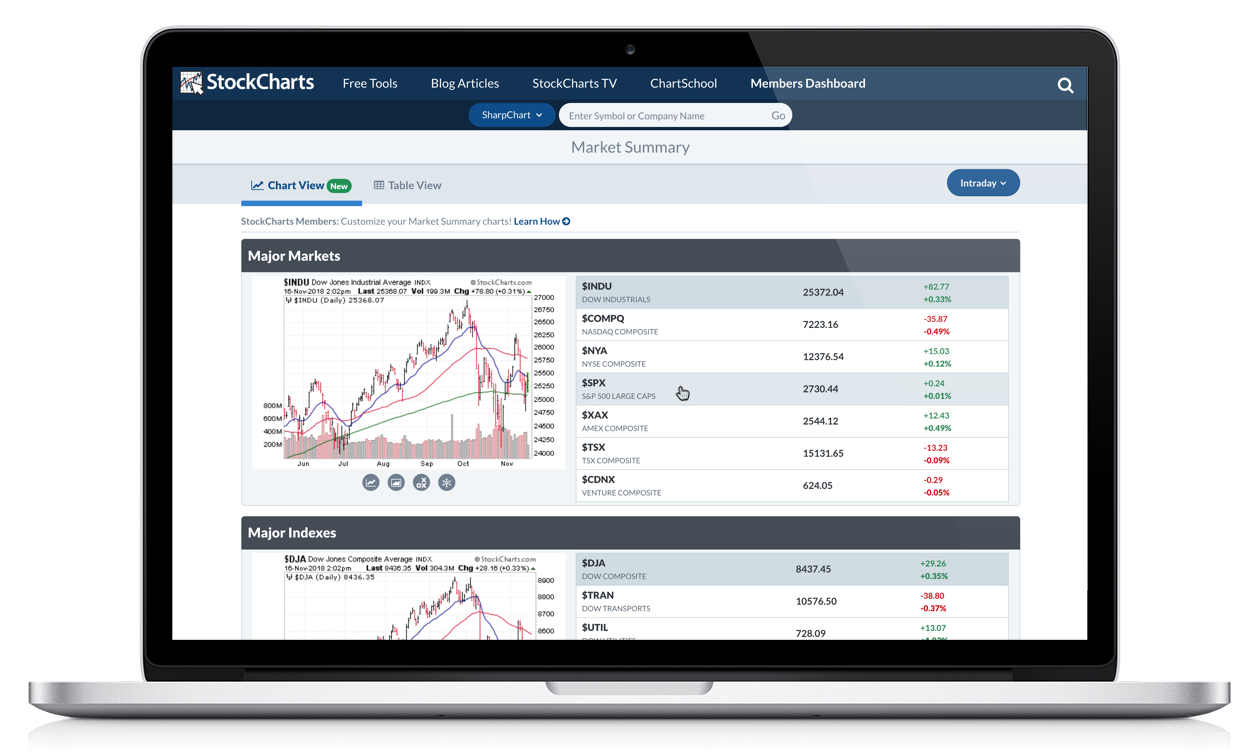
NEW! Introducing "Chart View" For Market And Industry Summary Pages

by Grayson Roze,
Chief Strategist, StockCharts.com
The more charts, the better. That's my motto, especially this week. I'm happy to announce that our Market Summary and Industry Summary pages have recently received a major upgrade – "Chart View" is here! We've expanded the functionality of these two important pages,...
READ MORE
MEMBERS ONLY
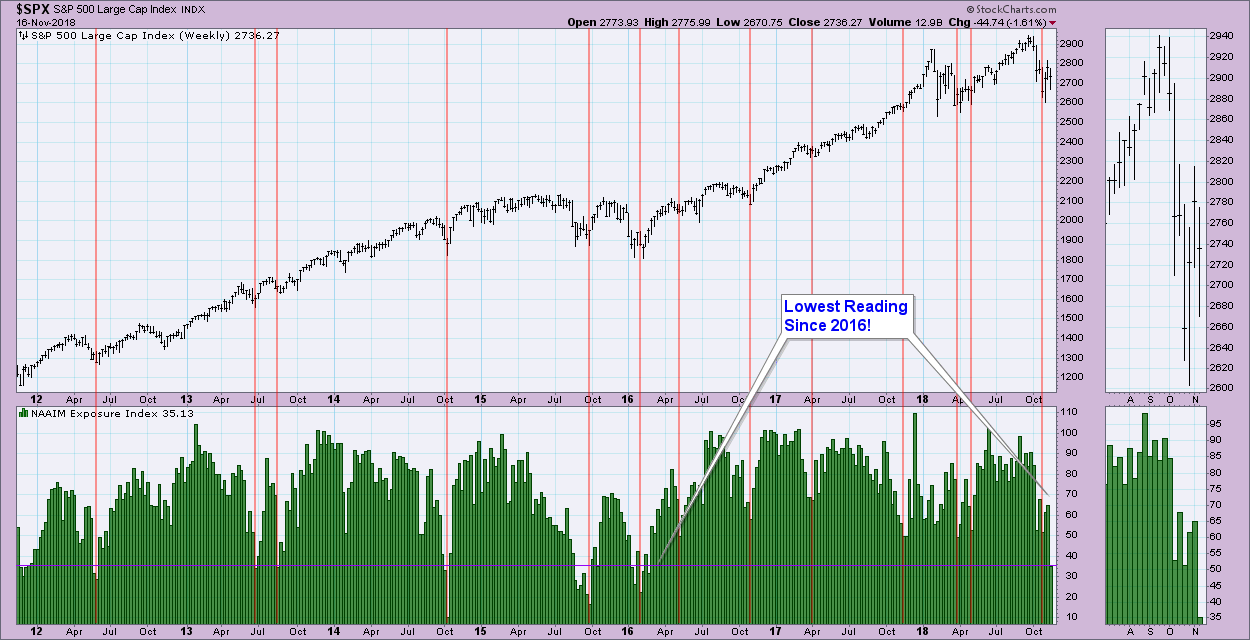
Money Managers Report Lowest Exposure Since Early 2016
by Erin Swenlin,
Vice President, DecisionPoint.com
One of the sentiment indicators that I update MarketWatchers LIVE viewers on each Friday is the National Association of Active Investment Managers (NAAIM) exposure reading. A few things you should know about these guys. NAAIM’s membership ranges from small regional firms to large national firms, including hedge fund managers,...
READ MORE
MEMBERS ONLY
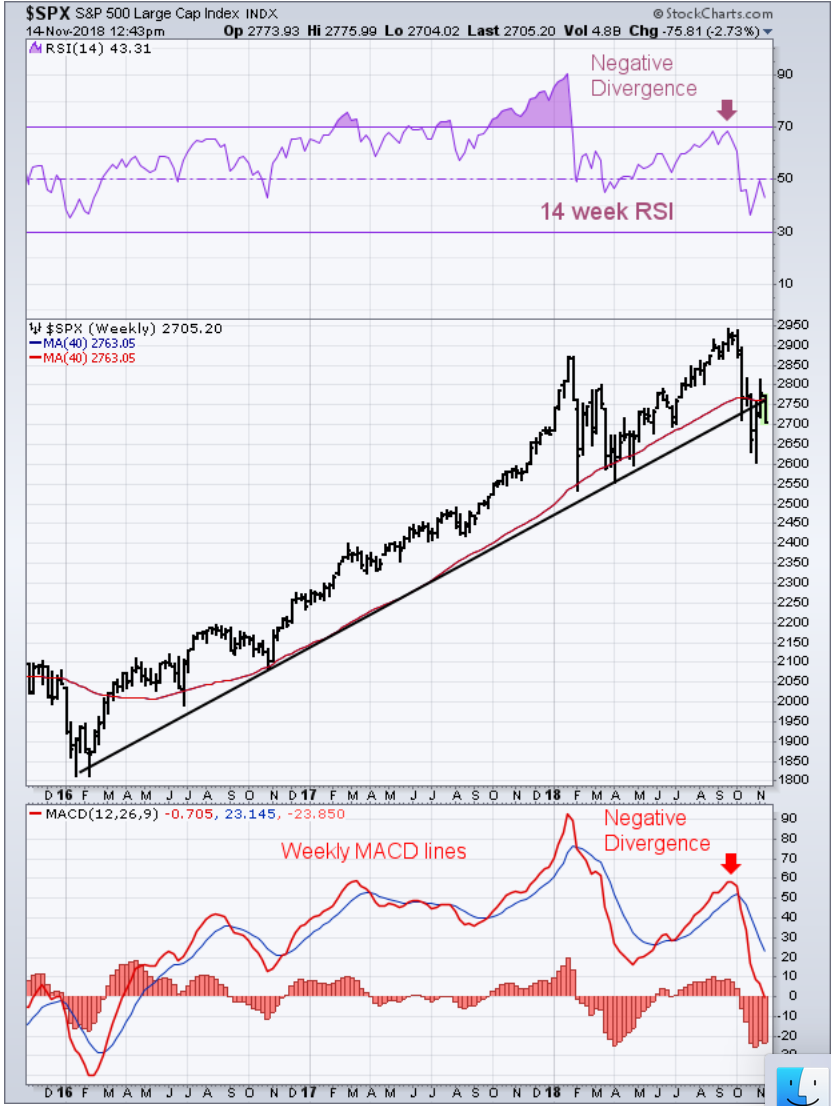
The Reason Short-Term Rallies are Failing is Because Weekly Charts Look Even More Negative
by John Murphy,
Chief Technical Analyst, StockCharts.com
Editor's Note: This article was originally published in John Murphy's Market Message on Wednesday, November 14th at 1:39pm ET.
The weekly bars in Chart 2 show the last upleg of the S&P 500 uptrend that began in early 2016. And it shows that...
READ MORE
MEMBERS ONLY

Experimenting with breadth on Relative Rotation Graphs
by Julius de Kempenaer,
Senior Technical Analyst, StockCharts.com
Various breadth indicators are used to analyze the underlying strength or weakness of a broad market index like the S&P 500 index or NYSE. Over the years a number of different breadth indicators have been developed and/or used in their work by well known technical analysts.
A...
READ MORE
MEMBERS ONLY

ETF Guru Retires: Leaves Us with Six Key Lessons

by Gatis Roze,
Author, "Tensile Trading"
This is a salute to Ben Johnson, the departing editor of Morningstar’s ETF Investor publication. Over the years, I’ve come to look forward to his pithy observations about the ETF marketplace. To use his own words in describing his replacement, Alex Bryan, he wrote “He’s bright, articulate...
READ MORE
MEMBERS ONLY

Weekly Market Review & Outlook (with video) - Digesting the Breakdowns
by Arthur Hill,
Chief Technical Strategist, TrendInvestorPro.com
* Performance Overview.
* Ranging after Breakdown.
* Other Bearish Developments.
* Volatility Heats Up.
* Momentum versus Low Volatility.
* Staples and Utes Hold Up.
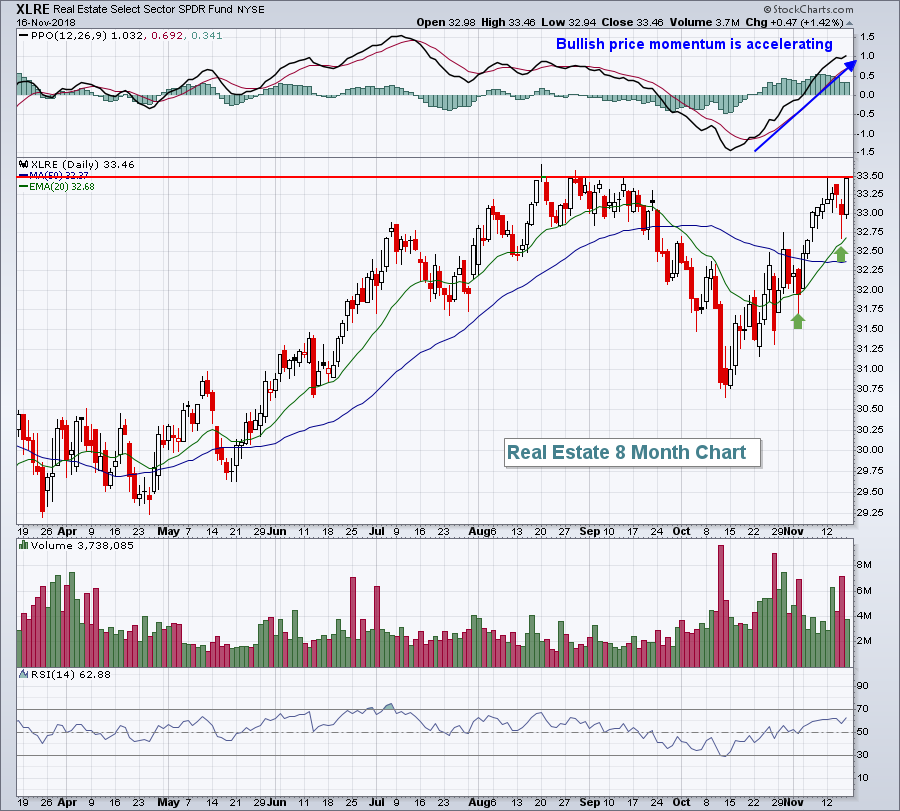
* Healthcare and REITs Outperform.
* Big Bounces within even Bigger Downtrends.
* Notes from the Art's Charts ChartList.
... Ranging after Breakdown
The S&P 500 was thrown off trend...
READ MORE
MEMBERS ONLY
History Supports Bullish Move But Earnings Last Night Could Dampen Bulls' Victory Thursday
by Tom Bowley,
Chief Market Strategist, EarningsBeats.com
Reminder
I post a blog article every morning that the stock market is open in a format similar to today's article. If you haven't already subscribed (for FREE) and would like to, simply scroll to the bottom of this article and type your email address into...
READ MORE
MEMBERS ONLY
30% Gain From Here Over Next Year Possible? This Chart Says YES
by Tom Bowley,
Chief Market Strategist, EarningsBeats.com
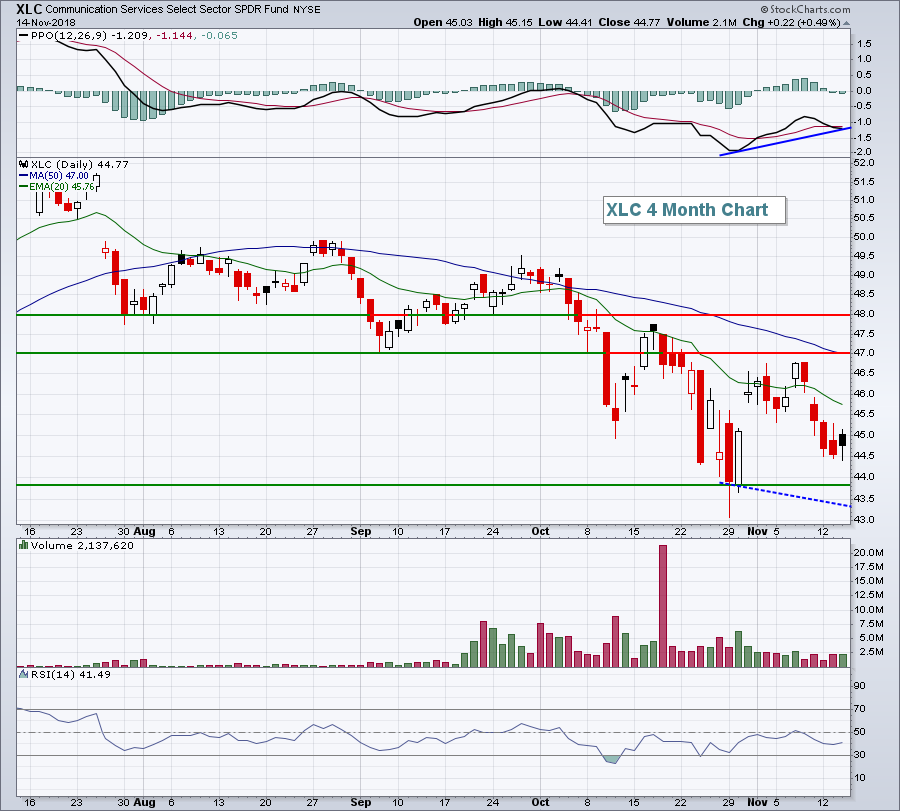
Market Recap for Wednesday, November 14, 2018
In a rare twist, communication services (XLC, +0.49%) was the only sector to gain ground yesterday. The group has underperformed the S&P 500 badly since its July relative high with Facebook's (FB) quarterly earnings report on July 25th...
READ MORE
MEMBERS ONLY
Small cap stocks are leading the market lower.
by Julius de Kempenaer,
Senior Technical Analyst, StockCharts.com
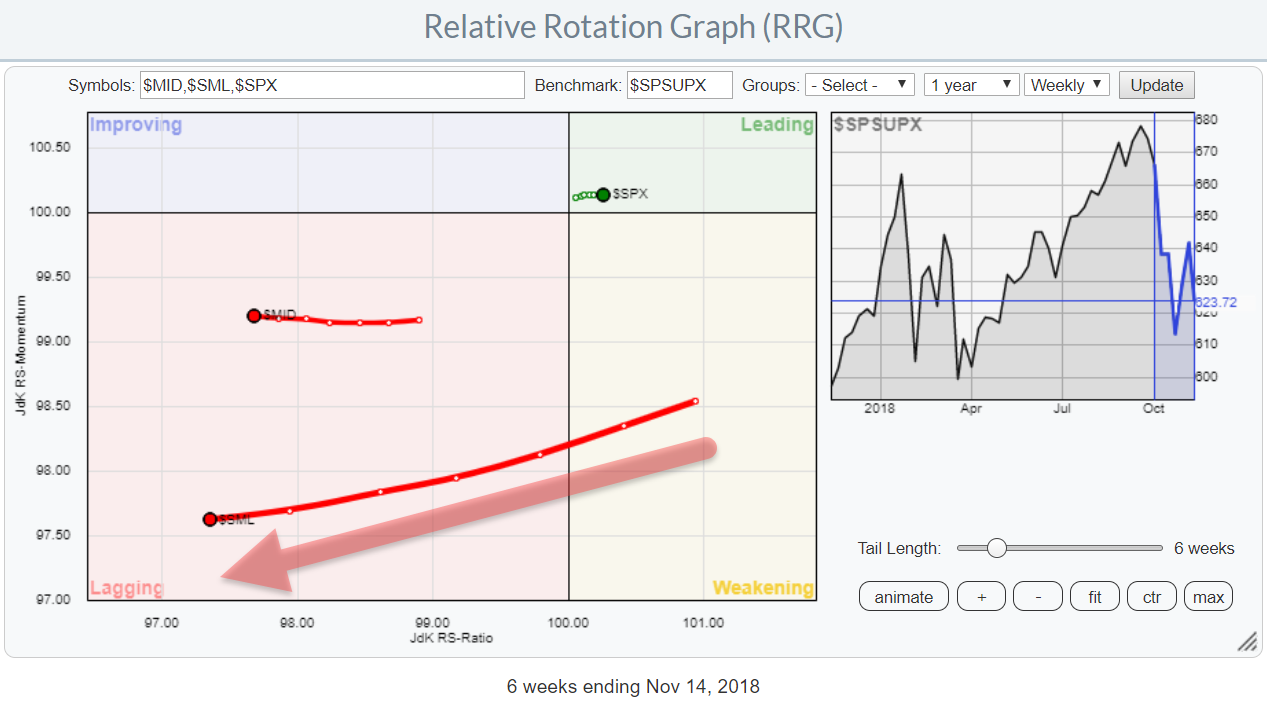
There are many indexes available to monitor and analyze the stock market. The S&P500, together with Daddy "Dow" being among the more popular ones.
But the S&P 500, although covering 500 stocks, is only looking at one segment of the total market. Only large-cap...
READ MORE
MEMBERS ONLY

DP Alert: Two More ST SELL Signals - Monthly PMO SELL Signals Likely
by Erin Swenlin,
Vice President, DecisionPoint.com
Before I get into the nitty gritty here, I want to relate a story of what literally (yes, literally) just happened to me about 10 minutes ago. I got a text from my 10-year old nephew, "Is there anyway I can check what is happening to the Nestle stock...
READ MORE
MEMBERS ONLY
Trade Setup - Tandem (TNDM) In Real Time
by Tom Bowley,
Chief Market Strategist, EarningsBeats.com
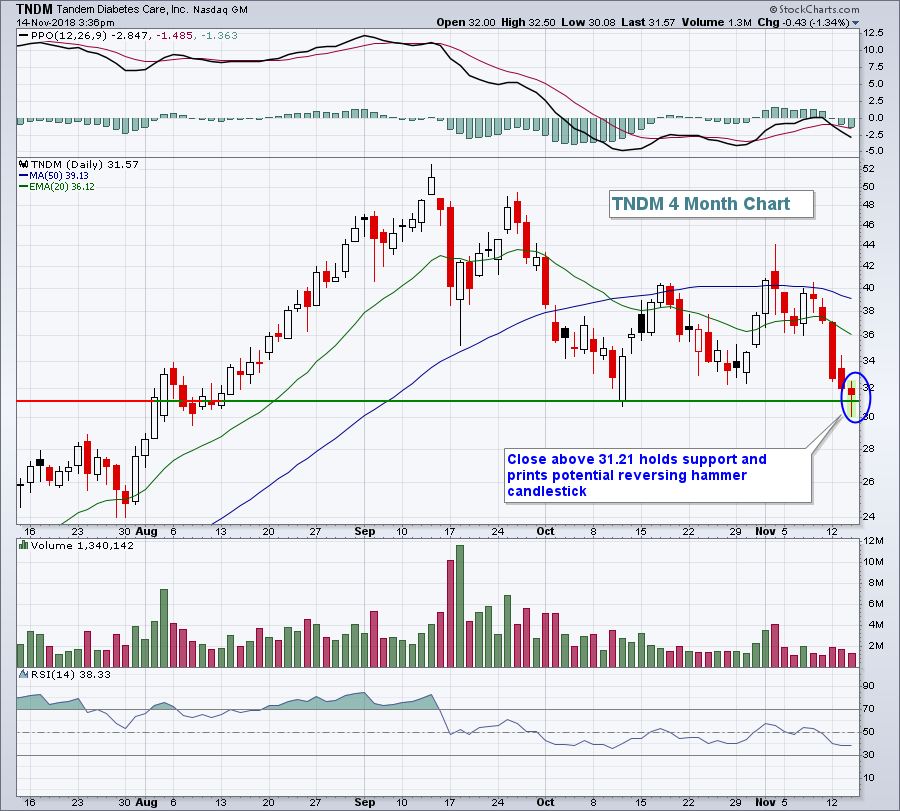
From a trading perspective, I wanted to give you a quick idea of what I look for in a trade. I bought Tandem Diabetes Care (TNDM) when it crossed back above 31.21 and I'll hold it unless it closes beneath 31.00 or moves intraday beneath 30....
READ MORE
MEMBERS ONLY

STOCKS CONTINUE THEIR NOVEMBER SLIDE -- THE S&P 500 MAY RETEST ITS LATE OCTOBER LOW -- THE REASON SHORT-TERM RALLIES ARE FAILING IS BECAUSE WEEKLY CHARTS LOOK EVEN MORE NEGATIVE -- THE S&P 500 MONTHLY CHART ALSO SHOWS SIGNS OF WEAKENING
by John Murphy,
Chief Technical Analyst, StockCharts.com
SHORT-TERM STOCK TREND CONTINUES TO WEAKEN ... Today's higher open is giving way to more afternoon selling. We've seen that same pattern over the past week as stock prices have started to slide again. The daily bars in Chart 1 show the S&P 500 Index...
READ MORE
MEMBERS ONLY

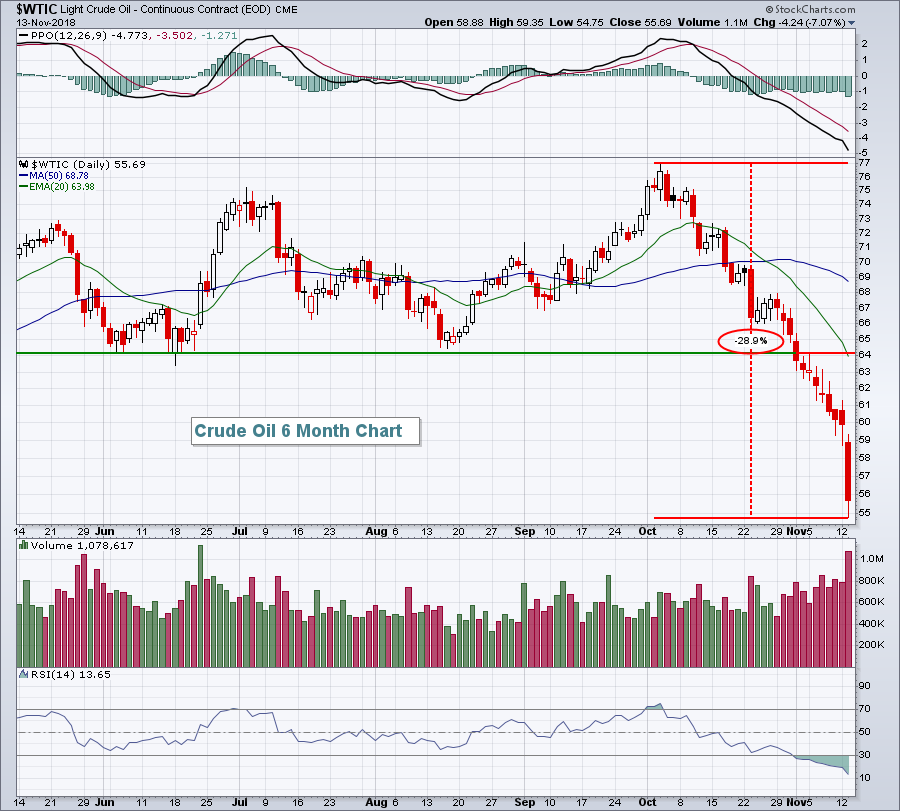
Has Oil Hit A Temporary Bottom?
by Martin Pring,
President, Pring Research
* Commodities in General Remain in a Bear Market
* Oil is Also in a Primary Bear Market
* The Chart That Says That Some Kind of Bottom is at Hand
I last wrote about oil back in early August, in an article entitled More Evidence Of A Commodity Bear Market. Back then,...
READ MORE
MEMBERS ONLY
These Two Stocks Present Short-Term Opportunities
by Milan Vaishnav,
Founder and Technical Analyst, EquityResearch.asia and ChartWizard.ae
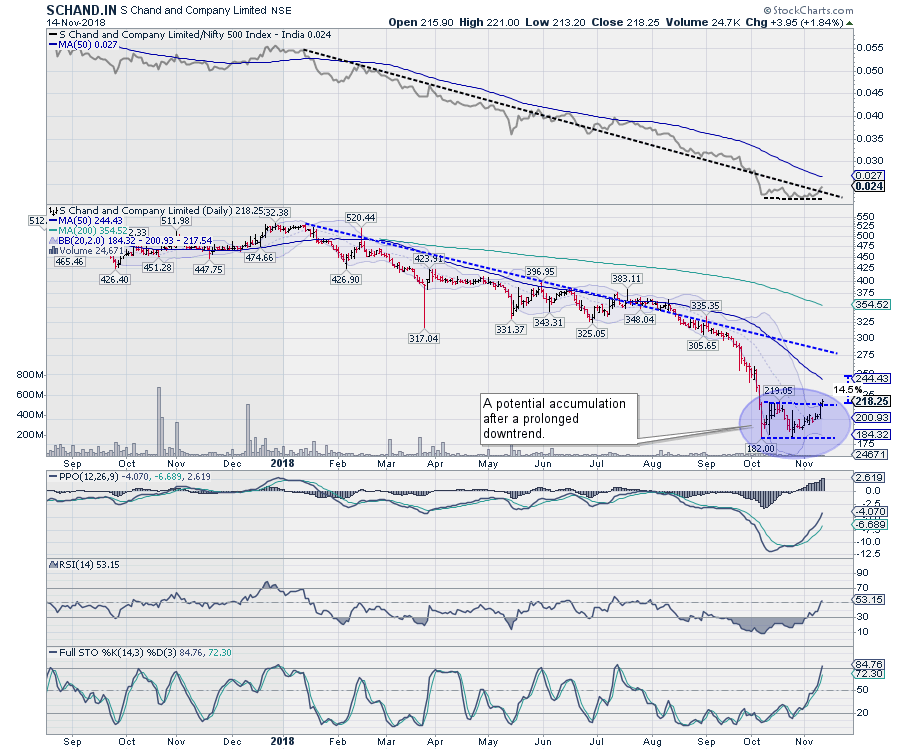
Potential Trend Reversal in SCHAND.IN
S Chand And Company Limited (SCHAND.IN) is one of the leading publishing houses in India. In May 2017, the stock listed at 673. Over the following 17 months, the stock saw its value erode by ~73% as the stock remained in a secular...
READ MORE
MEMBERS ONLY

Key Levels for SPY and QQQ
by Arthur Hill,
Chief Technical Strategist, TrendInvestorPro.com
* SPY Draws a Line in the Sand.
* QQQ Lags SPY on Rebound.
* Scanning for 5-day ROC.
* Auto Parts Stocks Stand Out.
* On Trend on Youtube.
... SPY Draws a Line in the Sand
... The S&P 500 SPDR (SPY) and the Nasdaq 100 ETF (QQQ) gapped up the day after...
READ MORE
MEMBERS ONLY
Gold Downtrend Resuming As Is S&P 500's
by Tom Bowley,
Chief Market Strategist, EarningsBeats.com
Market Recap for Tuesday, November 13, 2018
Losses weren't big on Tuesday as the Dow Jones dropped just 0.40% and was the worst performing of our major indices. But it seemed to be more of a continuation of the recent downtrend as all key areas of the...
READ MORE
MEMBERS ONLY

Thoughts on Technical Indicators
by Greg Morris,
Veteran Technical Analyst, Investor, and Author
There is a myriad of technical indicators available to traders, and regardless of which indicators are used, blending them with other tools and good charting skills can produce a more in-depth picture of the price action. For example, a stock may be approaching a support level defined by a trend...
READ MORE