MEMBERS ONLY
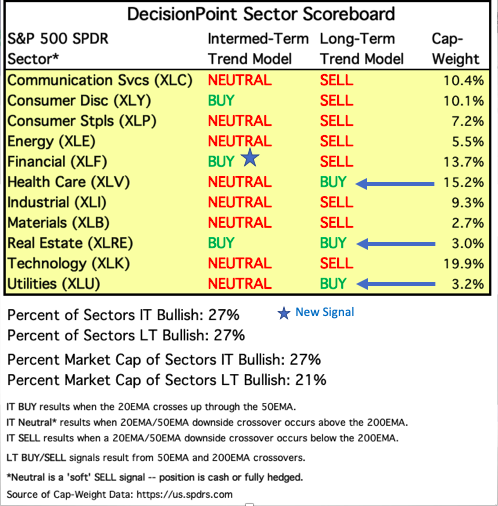
Financial SPDR (XLF) Adds New IT Trend Model BUY Signal

by Erin Swenlin,
Vice President, DecisionPoint.com
Last week, the Consumer Discretionary/Cyclicals SPDR posted a new Intermediate-Term Trend Model (ITTM) BUY signal. Today, the Financial SPDR (XLF) joined in with its own ITTM BUY signal. In the long term, we can see that the only sectors with Long-Term Trend Model (LTTM) BUY signals are the defensive...
READ MORE
MEMBERS ONLY

If The Economy Is Truly Weakening, Commodities Should Be Vulnerable

by Martin Pring,
President, Pring Research
* The Long-Term Trend for Commodities Remains Bearish
* What the Stock Market is Telling Us About Commodities
* Short-Term Picture Not So Strong
Recently, we have seen several reports of a weakening economy. These include a sharp drop in both the University of Michigan and Conference Board consumer sentiment and confidence numbers,...
READ MORE
MEMBERS ONLY
Defrosting the Markets: Thoughts on the January Barometer

by David Keller,
President and Chief Strategist, Sierra Alpha Research
I’ve written several articles regarding seasonal trends in the markets, including the four-year Presidential Cycle, the “Sell in May” phenomenon, and even general thoughts on cyclical patterns in price.
This time of year, we’re faced with a very interesting anomaly known as the January Barometer.
This is different...
READ MORE
MEMBERS ONLY
Wall Street Averts Meltdown Despite CAT/NVDA Warnings

by Tom Bowley,
Chief Market Strategist, EarningsBeats.com
Market Recap for Monday, January 28, 2019
It seemed like the bears let a perfect opportunity slip right through their fingers yesterday. Caterpillar (CAT, -9.13%) reported their latest quarterly earnings before the bell and they weren't pretty. Despite beating revenue estimates, CAT posted EPS well below estimates...
READ MORE
MEMBERS ONLY
Another Gap for QQQ

by Arthur Hill,
Chief Technical Strategist, TrendInvestorPro.com
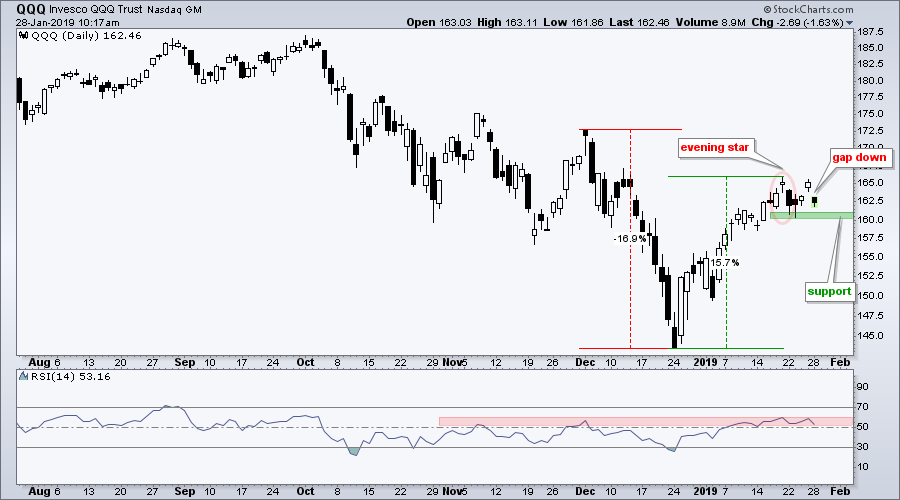
Last week (Monday) I featured an evening star reversal pattern in QQQ. This pattern did not foreshadow further weakness as QQQ firmed in the 161 area the next day and gapped up on Friday. This gap did not last long as QQQ gapped down on Monday morning and filled Friday&...
READ MORE
MEMBERS ONLY

Charts to Keep an Eye on this Week
by Arthur Hill,
Chief Technical Strategist, TrendInvestorPro.com
* Big Four Retake 50-day SMAs.
* %Above 200-day Lags for XLP.
* 52-week Highs for 22 REITs.
* Jobless Claims Hit 40+ Year Low.
* TLT Stalls between Key Levels.
* Dollar Fails to Hold Breakout.
* Gold Breaks out of Small Consolidation.
* Shanghai Composite Forms Potential Double Bottom.
* Delta Turns Indecisive.
* Tesla Goes from Leader...
READ MORE
MEMBERS ONLY
Stocks Finish The Week On A Positive Note, But Overhead Resistance Remains
by Tom Bowley,
Chief Market Strategist, EarningsBeats.com
Market Recap for Friday, January 25, 2019
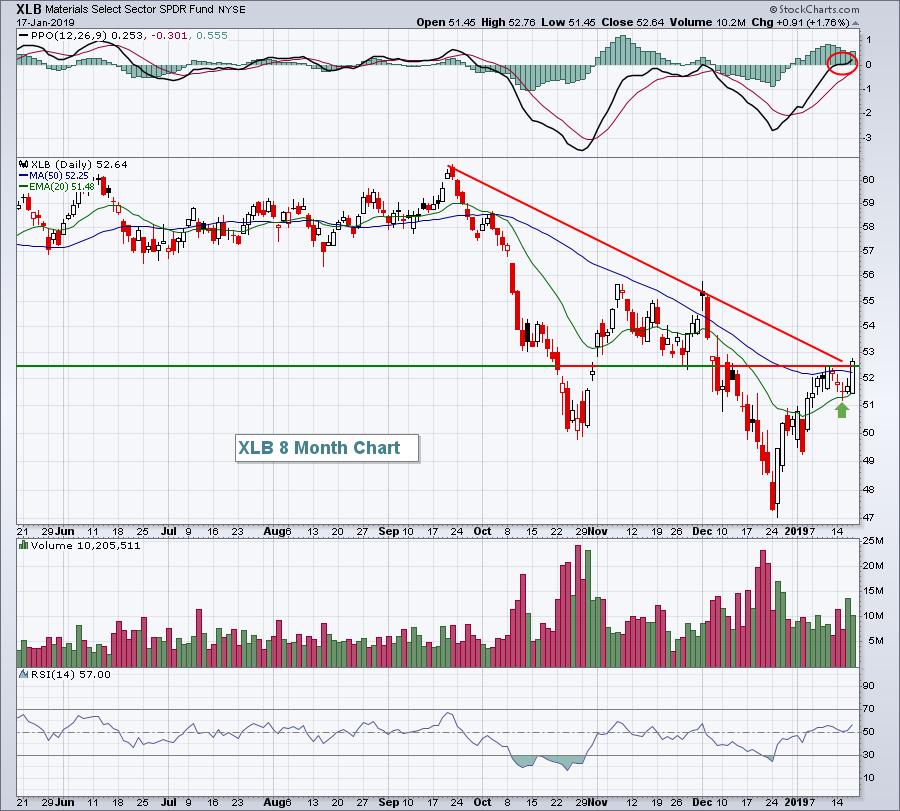
Our major indices rallied strongly on Friday, with 9 of 11 sectors rising to support the move. Only two defensive sectors - utilities (XLU, -1.37%) and consumer staples (XLP, -0.40%) failed to participate in the advance. Leading the charge was materials...
READ MORE
MEMBERS ONLY
These Charts Show Some Likely Up-Moves Ahead

by Milan Vaishnav,
Founder and Technical Analyst, EquityResearch.asia and ChartWizard.ae
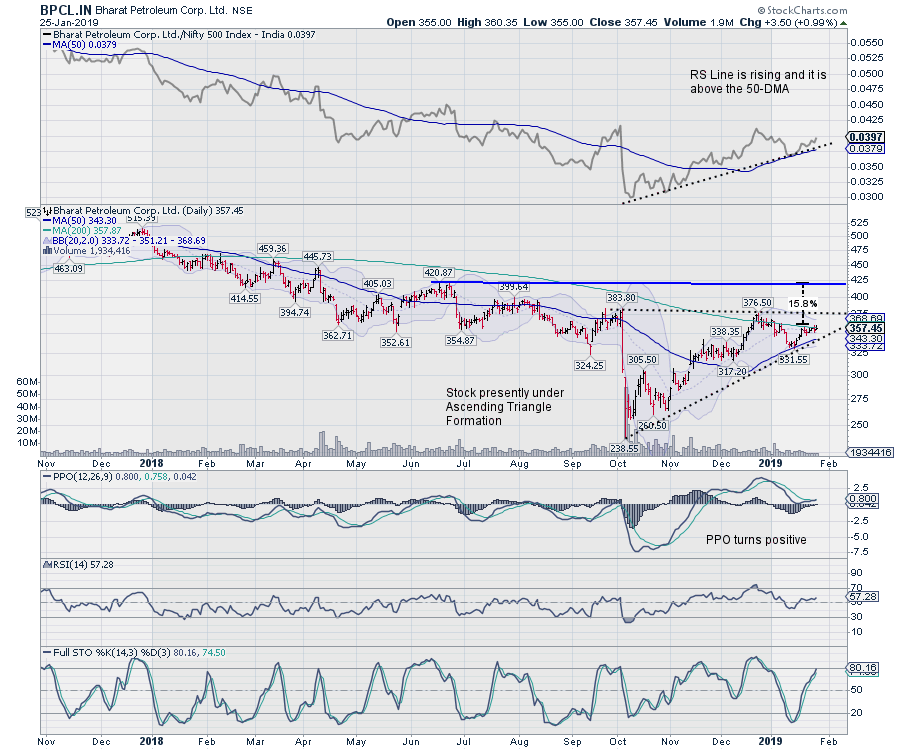
Bharat Petroleum Ltd. (BPCL.IN)
* Having formed a bottom at 238.55 following a steep fall from 383.80, the stock has since formed gradual higher bottoms. Presently it remains in an Ascending Triangle pattern, which is a bullish formation.
* The RS Line, when compared against broader CNX500 is rising;...
READ MORE
MEMBERS ONLY
Week Ahead: With F&O Expiry and Interim Budget In The Tow, Markets Set To Remain Volatile
by Milan Vaishnav,
Founder and Technical Analyst, EquityResearch.asia and ChartWizard.ae
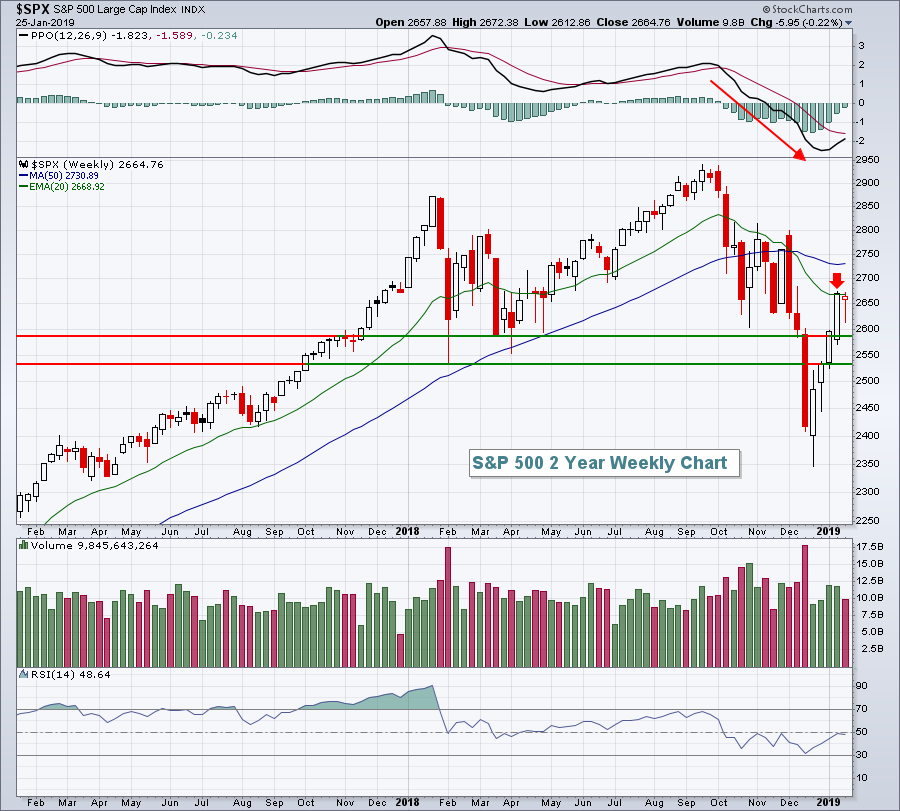
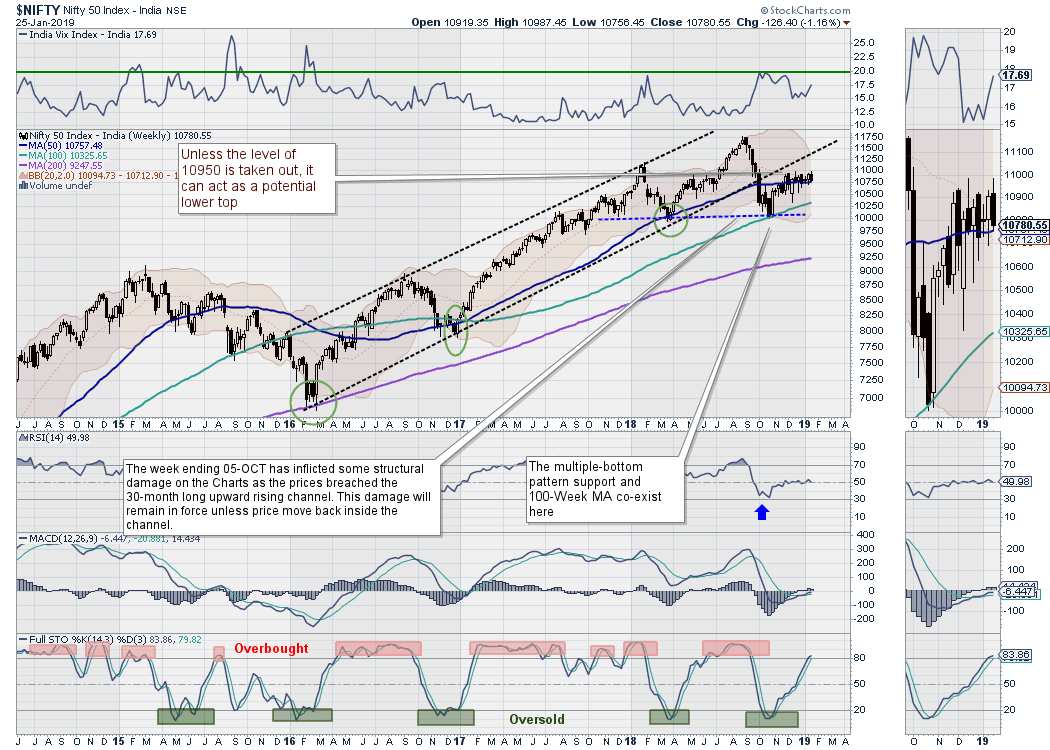
In spite of all expectations, NIFTY remained volatile and did not make any directional call over the previous week, oscillating in a defined 230-point range throughout. However, on the weekly charts, the NIFTY has been able to keep its head above the 50-Week MA, which is 10757. Additionally, the market...
READ MORE
MEMBERS ONLY
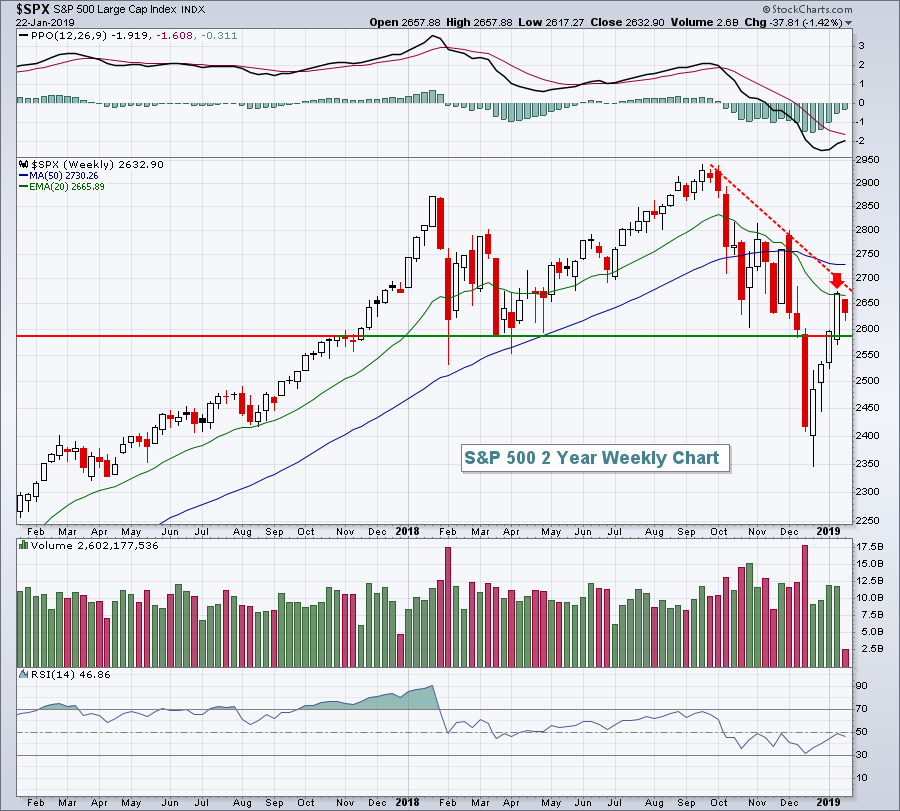
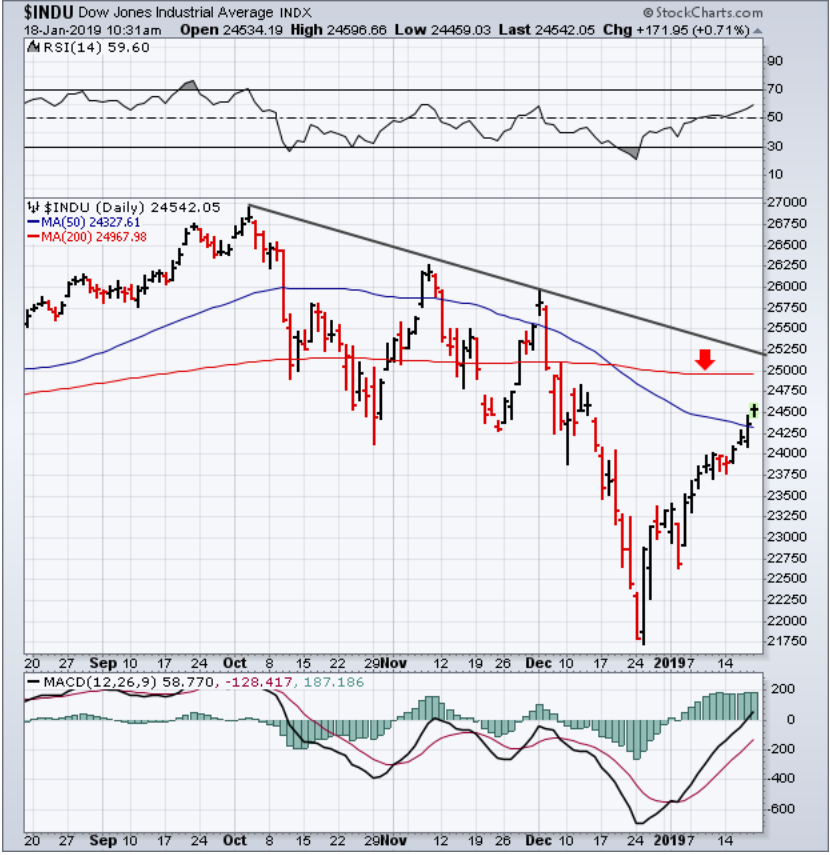
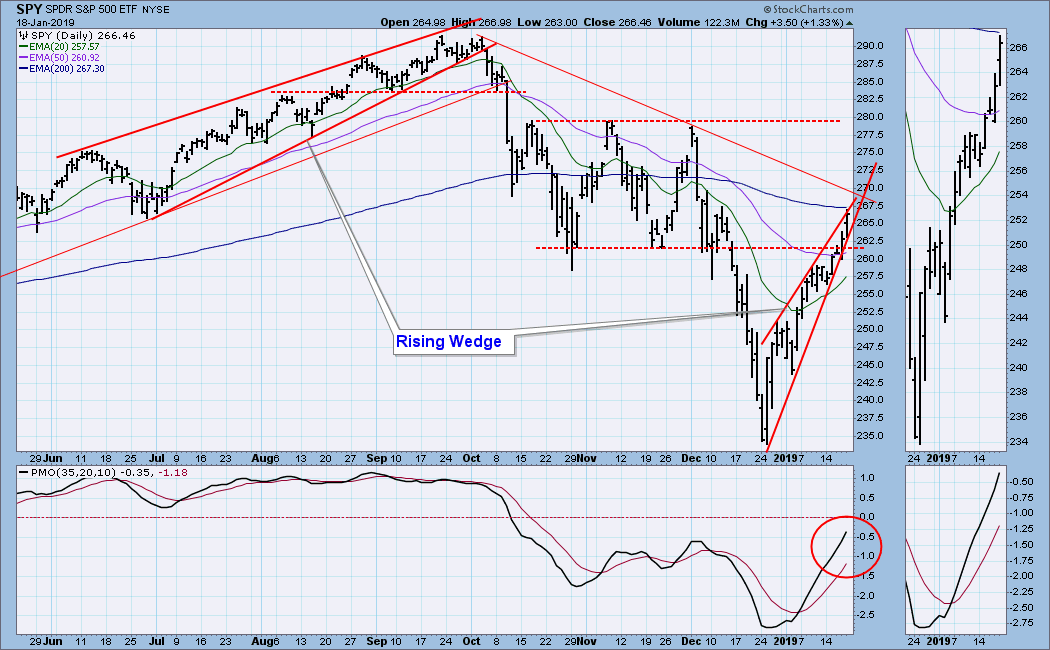
DP Weekly Wrap: Rising Wedge Breakdown Sets Less Accelerated Rising Trend Line

by Carl Swenlin,
President and Founder, DecisionPoint.com
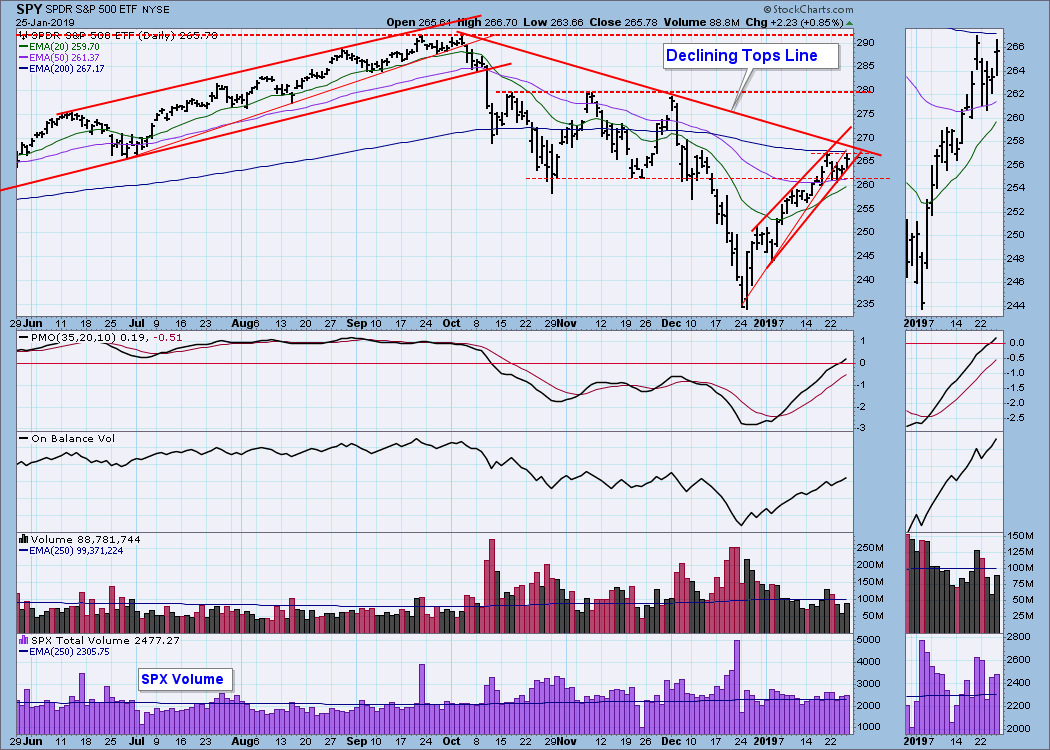
Last week we were focused on the SPY rising wedge formation, the technical expectation for which was that it would break down. Well, on Tuesday it did break down, but there was no follow through afterwards. Instead, it moved sideways for two days, then rallied on Friday, challenging Monday'...
READ MORE
MEMBERS ONLY

Weekly Market Review & Outlook - A Race to the 200-day
by Arthur Hill,
Chief Technical Strategist, TrendInvestorPro.com
* Big Move within Bigger Downtrend.
* The Bullish Turn of the Month.
* S&P 500 Could Challenge 200-day.
* Junk Bonds Surge to Breakdown Zone.
* Key Supports for Big Six Sectors.
* Bull Flags in ITB and XHB.
* Bonds Turning Up ahead of Fed.
* International ETFs Outperforming S&P.
... Big Move...
READ MORE
MEMBERS ONLY

STOCK ADVANCE CONTINUES AS 50-DAY AVERAGES HOLD -- 200-DAY AVERAGES ARE NOW IN SIGHT -- EMERGING MARKETS ISHARES REACH SEVEN-MONTH HIGH AND ARE CHALLENGING 200-DAY AVERAGE -- CONSUMER DISCRETIONARY SPDR IS ALSO CHALLENGING ITS 200-DAY LINE

by John Murphy,
Chief Technical Analyst, StockCharts.com
MAJOR U.S. STOCK INDEXES HEAD TOWARD 200-DAY AVERAGES ... My Wednesday message expressed concern that several stock indexes were in danger of falling back below their 50-day averages, which would have put their January rebound in jeopardy. As today's first three charts show, however, the blue 50-day lines...
READ MORE
MEMBERS ONLY
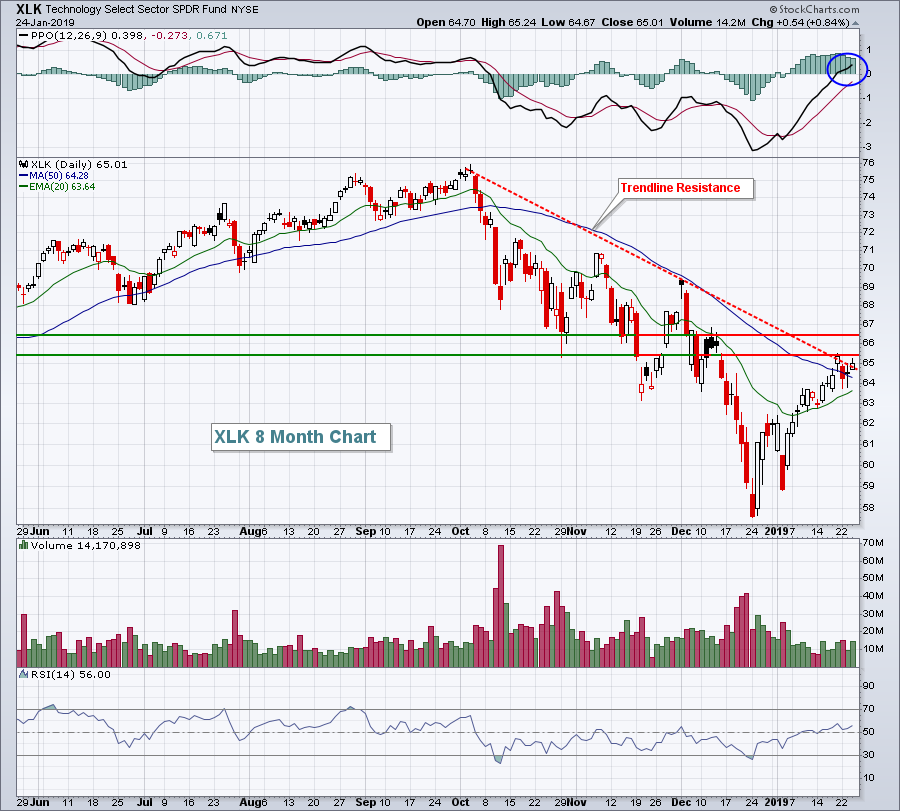
Technology Leads Stocks Higher, But Faces Trendline Resistance Test
by Tom Bowley,
Chief Market Strategist, EarningsBeats.com
Market Recap for Thursday, January 24, 2019
Semiconductor stocks ($DJUSSC, +5.10%) soared after a few key earnings reports in the group came in better than expected. Xilinx (XLNX, +18.44%) and Lam Research (LRCX, +15.70%) were two of the best performers, but their results lifted much of the...
READ MORE
MEMBERS ONLY
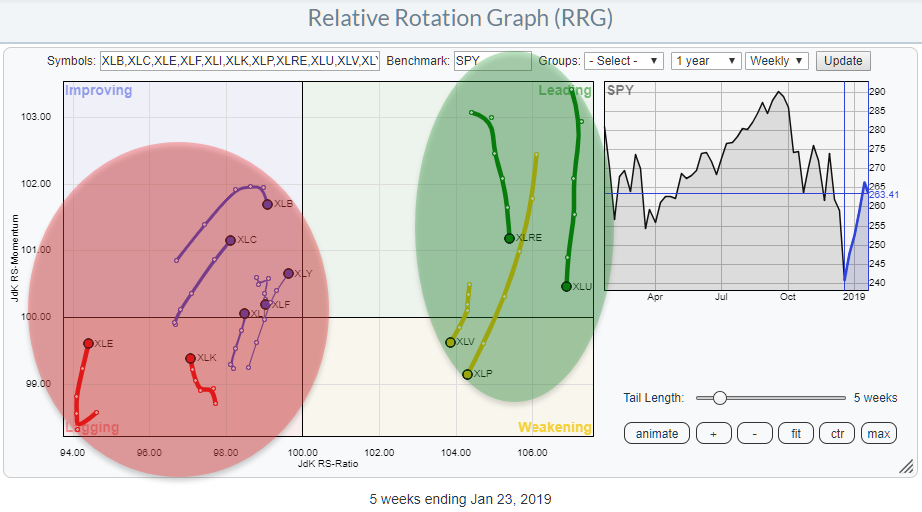
Defensive Sectors Starting Positive Rotations Again On Daily Relative Rotation Graphs

by Julius de Kempenaer,
Senior Technical Analyst, StockCharts.com
The Relative Rotation Graph for US sectors is showing a split picture. On the right, we have Utilities, Real-Estate, Consumer Staples and Healthcare. With the exception of Real-Estate maybe, these are generally accepted as "defensive" sectors.
All other sectors (7) are positioned to the left of the benchmark...
READ MORE
MEMBERS ONLY

XILINX LEADS SEMICONDUCTOR ISHARES TO THE HIGHEST LEVEL IN NEARLY TWO MONTHS -- LAM RESEARCH IS ALSO HAVING A VERY STRONG DAY -- INTEL CLEARS 200-DAY AVERAGE TO LEAD DOW HIGHER
by John Murphy,
Chief Technical Analyst, StockCharts.com
SEMICONDUCTOR ISHARES TURN UP... My message from yesterday showed semiconductor stocks under selling pressure. In today's trading, however, semis are having a very strong day and are the day's strongest stock group. Chart 1 shows the PHLX Semiconductor iShares (SOXX) jumping 5% to reach the highest...
READ MORE
MEMBERS ONLY
Volatile Session Ends Mostly In Bullish Fashion
by Tom Bowley,
Chief Market Strategist, EarningsBeats.com
Note
I'm traveling today so my article will be abbreviated.
Market Recap for Wednesday, January 23, 2019
It was a fairly volatile session on Wednesday as U.S. indices opened higher, but quickly fell fairly deep into negative territory before rallying in the afternoon. Only the small cap...
READ MORE
MEMBERS ONLY
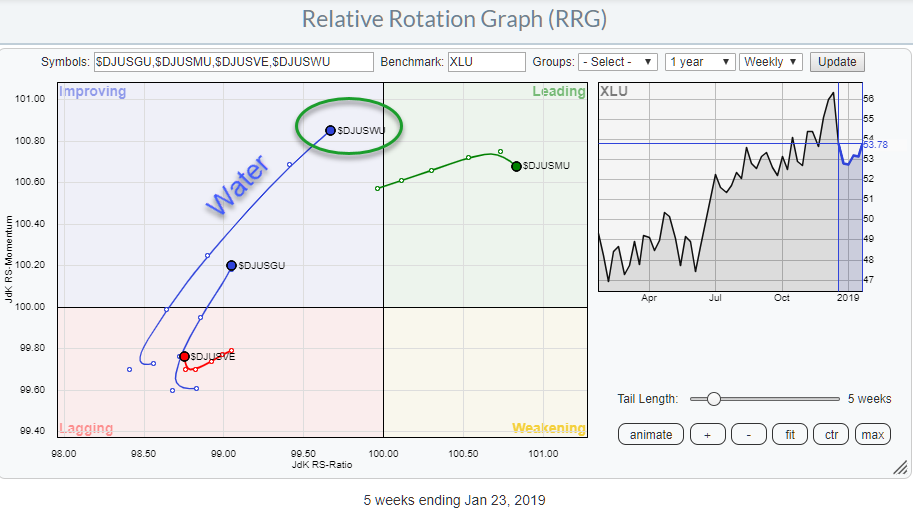
Water ($DJUSWU) Is The Leading Group Inside The Utilities Sector (XLU)
by Julius de Kempenaer,
Senior Technical Analyst, StockCharts.com
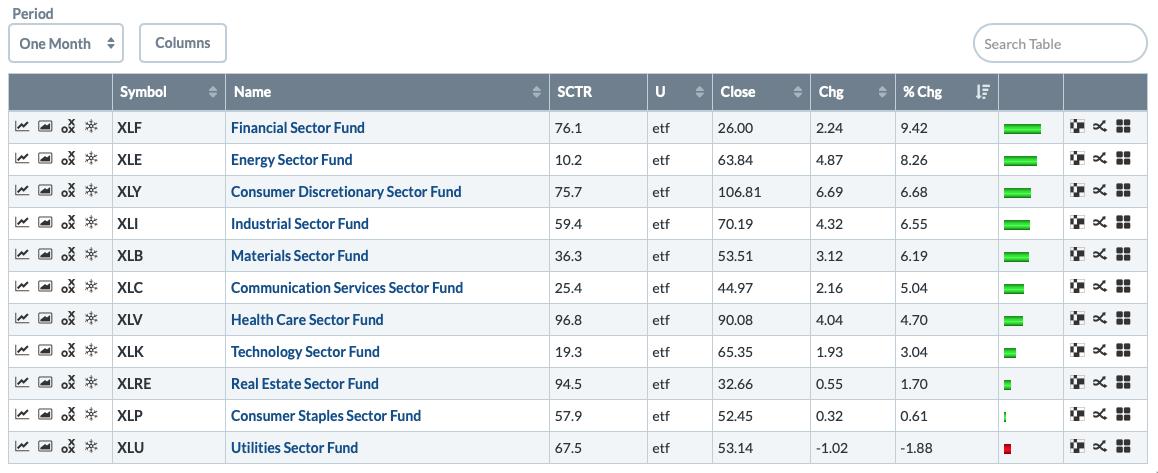
One of the pages that I often visit on Stockcharts.com is the sector summary. It gives a tabular overview of the price changes that occurred over a certain period (you can choose).
From that page, it is possible to open a Relative Rotation Graph that breaks the sector down...
READ MORE
MEMBERS ONLY

DP Alert: Selling Initiation Signals - Dollar (UUP) New PMO BUY Signal
by Erin Swenlin,
Vice President, DecisionPoint.com
The DecisionPoint Scoreboards are all bullish in the short term. The bearish rising wedge executed yesterday and the indicators are supporting a decline in the shorter term.
The DecisionPoint Alert presents a mid-week assessment of the trend and condition of the stock market (S&P 500), the U.S....
READ MORE
MEMBERS ONLY

Reversal Signs Appearing in SPY and TLT - XLC is Leading Lower
by Arthur Hill,
Chief Technical Strategist, TrendInvestorPro.com
* SPY Forges a Gap-Gap Reversal
* What Makes this Wedge Break Significant?
* TLT Turns up from Oversold Levels.
* XLC is the First to Break.
... The mood of the market appears to be changing as stocks weaken and bonds strengthen. It looks like short-term trends are trying to reverse. The first chart...
READ MORE
MEMBERS ONLY

SEVERAL STOCK INDEXES ARE TRYING TO STAY ABOVE MOVING AVERAGE LINES -- CYCLICALS AND BIOTECHS ARE STRUGGLING WITH 200-DAY LINES -- SO ARE EMERGING MARKET ISHARES
by John Murphy,
Chief Technical Analyst, StockCharts.com
A LOT OF MOVING AVERAGES ARE BEING TESTED... Recent messages have focused on major U.S stock indexes reaching overhead resistance barriers which could slow their January advance; or maybe even end it. All of those major stock indexes remain below their 200-day averages; while their 50-day lines remain below...
READ MORE
MEMBERS ONLY
Bearish Island Reversal Forms With Tuesday's Selling
by Tom Bowley,
Chief Market Strategist, EarningsBeats.com
Market Recap for Tuesday, January 22, 2019
Energy (XLE, -2.18%), communication services (XLC, -2.07%) and industrials (XLI, -2.07%) all fell more than 2% on Tuesday as Wall Street had its first significant retreat since the day that Apple (AAPL) warned. Late day buying cut into losses as...
READ MORE
MEMBERS ONLY
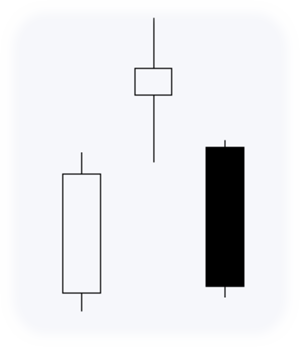
A Rare Evening Star Forms in QQQ
by Arthur Hill,
Chief Technical Strategist, TrendInvestorPro.com
Despite a 15% surge the prior 17 days, the Nasdaq 100 ETF (QQQ) remains below its flattening 200-day SMA and the ETF formed a rare evening star candlestick pattern over the last three days.
First and foremost, I think the long-term trend is down for QQQ. The ETF recorded a...
READ MORE
MEMBERS ONLY

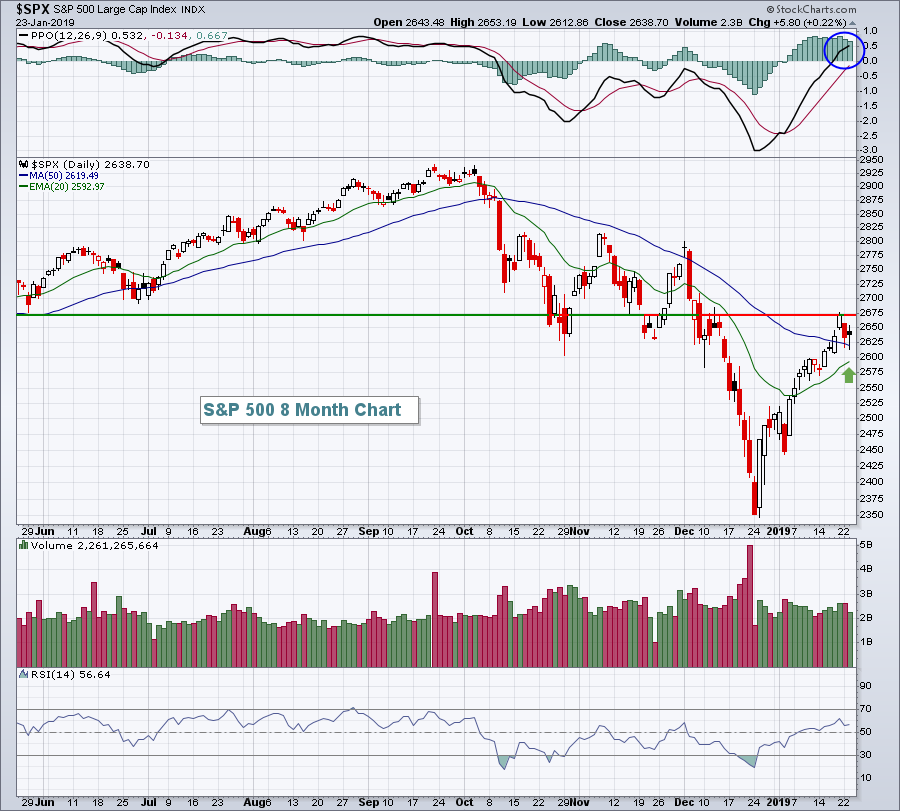
GLOBAL STOCKS DROP SHARPLY -- OVERBOUGHT S&P 500 BACKS OFF FROM TRENDLINE RESISTANCE -- WHILE AN OVERSOLD VIX INDEX BOUNCES OFF CHART SUPPORT -- TRADE AND ECONOMICALLY SENSITIVE STOCKS LEAD THE SELLING -- BIG DROP IN BOND YIELD BOOSTS BOND PRICES
by John Murphy,
Chief Technical Analyst, StockCharts.com
GLOBAL STOCKS SELL OFF WHILE BONDS RALLY... Stocks all over the world turned lower today. And they're doing it at a bad time. That's because the recent rebound has taken major U.S. stock indexes up to some formidable overhead resistance barriers. And they may be...
READ MORE
MEMBERS ONLY

AAPL Campaign Completed

by Bruce Fraser,
Industry-leading "Wyckoffian"
Because the Wyckoff Methodology identifies elements of structure and context within price (Accumulation and Distribution schematics and Phase Analysis), it naturally strengthens the attribute of patience in its user. There is a time to watch, a time to act, and a time to sit in a trending trade. Horizontal Point...
READ MORE
MEMBERS ONLY
Where's That Test Of The December Low?
by Martin Pring,
President, Pring Research
* Long-Term Trend Still Points South
* It Would be Unusual Not to Experience a Test of the December Low
* Dollar ETF Breaking Out?
Last week, I pointed out that the major averages were running into resistance at a moment when they were moderately overbought. At the time, some form of a...
READ MORE
MEMBERS ONLY
Transportation Stocks Hold A Big Clue This Week
by Tom Bowley,
Chief Market Strategist, EarningsBeats.com
Market Recap for Friday, January 18, 2019
Continuing anticipation of a trade deal with China appeared to fuel very solid stock market action on Friday as all of our major indices pushed higher, as did all 11 sectors. The Dow Jones and S&P 500 led the charge, gaining...
READ MORE
MEMBERS ONLY

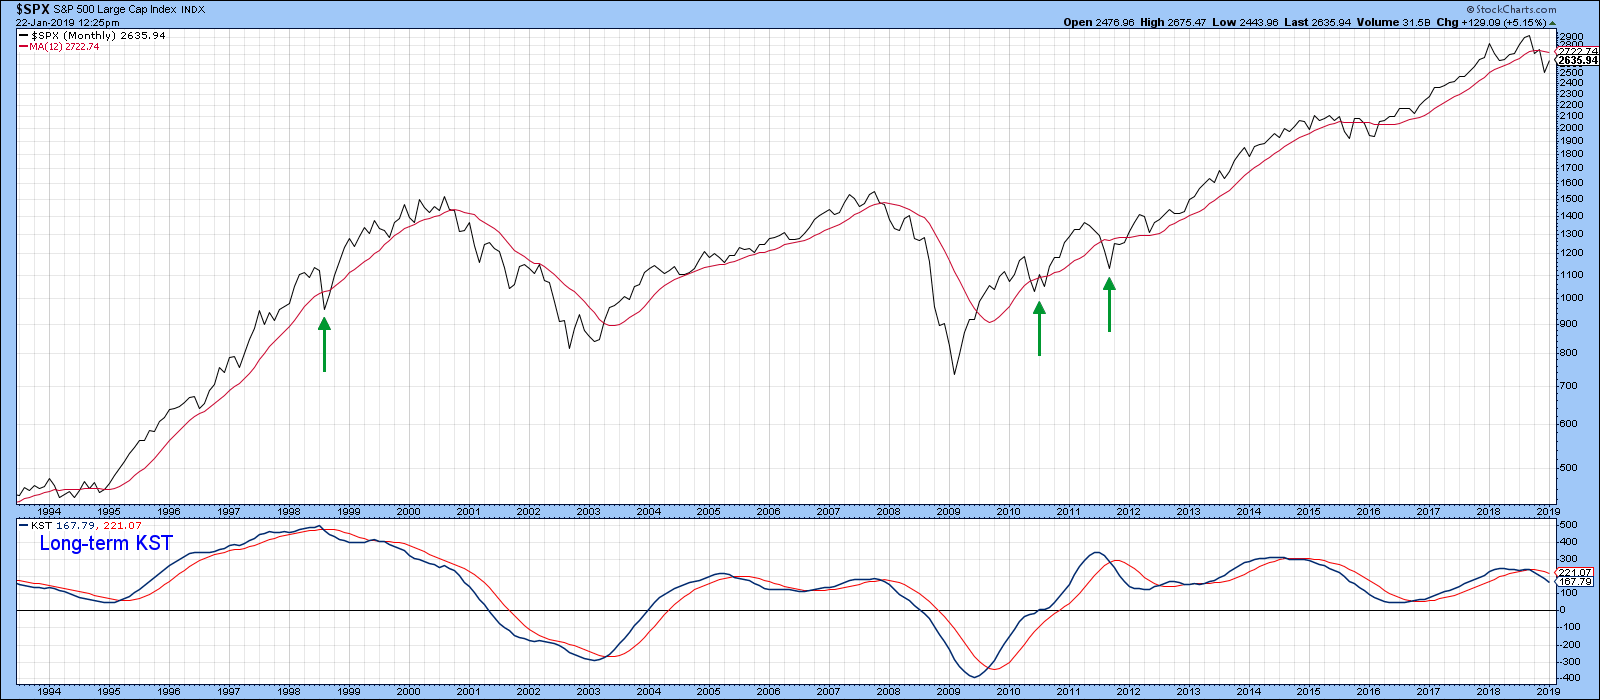
To Chase or Not to Chase?
by Arthur Hill,
Chief Technical Strategist, TrendInvestorPro.com
* Volume is not What is Used to Be.
* 2008: Bear Bounce and Bullish Setup.
* 2010: Big Bounce and Big Pullback.
* 2011: Retracement and Bull Flag.
* 2014: October Volatility.
* 2015: Volatility and BREXIT Vote.
* 2019: What Now?
* On Trend on StockChartsTV.
... Volume is not What is Used to Be
... I went...
READ MORE
MEMBERS ONLY
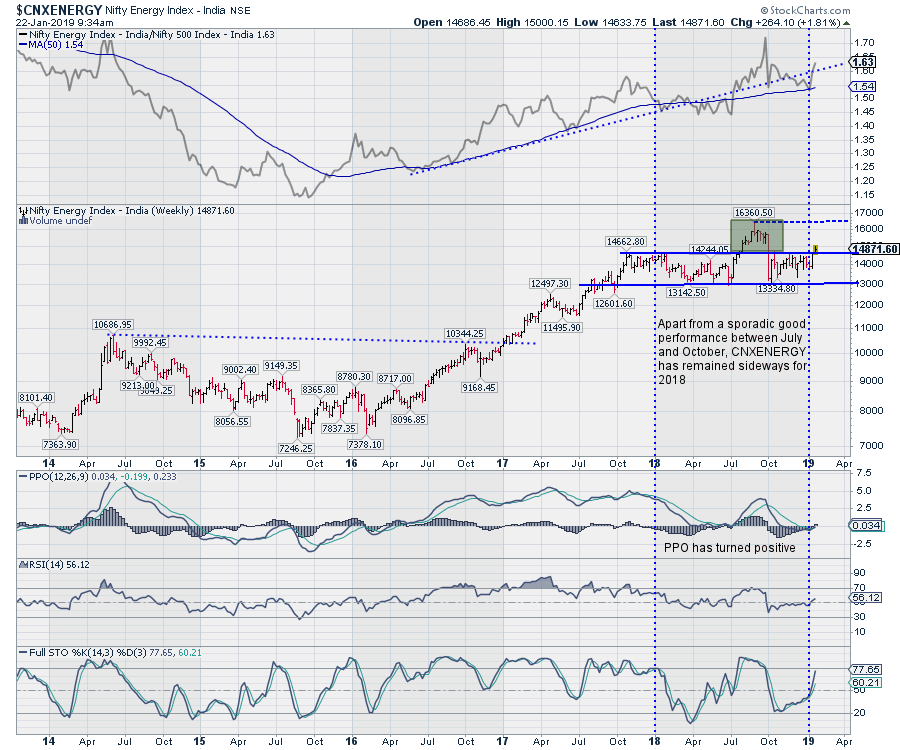
NIFTY Energy Sector Looks Up
by Milan Vaishnav,
Founder and Technical Analyst, EquityResearch.asia and ChartWizard.ae
As the Indian equity markets remain under under an area formation, a clear breakout will continue to elude the NIFTY unless it can move past the 10950 level. With the markets still trapped in a range, the NIFTY Energy Index ($CNXNIFTY) provides some interesting observations.
The NIFTY Energy Index formed...
READ MORE
MEMBERS ONLY
3 Stocks Awaiting A Possible Earnings Explosion
by Tom Bowley,
Chief Market Strategist, EarningsBeats.com
Analysts meet with the management teams of companies and then return to their firms and either buy or sell based on the information they gather. It's the primary reason why technical price action precedes fundamental information. If you understand the dynamics on Wall Street, you're in...
READ MORE
MEMBERS ONLY
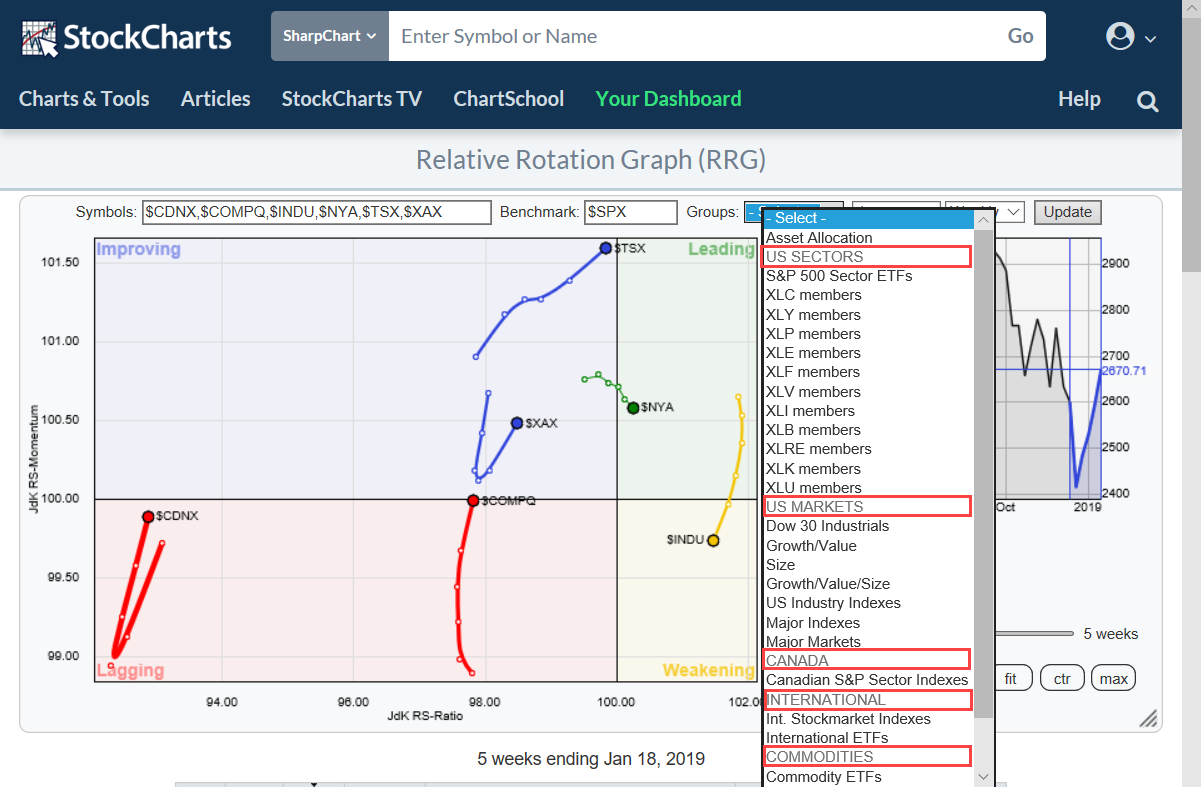
New Pre-Defined Groups And A Look At FAANG Stocks On Relative Rotation Graphs
by Julius de Kempenaer,
Senior Technical Analyst, StockCharts.com
If you are a regular user of Relative Rotation Graphs you are probably aware of the pre-defined groups (universes) that you can choose from when you open the drop-down box at the top op the chart.
In order to make life easier (for our users) and provide structure, I am...
READ MORE
MEMBERS ONLY
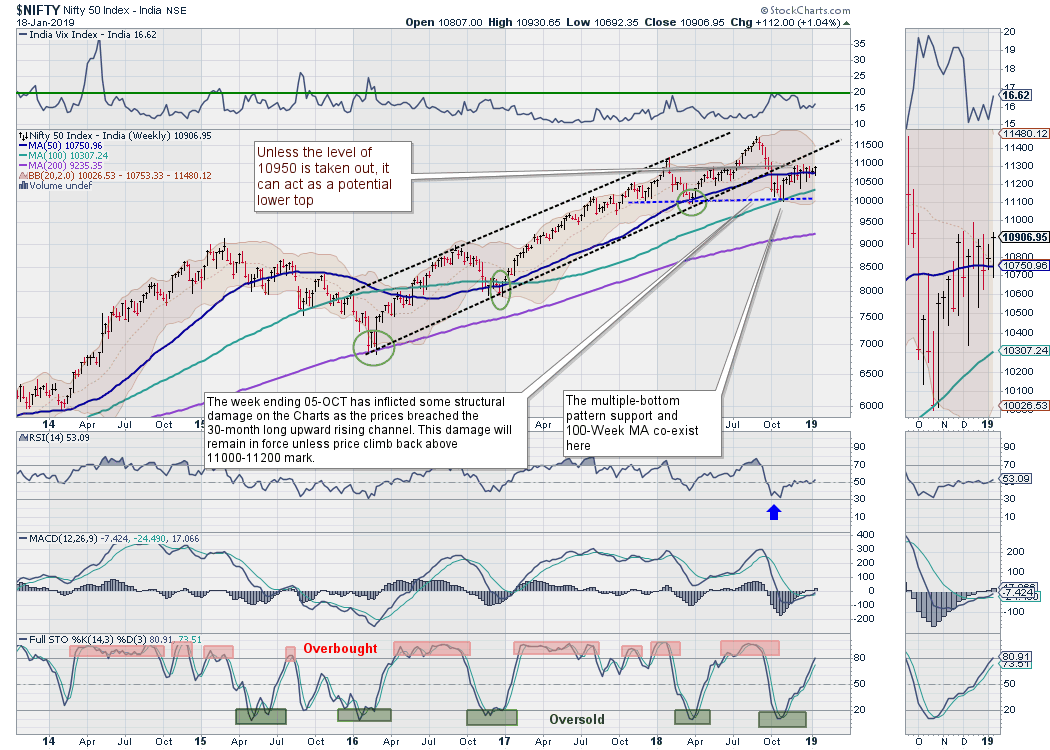
Week Ahead: NIFTY Looks At Taking A Decisive Directional Call In The Coming Week
by Milan Vaishnav,
Founder and Technical Analyst, EquityResearch.asia and ChartWizard.ae
The past week saw the market remaining range-bound, oscillating inside a 250-point range and ultimately ending with a modest gain. Though the market did not take any directional call on either side, it saw significant amount of volatility within the defined range. While holding on to the 50-Week MA level,...
READ MORE
MEMBERS ONLY

Separating the Contenders from the Pretenders
by Arthur Hill,
Chief Technical Strategist, TrendInvestorPro.com
The S&P 500 is in the midst of a big run that lifted most boats, especially financial stocks. Even though these stocks are leading with the biggest gains over the last three weeks, most big financials are still in downtrends overall and below their 200-day SMAs.
Take Citigroup...
READ MORE
MEMBERS ONLY
January Stock Rebound Continues
by John Murphy,
Chief Technical Analyst, StockCharts.com
Editor's Note: This article was originally published in John Murphy's Market Message on Friday, January 18th at 11:01am ET.
All major U.S. stock indexes have exceeded their 50-day averages (blue lines). That still leaves their 200-day averages to contain the rally. But there are...
READ MORE
MEMBERS ONLY
DP Weekly Wrap: Trade News Dominates; Technicals Lurk
by Carl Swenlin,
President and Founder, DecisionPoint.com
Just last week I wrote: There are two impending fundamental events to which the market is likely to react positively: (1) resolution of the trade issues with China; and (2) ending the government shutdown. Assuming that either event actually comes to pass, positive short-term reaction can be expected from either...
READ MORE
MEMBERS ONLY
Earnings Season Kicks into High Gear - Be Prepared to Profit

by John Hopkins,
President and Co-founder, EarningsBeats.com
Earnings season began in earnest last week, with major financial companies being rewarded and helping to lead the market higher. It's one of four time periods during the year when publicly traded companies share their earnings results so that investors can get a sense of the financial health...
READ MORE
MEMBERS ONLY
Utilities Sector (XLU) Lights Up a New PMO BUY Signal
by Erin Swenlin,
Vice President, DecisionPoint.com
Sector rotation continues to favor the defensive sectors of Health Care, Consumer Staples, Real Estate and Utilities. Some of the more aggressive sectors are perking up now, with Financials actually making the biggest gain of the past month. Utilities in that same timeframe haven't done so much, but,...
READ MORE
MEMBERS ONLY

Weekly Market Review & Outlook (with video) - A One Legged Chair
by Arthur Hill,
Chief Technical Strategist, TrendInvestorPro.com
* Finance Does the Heavy Lifting.
* One out of Four is Not Enough.
* New Highs Remain Subdued.
* Majority of Stocks in Long-term Downtrends.
* The Lone Breadth Thrust.
* Bear Market Environments.
* Strength Outside of U.S. Stocks.
* Separating the Contenders from the Pretenders.
* Growth Stocks with Strong Charts.
... Finance Does the Heavy...
READ MORE
MEMBERS ONLY

JANUARY STOCK REBOUND CONTINUES -- STOCK INDEXES HAVE CLEARED THEIR 50-DAY MOVING AVERAGES -- OVERHEAD RESISTANCE LINES STILL HAVE TO BE TESTED -- INCLUDING THEIR 200-DAY AVERAGES
by John Murphy,
Chief Technical Analyst, StockCharts.com
MAJOR U.S. STOCK INDEXES NEAR TEST OF OVERHEAD RESISTANCE ... All major U.S. stock indexes have exceeded their 50-day averages (blue lines). That still leaves their 200-day averages to contain the rally. But there are a couple of other resistance lines that still need to be tested. Chart 1...
READ MORE
MEMBERS ONLY
The Ultimate Test For The Bears Is Here
by Tom Bowley,
Chief Market Strategist, EarningsBeats.com
Market Recap for Thursday, January 17, 2019
Word that the U.S. would ease Chinese tariffs as negotiations wear on helped to reduce stock market stress and resulted in an intraday surge in U.S. equity prices on Thursday afternoon. Quick profit taking followed, but strength resumed into the close...
READ MORE
MEMBERS ONLY
SPY Arrived In "Trouble Territory"
by Julius de Kempenaer,
Senior Technical Analyst, StockCharts.com
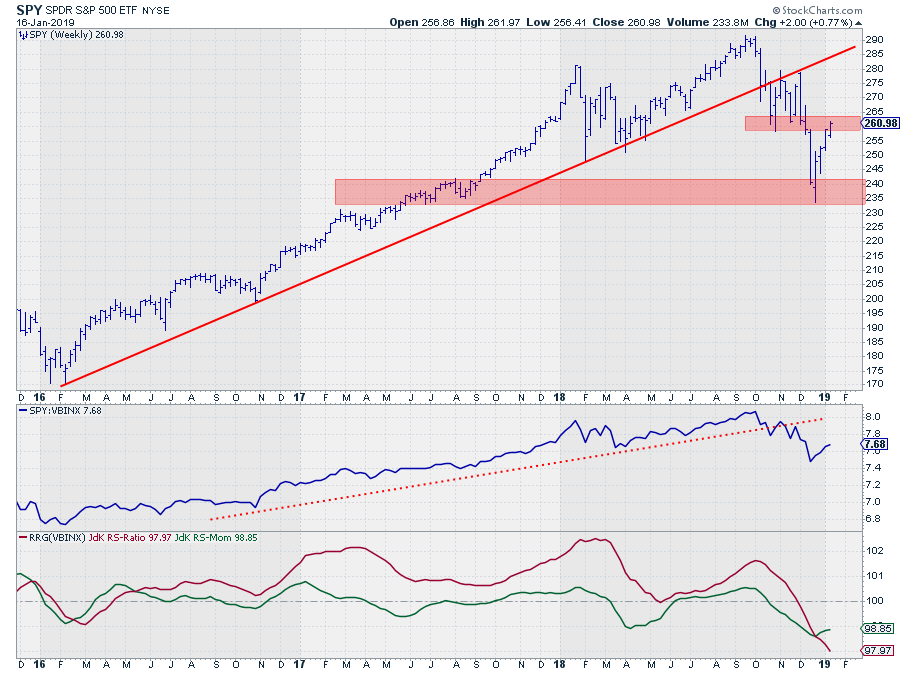
After the sharp sell-off in Q4 of last year, the market (SPY) started to recover from its lows near 235. And IMHO it is still a "recovery" before turning down again as opposed to a "turnaround" back up.
This weekly chart above clearly shows that the...
READ MORE