MEMBERS ONLY
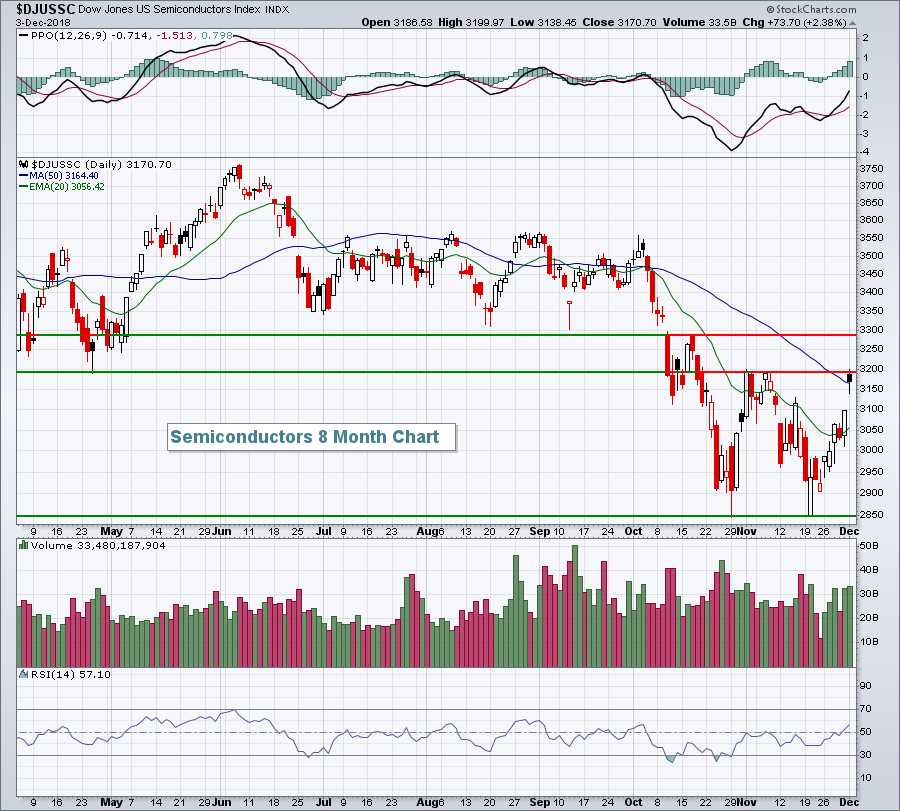
Bearish Patterns Taking Shape in EW Sectors and Semiconductor ETFs/Stocks

by Arthur Hill,
Chief Technical Strategist, TrendInvestorPro.com
* Bearish Patterns in Big EW Sectors.
* Internal Weakness Hits Consumer Staples.
* Semiconductor ETFs Bounce after Breakdowns.
* Intel Fails at 200-day as Broadcom Breaks Out.
* Four more Wedge Breaks.
* On Trend on Youtube.
... Bearish Patterns in Big EW Sectors
... While the sector SPDRs capture what is happening with large-cap stocks, the...
READ MORE
MEMBERS ONLY
Early Gains Wiped Out As U.S. Equities Finish In Bifurcated Fashion

by Tom Bowley,
Chief Market Strategist, EarningsBeats.com
Market Recap for Tuesday, December 11, 2018
Volatile action on Tuesday resulted in a bifurcated market. The NASDAQ managed to cling to gains at the close, while the Dow Jones, S&P 500 and Russell 2000 saw early morning gains turn into losses by the close. Leadership came mostly...
READ MORE
MEMBERS ONLY
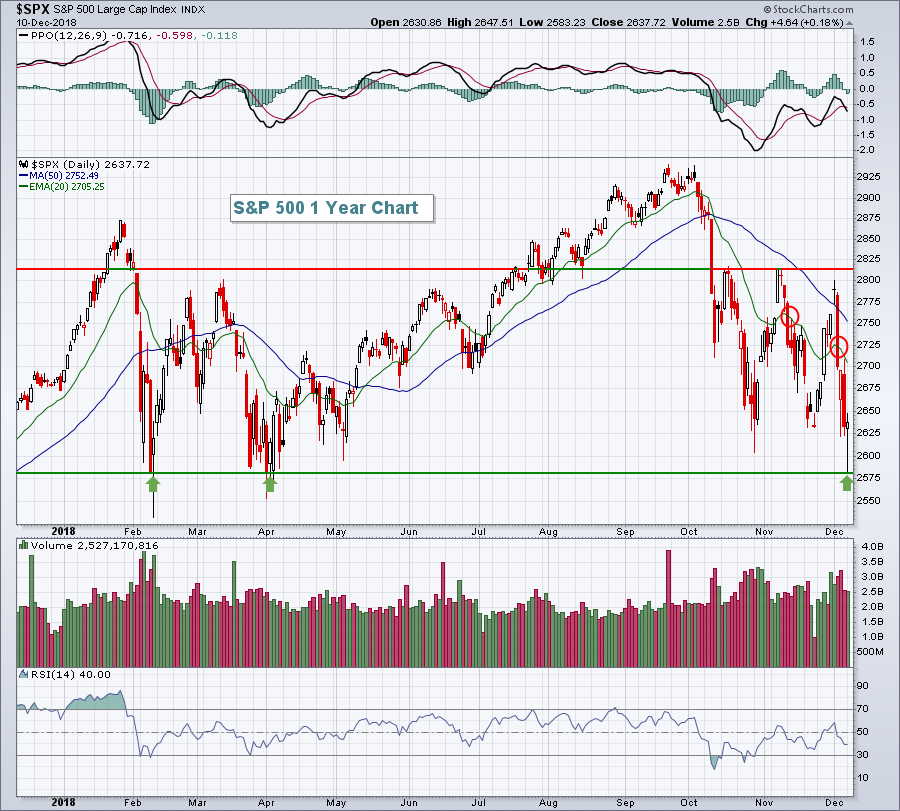
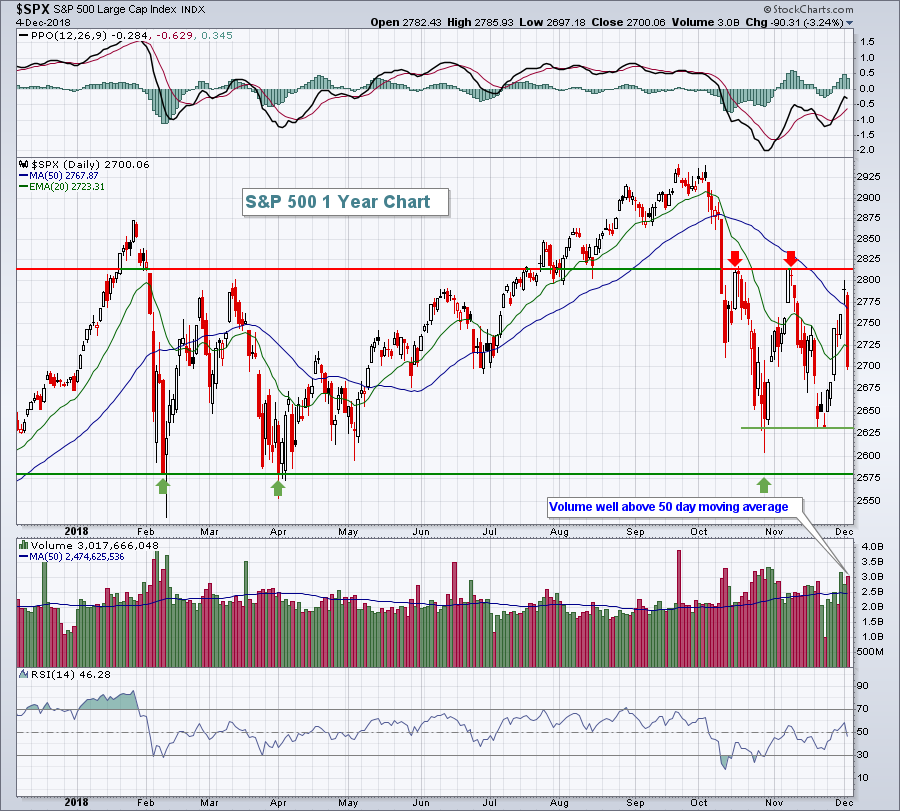
S&P 500 Touches MAJOR Price Support; One Ingredient Missing For Bear Market
by Tom Bowley,
Chief Market Strategist, EarningsBeats.com
Market Recap for Monday, December 10, 2018
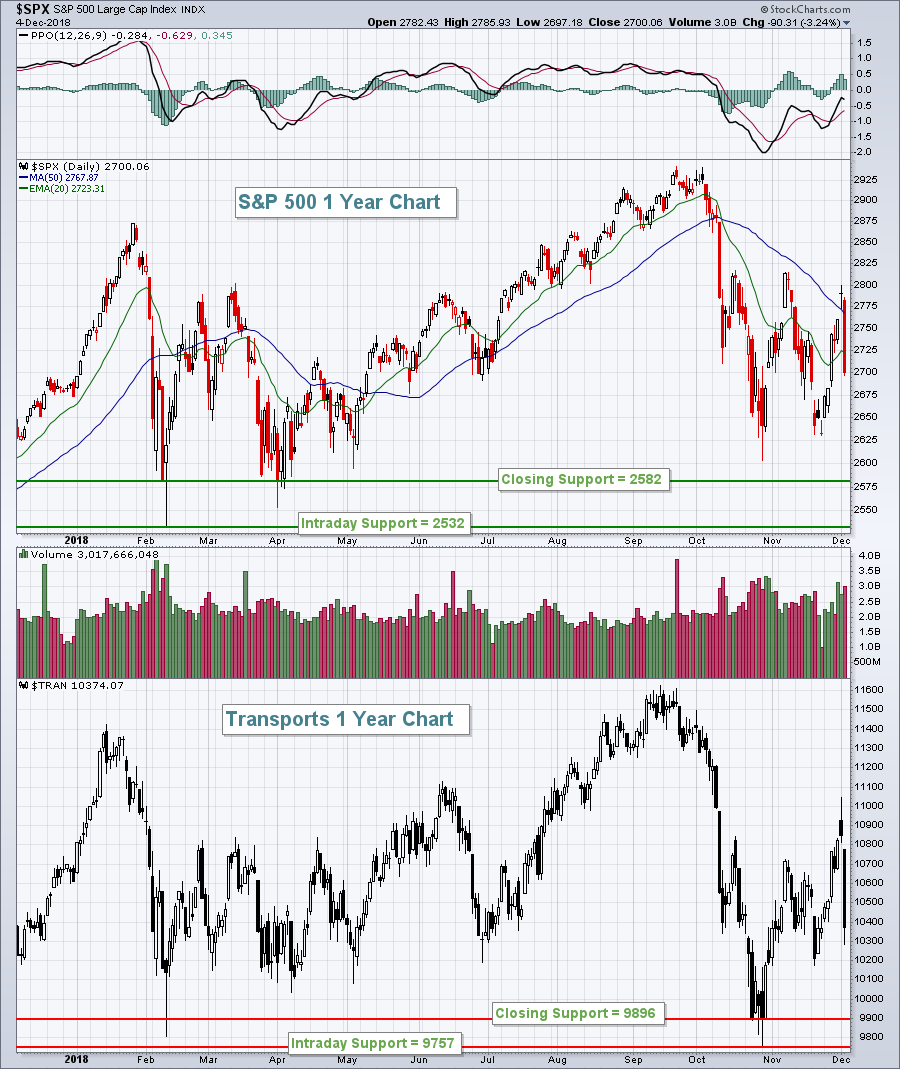
Yesterday was significant for one very important technical development. The February 2018 low close of 2582 was within a whisker on Monday as the S&P 500 hit an intraday low of 2583 before rallying strongly. Technology (XLK, +1.38%) led the...
READ MORE
MEMBERS ONLY

Yield Curve Inversion?

by Bruce Fraser,
Industry-leading "Wyckoffian"
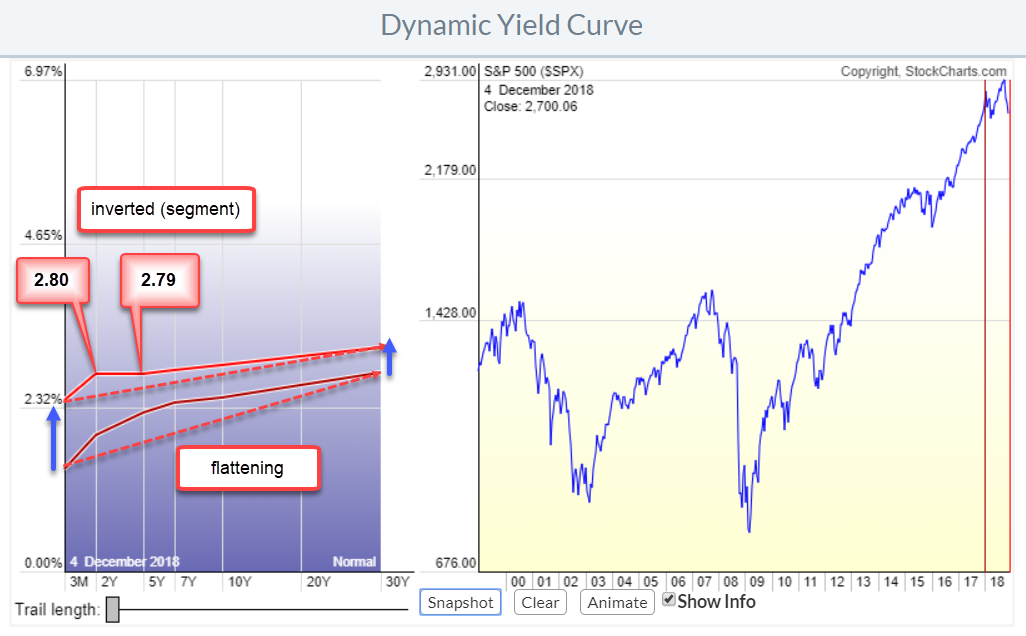
The recent weakness in the stock market was partially attributed to the flattening of the ‘Yield Curve’. When bond yields (typically U.S. Treasuries) are plotted in order of their time to maturity, a Yield Curve is the result. Typically, the shortest maturity instruments (T-Bills) have the lowest yield and...
READ MORE
MEMBERS ONLY
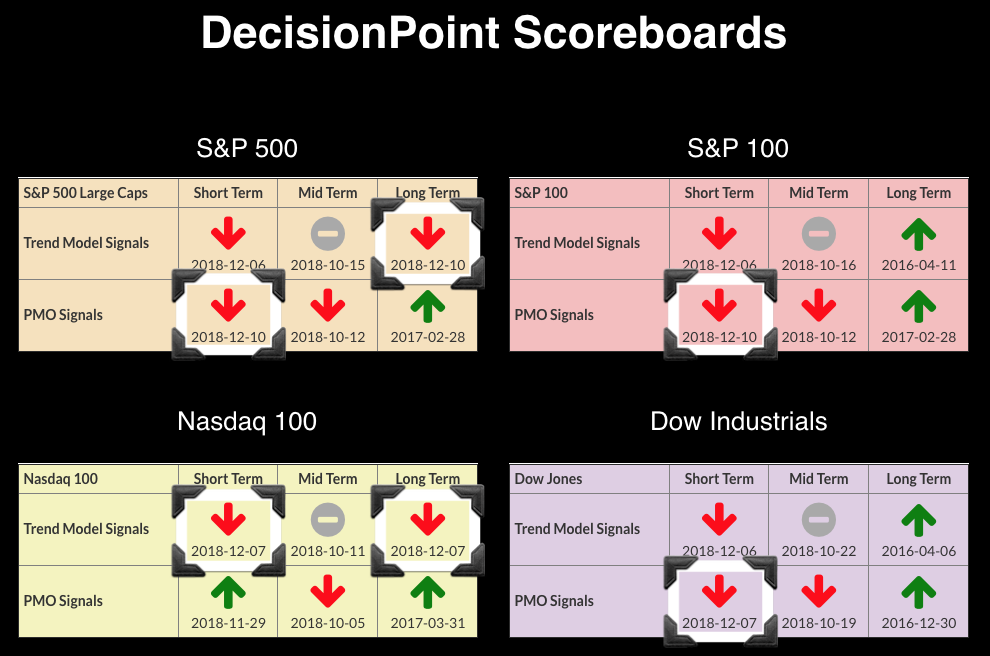
Two EMA "Death Crosses" on NDX and SPX = LT Trend Model SELLs

by Erin Swenlin,
Vice President, DecisionPoint.com
I've always thought the moniker "death cross" was terribly dramatic (and I still do). However, this time around, it does seem ominous. The SPX lost its Long-Term Trend Model BUY signal, a signal that had been in place since early 2016. These signals don't...
READ MORE
MEMBERS ONLY
Year-End Rally Here We Come?

by Martin Pring,
President, Pring Research
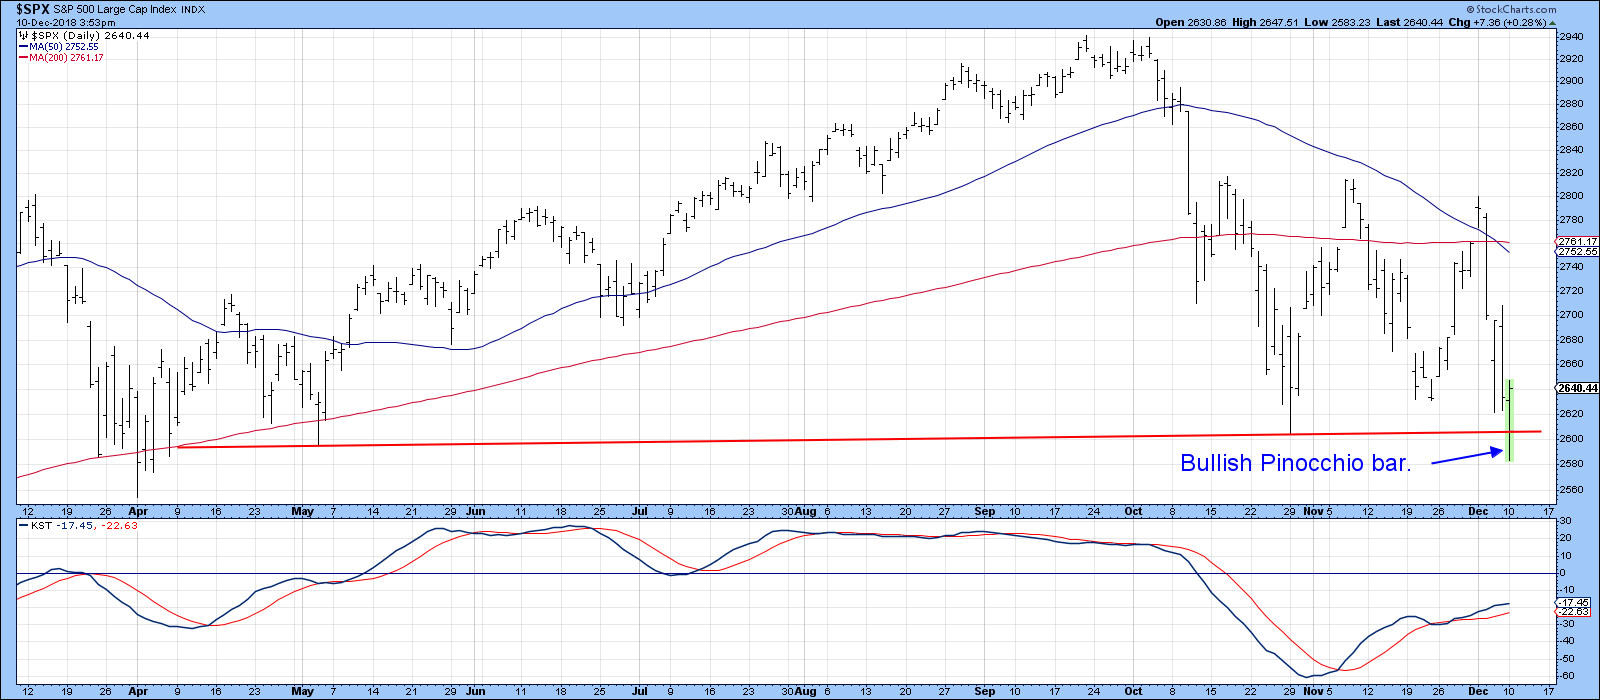
* Pinocchio Lies
* Oversold Sentiment Indicators
* Oversold Oscillators
Pinocchio Lies
Monday’s action was what I call “scary bullish.” First, we saw prices sell-off sharply, only to then rebound as if nothing had happened. Well, something did happen - the formation of a bullish Pinocchio bar on several Indexes. Chart 1...
READ MORE
MEMBERS ONLY

Interview with Japanese Trader: Takehiro Hikita - Part 2

by Greg Morris,
Veteran Technical Analyst, Investor, and Author
This is the final part of an interview with Takehiro Hikita; see the first part here.
Mr. Takehiro Hikita has graciously provided me with a large amount of insight into the candle pattern philosophy. I have never met anyone so devoted to the detailed study of a concept as he....
READ MORE
MEMBERS ONLY

Southwest Airlines Reverses with a Gap
by Arthur Hill,
Chief Technical Strategist, TrendInvestorPro.com
Southwest Airlines (LUV) is in a long-term downtrend and the recent failure near the death cross points to further downside.
First and foremost, the long-term trend is down because LUV hit a new 52-week low in late October and price is below the 200-day SMA. In addition, the 50-day SMA...
READ MORE
MEMBERS ONLY

SystemTrader - The Real Value of the Death Cross and Broad Market Signals
by Arthur Hill,
Chief Technical Strategist, TrendInvestorPro.com
* Setting the Stage.
* Defining the Death Cross.
* 9 of the Last 2 Bear Markets.
* Comparing Different Crossover Signals.
* SMAs versus EMAs.
* SPY with Dividends vs $SPX Without.
* The Moving Average Sweet Spot.
* Conclusions (Adjusting Exposure).
... Setting the Stage ...
The financial media is awash with reports on the "death cross&...
READ MORE
MEMBERS ONLY
Falling Transports Lead To Further Losses On Wall Street
by Tom Bowley,
Chief Market Strategist, EarningsBeats.com
Market Recap for Friday, December 7, 2018
Friday marked the end of a rough day and a rough week for U.S. equities. Strength was found in utilities (XLU, +0.37%), the only sector to end in positive territory to close out the week. Gold miners ($DJUSPM, +2.36%) and...
READ MORE
MEMBERS ONLY
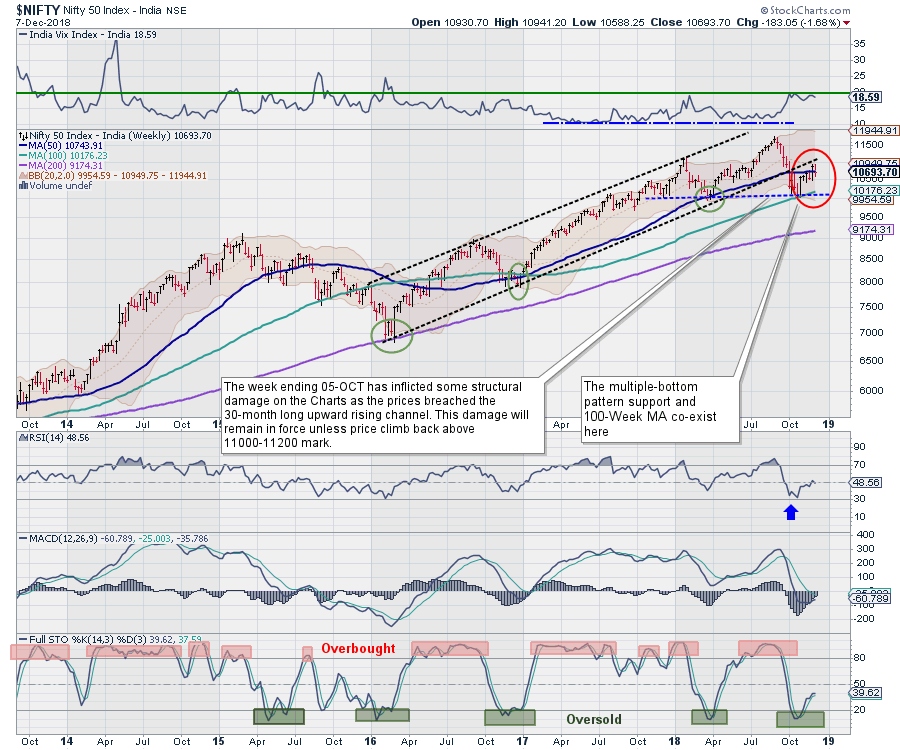
Coming week to remain volatile for NIFTY; dealing with volatility infused by results of State Elections important

by Milan Vaishnav,
Founder and Technical Analyst, EquityResearch.asia and ChartWizard.ae
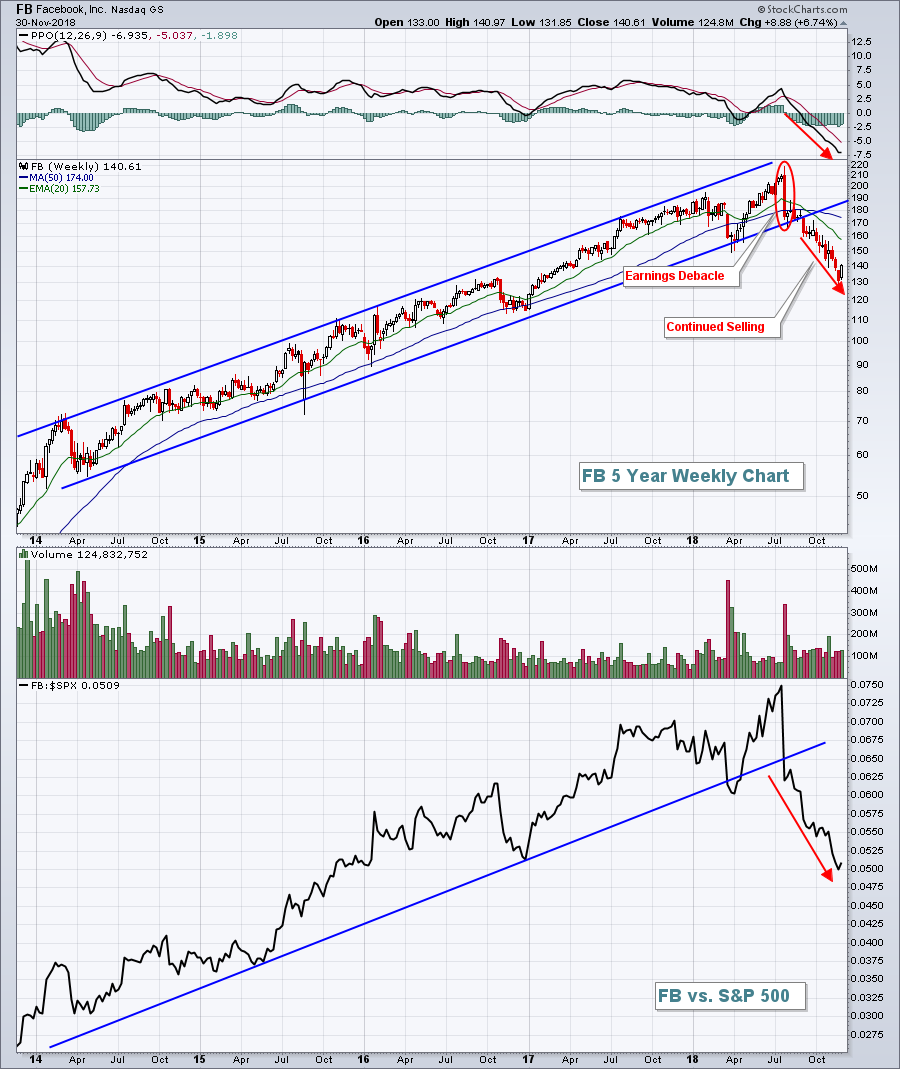
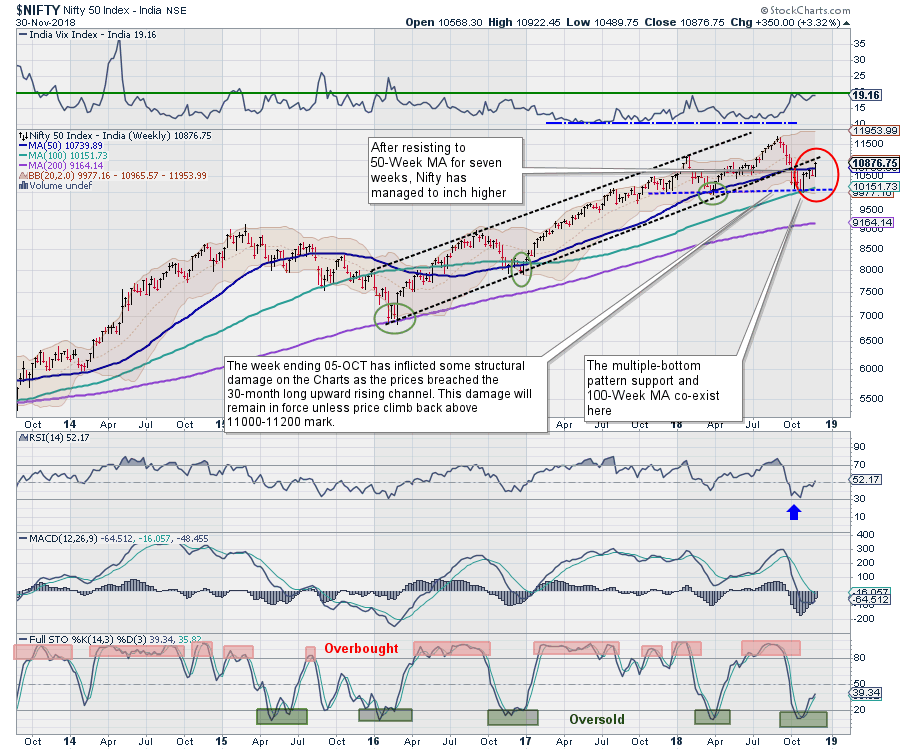
It wasn't smooth sailing for the equity markets as the previous week remained quite volatile, with the markets oscillating both ways to finally end the week in the red. The benchmark index NIFTY50 had moved past its 50-Week MA earlier, but it has failed to sustain that level....
READ MORE
MEMBERS ONLY
DP Weekly Wrap: Still In Trading Range Despite Fireworks

by Carl Swenlin,
President and Founder, DecisionPoint.com
There will probably be a lot of people mentioning that today there was a "Death Cross" on the S&P 500 chart, and this is important because a Death Cross means that the price index has entered a bear market. Specifically, on the $SPX chart (not shown)...
READ MORE
MEMBERS ONLY

Weekly Market Review & Outlook (with video) - Going Nowhere Fast
by Arthur Hill,
Chief Technical Strategist, TrendInvestorPro.com
* A Bull Market in Noise.
* New Lows Expand.
* Another Week and Another Big Swing..
* NDX Holds Up Better.
* Stocks Holding the 200-day.
* SKYY, HACK and IGV Trace Out Wedges.
* Healthcare Remains the Leader.
* REM, IHI and IHF Hold Up.
* Notes from the Art's Charts ChartList.
... A Bull Market...
READ MORE
MEMBERS ONLY

OIL JUMPS ON OPEC CUTS -- THAT'S GIVING ENERGY SECTOR A BOOST -- FALLING OIL HAS WEIGHED ON BOND YIELDS -- WEAK ENERGY PATCH AND FALLING STOCK PRICES HAVE ALSO WEAKENED HIGH-YIELD BONDS -- S&P 500 APPEARS TO BE TRIANGULATING WHICH FAVORS LOWER PRICES

by John Murphy,
Chief Technical Analyst, StockCharts.com
LARGER THAN EXPECTED OPEC CUTS BOOST CRUDE OIL ... OPEC and Russia finally agreed to a larger-than-expected production cut of 1.2 million barrels a day of crude oil which is lifting the price of that commodity today. It remains to be seen, however, if that's enough to reverse...
READ MORE
MEMBERS ONLY
Big Recovery Temporarily Halts Slide; Nonfarm Payrolls Weak
by Tom Bowley,
Chief Market Strategist, EarningsBeats.com
Market Recap for Thursday, December 6, 2018
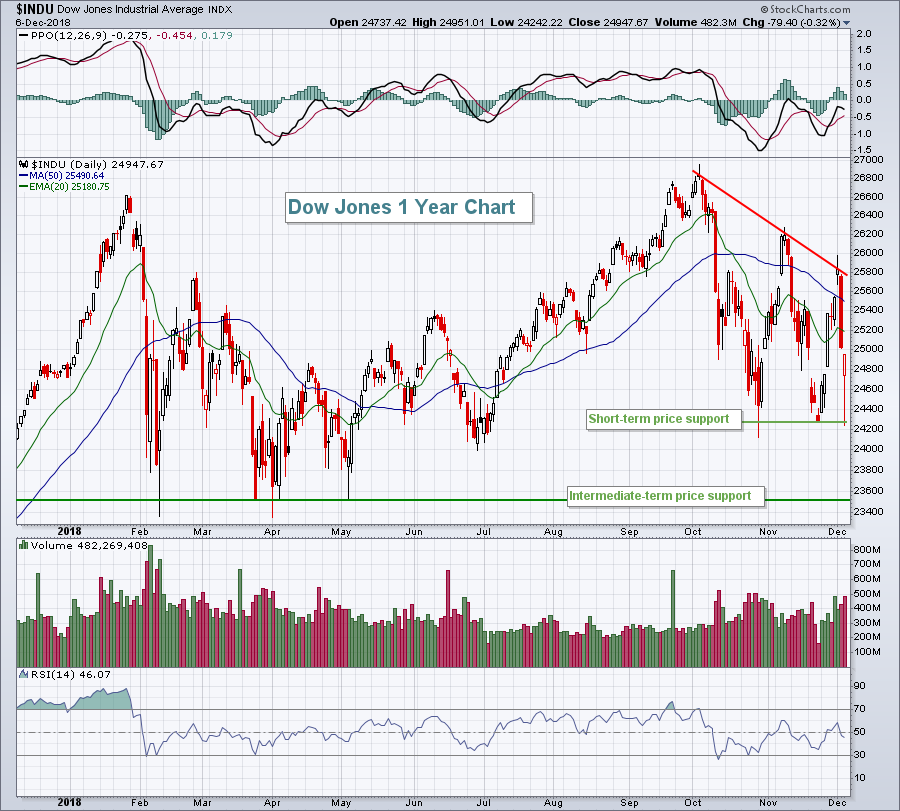
The Dow Jones and S&P 500 were both on a crash course for key February price support until buyers re-emerged just past 11am EST. At the low yesterday, the Dow Jones was down nearly 800 points and it had tumbled more...
READ MORE
MEMBERS ONLY
U.S. Stock Futures Plummeting; Caution Is The Word
by Tom Bowley,
Chief Market Strategist, EarningsBeats.com
Market Recap for Wednesday, December 5, 2018
The U.S. stock market was closed.
Pre-Market Action
U.S. futures look set to continue Tuesday's rout. The 10 year treasury yield ($TNX) is lower by 3 basis points to 2.89% as money seeks out safety in the defensive...
READ MORE
MEMBERS ONLY
Why Is Everybody Talking About The Yield Curve? What Is All The Fuss About?

by Julius de Kempenaer,
Senior Technical Analyst, StockCharts.com
The yield curve has become a popular subject recently. Also, a few commentators on the site have mentioned the yield curve and its recent movements in their blogs recently. Read articles by Chief John, Greg Schnell, and Arthur Hill.
In my DITC contribution of 18 October, I showed how Relative...
READ MORE
MEMBERS ONLY
Kohinoor Foods and Godrej Agrovet
by Milan Vaishnav,
Founder and Technical Analyst, EquityResearch.asia and ChartWizard.ae
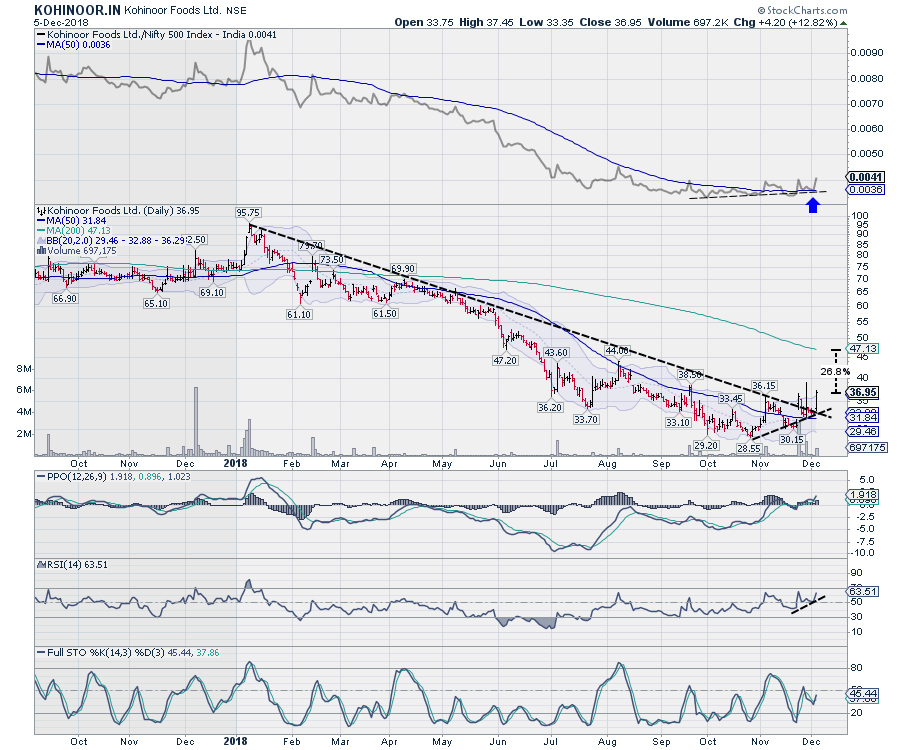
Kohinoor Foods and Godrej Agrovet have under-performed the broader markets for quite some time. Presently, both of them are set to end their downward trajectory and look for some upward revision in prices over the coming days.
Kohinoor Foods Ltd (KOHINOOR.IN)
After hitting a high of 95.75 in...
READ MORE
MEMBERS ONLY

An Emerging Market Trading above its 200-day
by Arthur Hill,
Chief Technical Strategist, TrendInvestorPro.com
The S&P 500 is below its 200-day moving average and most country indexes are also below their 200-day moving averages. Two emerging countries, however, stand out in this crowd: Indonesia and the Philippines.
The first chart shows the Indonesia iShares (EIDO) and the DJ Indonesia Index ($IDDOW) with...
READ MORE
MEMBERS ONLY

REVIEWING THE PHILOSOPHY OF TECHNICAL ANALYSIS -- CHARTS ACT AS LEADING INDICATORS OF FUNDAMENTAL INFORMATION -- THIS WEEK'S PLUNGE IN BOND YIELDS SUGGESTS ECONOMY WEAKENING -- FALLING STOCKS TOLD US THE SAME THING A MONTH AGO
by John Murphy,
Chief Technical Analyst, StockCharts.com
WHY WE LOOK AT CHARTS ... I've written several messages since the start of October about why the sharp stock market drop that month was most likely the start of a major topping process. Previous messages used Elliott Waves, the unusually old age of the current bull market (and...
READ MORE
MEMBERS ONLY
Impulsive Selling Dominates, Dow Jones Drops 800....What Does It Mean?
by Tom Bowley,
Chief Market Strategist, EarningsBeats.com
Market Recap for Tuesday, December 4, 2018
Don't be swayed by market commentary that discusses lack of volume yesterday as a positive. First of all, the Dow Jones fell 800 points. 800!!! And that's somehow a positive? We lost 20 hour EMA support on the intraday...
READ MORE
MEMBERS ONLY

PLUNGING BOND YIELDS SEND SIGNAL OF ECONOMIC WEAKNESS -- S&P 500 FALLS BELOW 200-DAY AVERAGE AFTER FAILING TEST OF NOVEMBER HIGH -- BIGGEST LOSERS ARE BANKS, SMALL CAPS, SEMIS, AND TRANSPORTS -- UTILITIES HIT NEW HIGHS AND ARE THE ONLY WINNERS
by John Murphy,
Chief Technical Analyst, StockCharts.com
TEN-YEAR TREASURY YIELD PLUNGES BELOW ITS 200-DAY AVERAGE ... Chart 1 shows the 10-Year Treasury yield plunging to the lowest level in three months and falling below its 200-day average for the first time in more than a year. That means that investors are putting a lot of money into Treasury...
READ MORE
MEMBERS ONLY
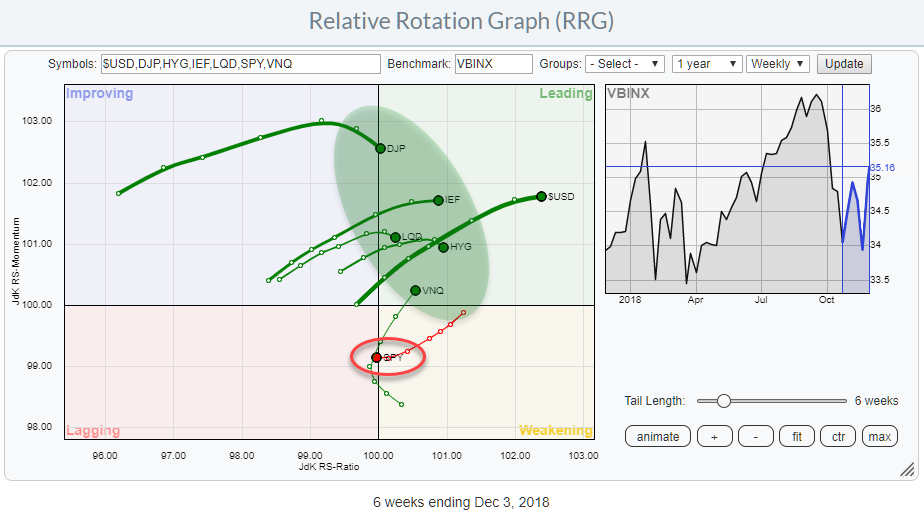
RRG Says Stocks Are The Weakest Asset Class
by Julius de Kempenaer,
Senior Technical Analyst, StockCharts.com
The Relative Rotation Graphs shows the rotation of various asset classes around a balance benchmark portfolio (VBINX).
The message could not be more clear. Stocks (SPY) just crossed over from weakening into the lagging quadrant while ALL other asset classes are inside the leading quadrant.
This is a pretty clear...
READ MORE
MEMBERS ONLY

A Funny Thing May Have Happened To The Secular Reversal In Rates
by Martin Pring,
President, Pring Research
* The Secular Bear Market in Yields
* Near-Term Indications of a Decline in Bond Yields
* Watch That Stock/Bond Relationship for an Important Signal
The Secular Bear Market in Yields
Please note that the comments in this article relate to bond yields with maturities of 3-years or longer. They do not...
READ MORE
MEMBERS ONLY

Unimpressive Breadth - Finance and Industrials Weigh - Strange Happenings in the Bond Market
by Arthur Hill,
Chief Technical Strategist, TrendInvestorPro.com
* Three Gaps in the Same Place for SPY.
* What's Up with Bonds and Utes?
* Strange Happenings on the Yield Curve.
* Finance and Industrials are Still Laggards.
* On Trend on Youtube.
... Internal Strength on Big Bounces ...
Monday's surge was impressive when looking at the change from Friday&...
READ MORE
MEMBERS ONLY
December 2018 Market Roundup with Martin Pring
by Martin Pring,
President, Pring Research
The Market Roundup Video For December is now available.
Good luck and good charting,
Martin J. Pring
The views expressed in this article are those of the author and do not necessarily reflect the position or opinion ofPring Turner Capital Groupof Walnut Creek or its affiliates....
READ MORE
MEMBERS ONLY
As We Head Into Winter, We Should Buy.....Home Construction Stocks?
by Tom Bowley,
Chief Market Strategist, EarningsBeats.com
Market Recap for Monday, December 3, 2018
Global stocks were buoyed on Monday by the United States and China agreeing to delay further tariffs for 90 days to provide the two countries an opportunity to work through its trade differences. Obviously, nothing has been resolved and it simply pushes back...
READ MORE
MEMBERS ONLY

Interview with Japanese Trader: Takehiro Hikita - Part 1
by Greg Morris,
Veteran Technical Analyst, Investor, and Author
This is a lengthy interview, so this article will be the first half, followed next week by the second part. Mr. Takehiro Hikita has graciously provided me with a large amount of insight into the candle pattern philosophy. I have never met anyone so devoted to the detailed study of...
READ MORE
MEMBERS ONLY
Here's A Bear Market Signal That's Yet To Turn Bearish
by Tom Bowley,
Chief Market Strategist, EarningsBeats.com
Market Recap for Friday, November 30, 2018
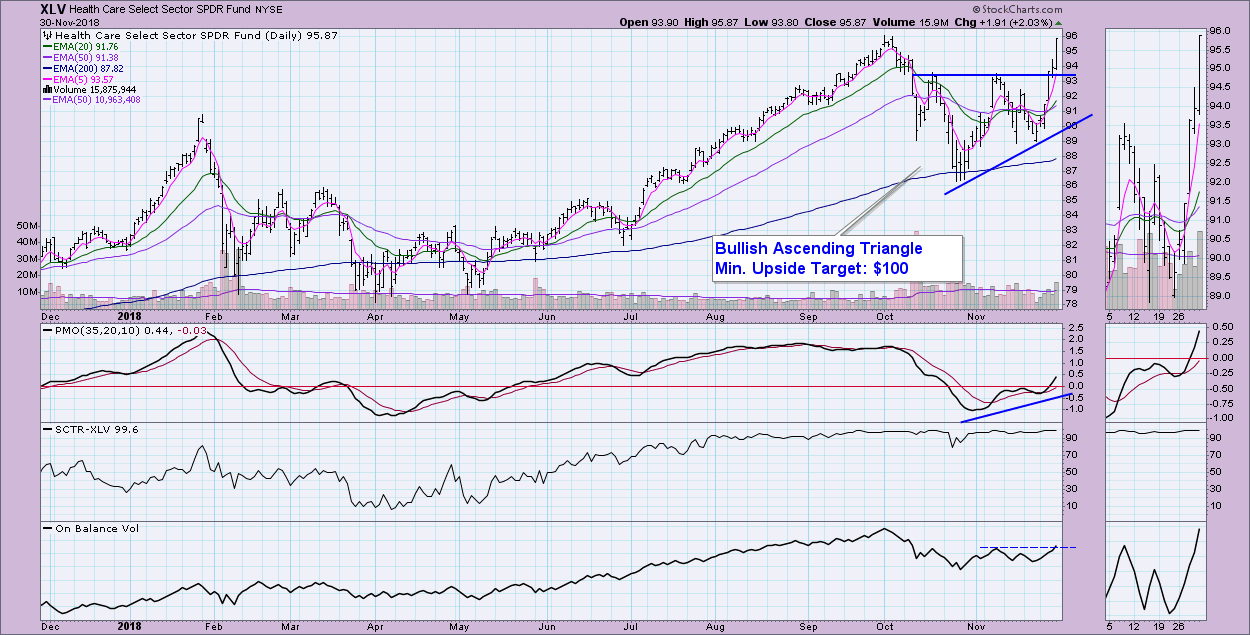
Friday's strength capped off a very solid week for the bulls, one in which the Dow Jones gained more than 1250 points. Strength was found everywhere although healthcare (XLV, +2.03%) and utilities (XLU, +1.48%) were the big winners to...
READ MORE
MEMBERS ONLY

Cisco Holds Up Well and Maintains Uptrend
by Arthur Hill,
Chief Technical Strategist, TrendInvestorPro.com
Relative strength, an uptrend and a bullish continuation pattern point to higher prices for Cisco (CSCO). First and foremost, Cisco is in a long-term uptrend. The stock recorded a 52-week high in early October, the 50-day SMA is above the 200-day SMA and price is above the 200-day.
Second, Cisco...
READ MORE
MEMBERS ONLY

International Intrigue
by Bruce Fraser,
Industry-leading "Wyckoffian"
Rolling into the New Year can often bring seismic shifts in financial markets. In January of 2018 stock indexes climaxed and reversed. This set the tone of market action for the year. International markets were among the hardest hit during the year. The iShares MSCI Emerging Markets ETF (EEM) declined...
READ MORE
MEMBERS ONLY
Combining Strong Technicals And Fundamentals To Wildly Outperform The S&P 500
by Tom Bowley,
Chief Market Strategist, EarningsBeats.com
Everybody wants the secret formula. You know, the one where you never lose money. Well, I haven't found THAT one yet, but trading companies that have recently beaten Wall Street revenue and EPS estimates is a fairly solid runner-up strategy. A company that produces results in excess of...
READ MORE
MEMBERS ONLY
Healthcare Sector Bullish in All Three Timeframes
by Erin Swenlin,
Vice President, DecisionPoint.com
In my Thursday article in the DecisionPoint blog, I discussed the new PMO BUY signals on the DP Scoreboards, finishing off the article with a chart of the Healthcare Sector ETF (XLV) after I received a new Intermediate-Term Trend Model BUY signal (a positive 20/50-EMA crossover on the daily...
READ MORE
MEMBERS ONLY

Confirming Moving Average Signals in the S&P 500
by Arthur Hill,
Chief Technical Strategist, TrendInvestorPro.com
The S&P 500 is the most widely used benchmark for U.S. stocks and the 200-day SMA is the most widely used moving average. Together, chartists can use the S&P 500 and the 200-day SMA to determine the broad trend for the stock market.
The S&...
READ MORE
MEMBERS ONLY
Weekly Outlook: NIFTY moves past 50-Week MA; sustenance above that may take Nifty higher
by Milan Vaishnav,
Founder and Technical Analyst, EquityResearch.asia and ChartWizard.ae
The previous week remained much better than expected for the markets, as the benchmark Index NIFTY50 ended the week on a strong note. The week proved to be even more technically important as the NIFTY was able to move past its 50-Week MA, after having resisted that level for seven...
READ MORE
MEMBERS ONLY
DP Weekly/Monthly Wrap: The Monkey Did It
by Carl Swenlin,
President and Founder, DecisionPoint.com
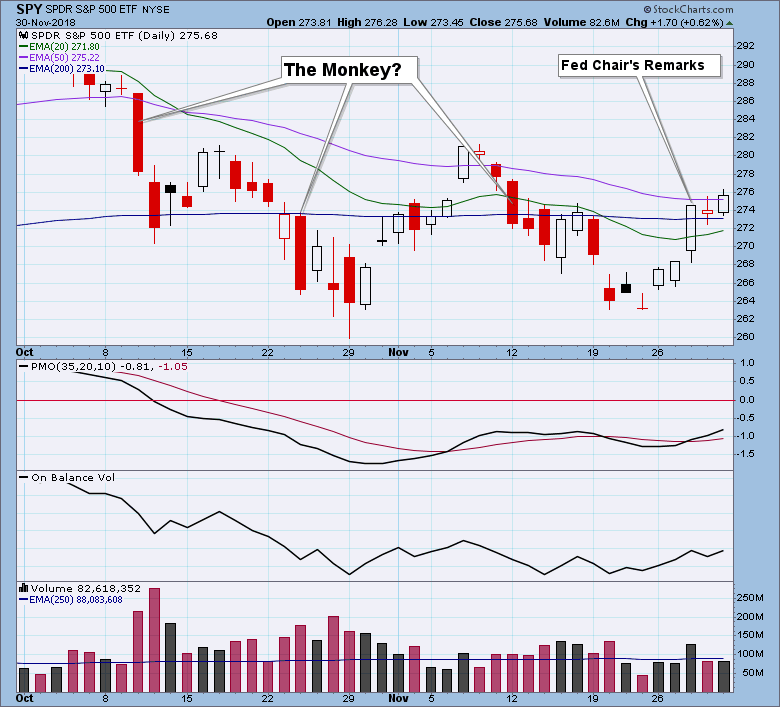
I usually spend my days at my desk noodling on the computer, reading, and casually watching business television with the sound off. (My idea of retirement.) With no sound to distract/annoy me, the most dangerous part of the TV watching is the endless stream of headline banners that announce...
READ MORE
MEMBERS ONLY

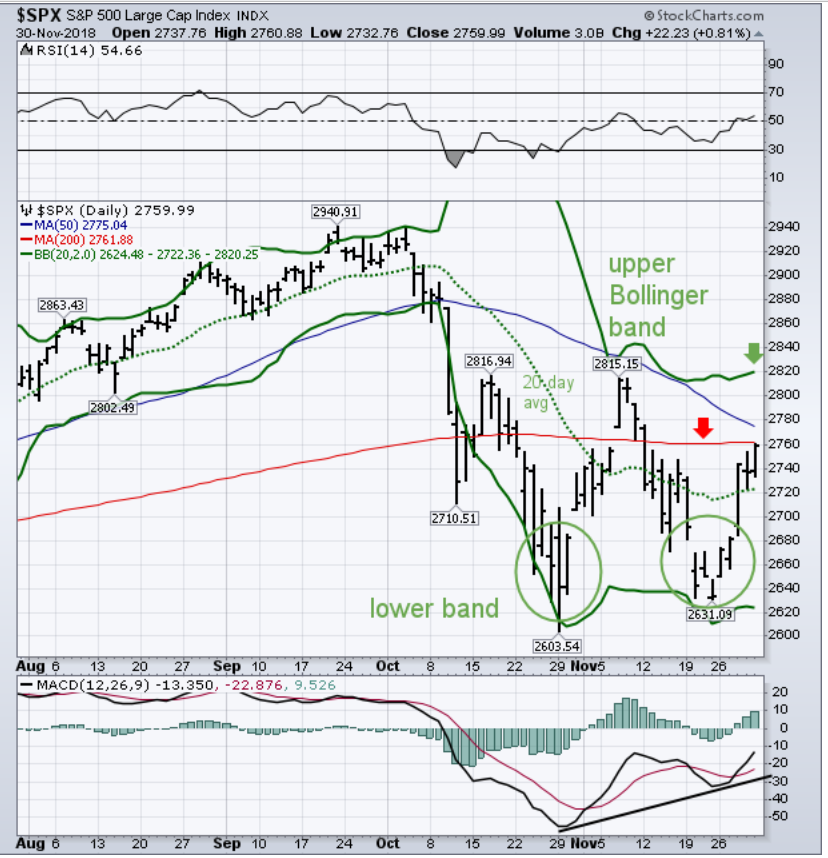
DAILY BOLLINGER BANDS SHOW SHORT-TERM STOCK TREND IMPROVING AND A POSSIBLE RETEST OF NOVEMBER HIGH -- WEEKLY AND MONTHLY BANDS ALSO SHOW SUPPORT -- BOLLINGER BAND WIDTH, HOWEVER, SHOWS THAT VOLATILITY REMAINS ELEVATED
by John Murphy,
Chief Technical Analyst, StockCharts.com
SHORT-TERM TREND IS IMPROVING ... There are lots of ways to determine the trend of the stock market. The placement of moving average lines is one of them. Bollinger bands (invented by John Bollinger) are another. Chart 1 applies both techniques to a daily chart of the S&P 500....
READ MORE
MEMBERS ONLY
Sticking With Companies That Report Strong Earnings

by John Hopkins,
President and Co-founder, EarningsBeats.com
The market finally found its legs last week after the Fed signaled they might slow down their interest rate-raising campaign. In fact, after being technically wounded for some time, all of the major indexes closed back above their respective 20-day moving averages, with the Dow clearing its 200 day as...
READ MORE
MEMBERS ONLY
Short-Term Trend is Improving
by John Murphy,
Chief Technical Analyst, StockCharts.com
Editor's Note: This article was originally published in John Murphy's Market Message on Friday, November 30th at 2:36pm ET.
There are lots of way to determine the trend of the stock market. The placement of moving average lines is one of them. Bollinger bands (invented...
READ MORE
MEMBERS ONLY

Ask Yourself This Question, But Make Sure You Do It This Sunday

by Grayson Roze,
Chief Strategist, StockCharts.com
I’m going to let you in on a little secret. The bulk of my financial analysis, portfolio reviews, and trading decision making happens on Sundays. Sure, I have daily trading routines that are tremendously important, and of course, I'm constantly watching the market during the week. But...
READ MORE