MEMBERS ONLY
Taking the Temperature of the Stock Market

by Arthur Hill,
Chief Technical Strategist, TrendInvestorPro.com
The Momentum Factor iShares (MTUM) and the Minimum Volatility iShares (USMV) represent opposing sides of the market. High flying stocks can be found in the momentum ETF, while the more boring issues dominate the minimum volatility ETF.
Using these two ETFs, chartists can quickly take the temperature of the stock...
READ MORE
MEMBERS ONLY
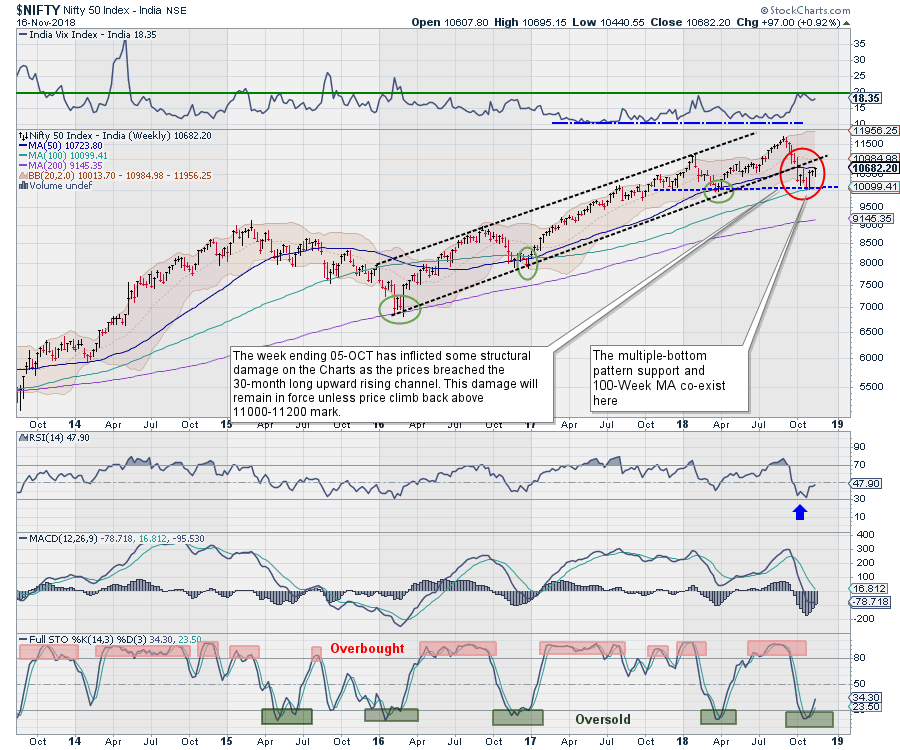
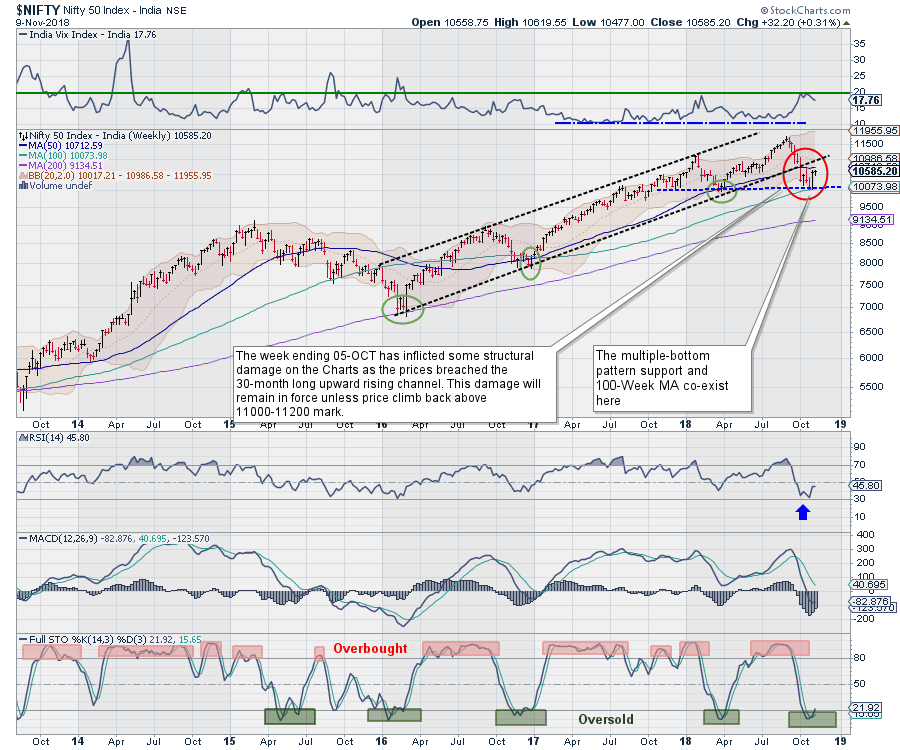
Week Ahead: NIFTY Has Multiple Overhead Resistances to Deal With in This Short Week

by Milan Vaishnav,
Founder and Technical Analyst, EquityResearch.asia and ChartWizard.ae
The Indian Equity Markets spent the entire week on expected lines. The previous week was expected to be turbulent, and the zone of 10600-10750 was set to pose stiff resistance to the Markets. On these analyzed lines, the NIFTY continued to remain volatile all throughout the week. The benchmark Index...
READ MORE
MEMBERS ONLY
You Really CAN Make Money in a Rough Market Environment

by John Hopkins,
President and Co-founder, EarningsBeats.com
The quarter beginning 10-1-18 has been challenging for a lot of traders. The NASDAQ has lost almost 10% while the S&P has lost 6%, both well off the quarter's low. Volatility has reigned with the VIX at elevated levels for most of the quarter. It has...
READ MORE
MEMBERS ONLY
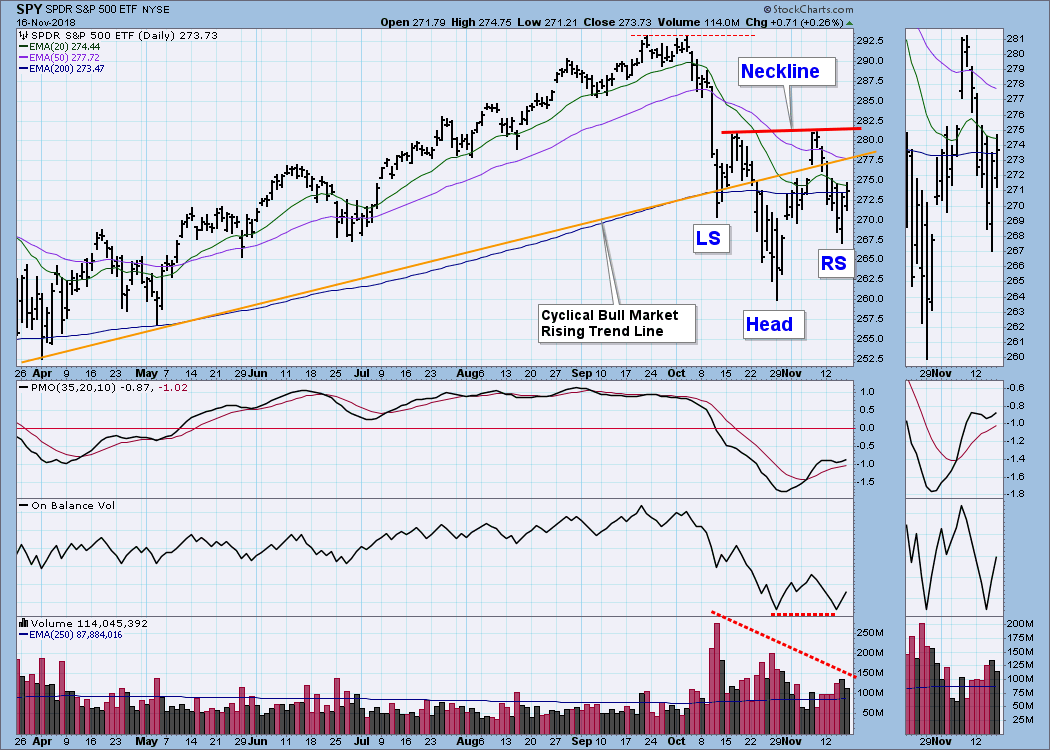
DP Weekly Wrap: Does SPY Have Bullish Reverse H&S? Gold Sentiment Is Looking Contrarian

by Carl Swenlin,
President and Founder, DecisionPoint.com
A lot of people are seeing a reverse head and shoulders pattern developing, and it is really not hard to spot. From Friday's close, it will take a rally of a little less than 3% for price to reach the neckline. Add another 4.5% and new, all-time...
READ MORE
MEMBERS ONLY
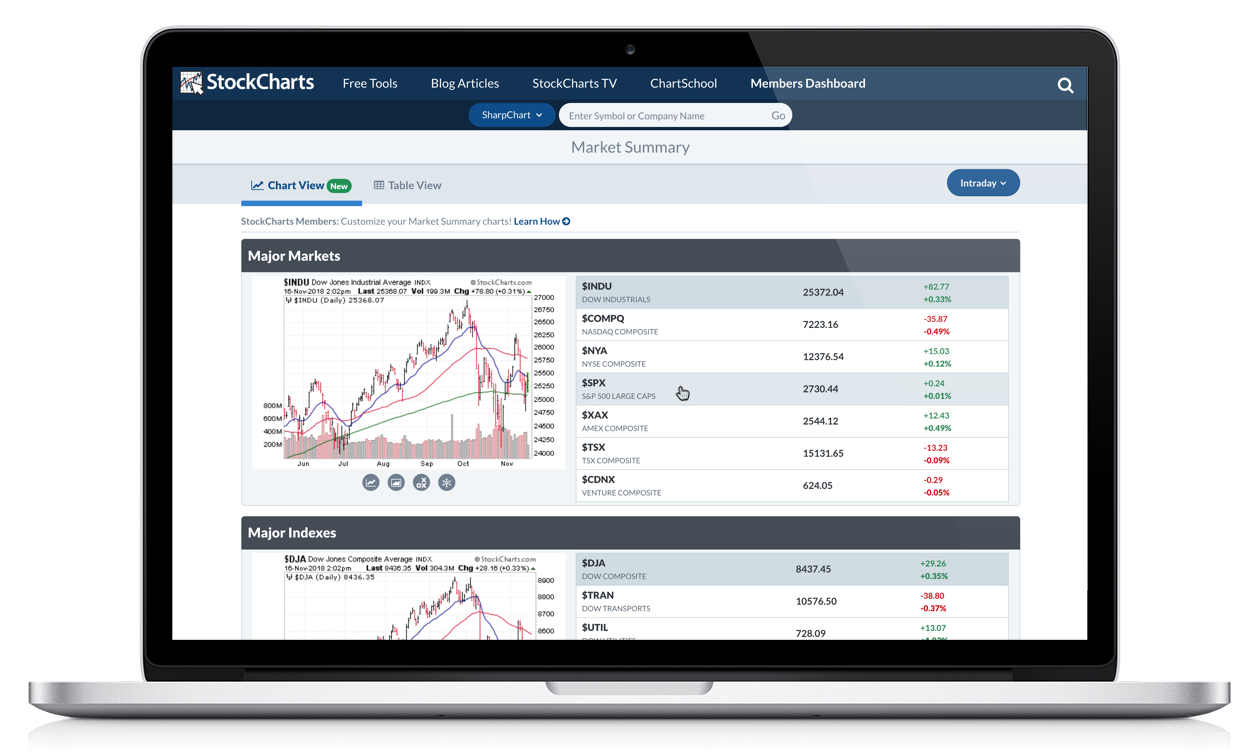
NEW! Introducing "Chart View" For Market And Industry Summary Pages

by Grayson Roze,
Chief Strategist, StockCharts.com
The more charts, the better. That's my motto, especially this week. I'm happy to announce that our Market Summary and Industry Summary pages have recently received a major upgrade – "Chart View" is here! We've expanded the functionality of these two important pages,...
READ MORE
MEMBERS ONLY
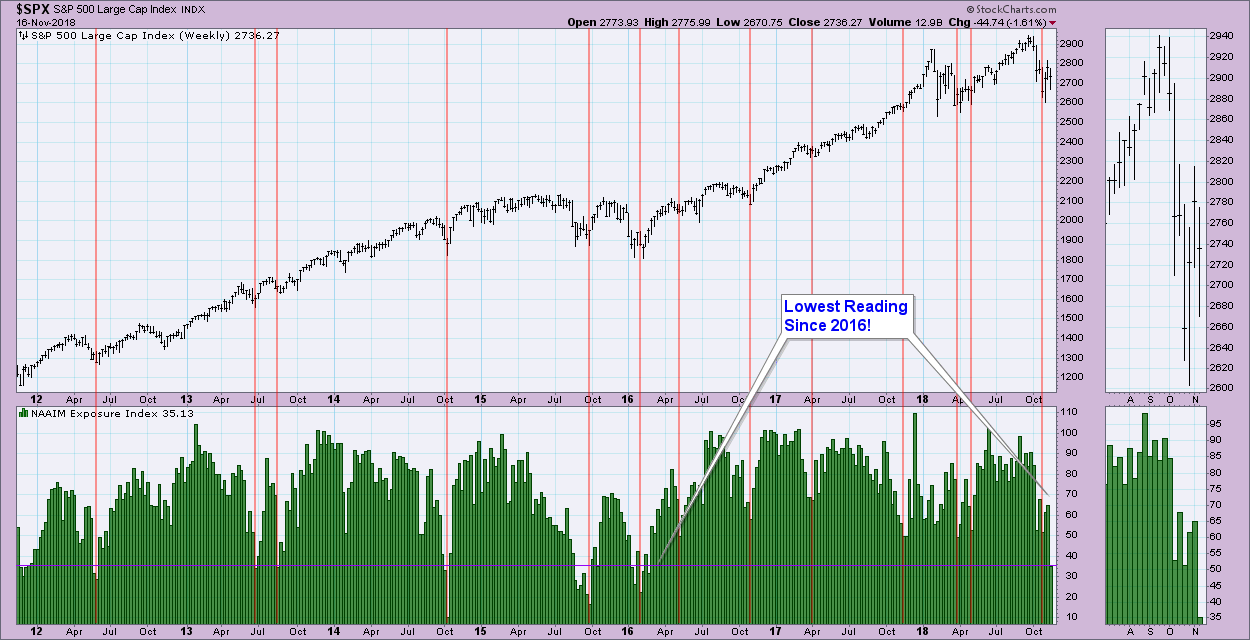
Money Managers Report Lowest Exposure Since Early 2016

by Erin Swenlin,
Vice President, DecisionPoint.com
One of the sentiment indicators that I update MarketWatchers LIVE viewers on each Friday is the National Association of Active Investment Managers (NAAIM) exposure reading. A few things you should know about these guys. NAAIM’s membership ranges from small regional firms to large national firms, including hedge fund managers,...
READ MORE
MEMBERS ONLY
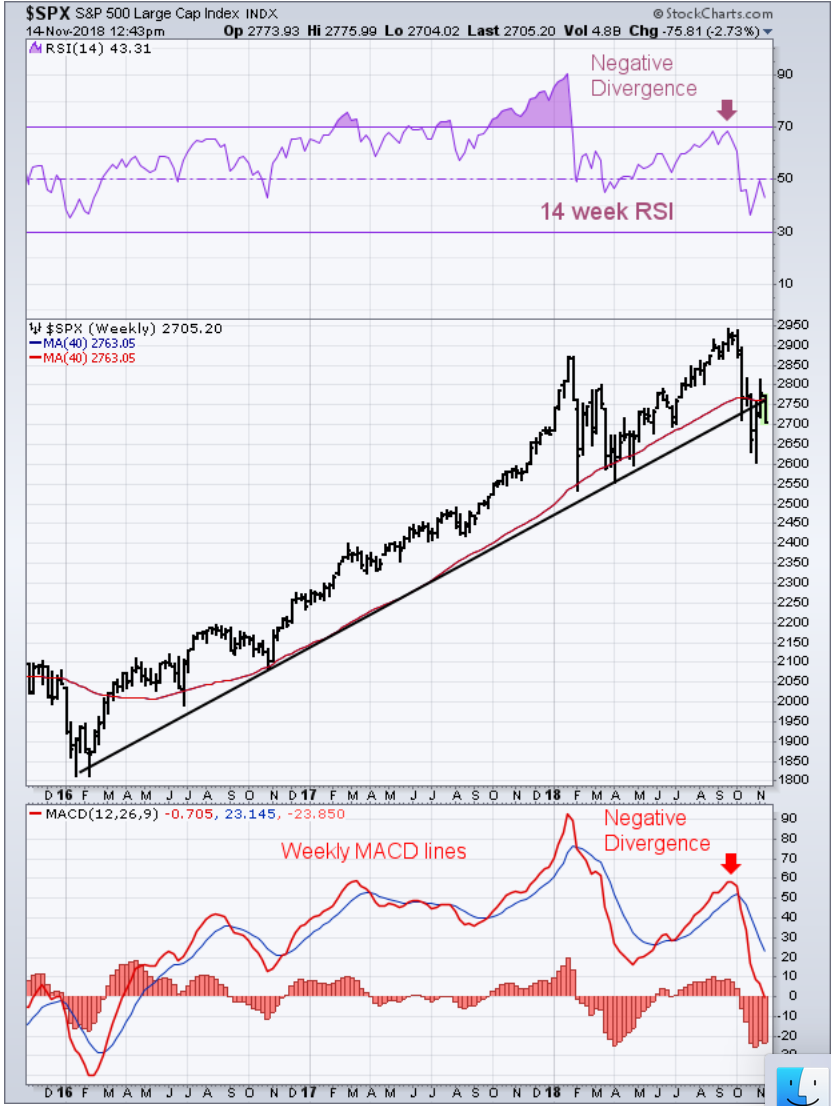
The Reason Short-Term Rallies are Failing is Because Weekly Charts Look Even More Negative

by John Murphy,
Chief Technical Analyst, StockCharts.com
Editor's Note: This article was originally published in John Murphy's Market Message on Wednesday, November 14th at 1:39pm ET.
The weekly bars in Chart 2 show the last upleg of the S&P 500 uptrend that began in early 2016. And it shows that...
READ MORE
MEMBERS ONLY

Experimenting with breadth on Relative Rotation Graphs

by Julius de Kempenaer,
Senior Technical Analyst, StockCharts.com
Various breadth indicators are used to analyze the underlying strength or weakness of a broad market index like the S&P 500 index or NYSE. Over the years a number of different breadth indicators have been developed and/or used in their work by well known technical analysts.
A...
READ MORE
MEMBERS ONLY

ETF Guru Retires: Leaves Us with Six Key Lessons

by Gatis Roze,
Author, "Tensile Trading"
This is a salute to Ben Johnson, the departing editor of Morningstar’s ETF Investor publication. Over the years, I’ve come to look forward to his pithy observations about the ETF marketplace. To use his own words in describing his replacement, Alex Bryan, he wrote “He’s bright, articulate...
READ MORE
MEMBERS ONLY

Weekly Market Review & Outlook (with video) - Digesting the Breakdowns
by Arthur Hill,
Chief Technical Strategist, TrendInvestorPro.com
* Performance Overview.
* Ranging after Breakdown.
* Other Bearish Developments.
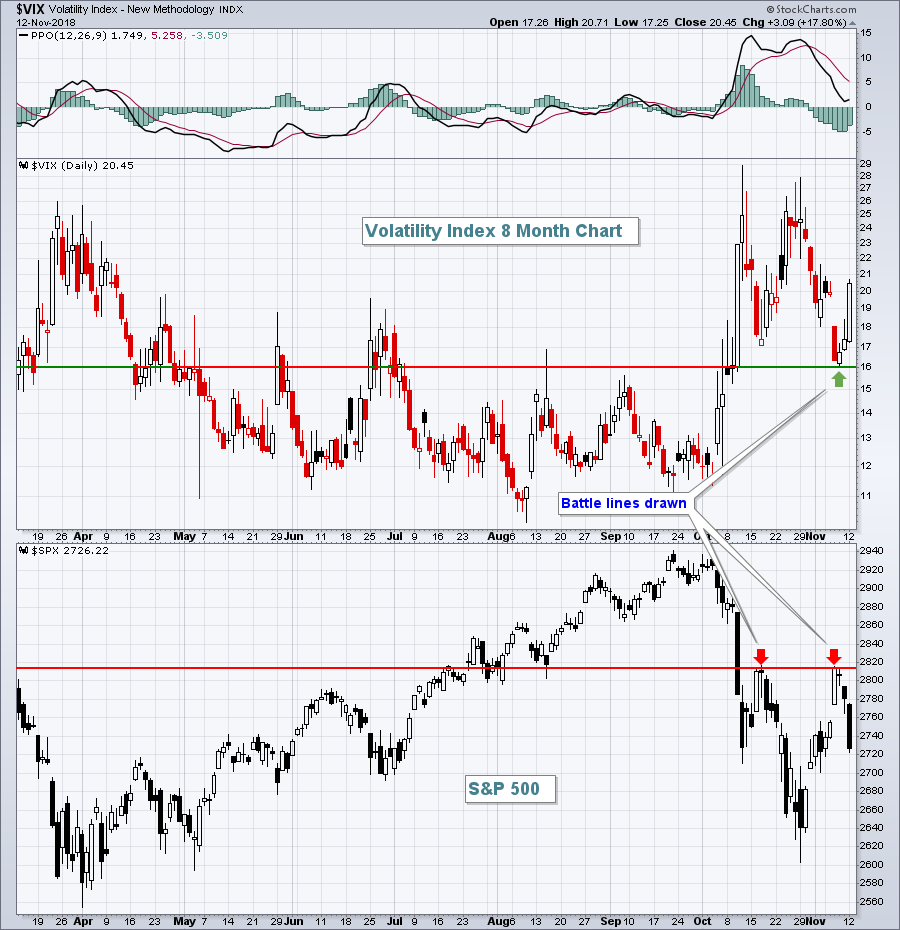
* Volatility Heats Up.
* Momentum versus Low Volatility.
* Staples and Utes Hold Up.
* Healthcare and REITs Outperform.
* Big Bounces within even Bigger Downtrends.
* Notes from the Art's Charts ChartList.
... Ranging after Breakdown
The S&P 500 was thrown off trend...
READ MORE
MEMBERS ONLY
History Supports Bullish Move But Earnings Last Night Could Dampen Bulls' Victory Thursday

by Tom Bowley,
Chief Market Strategist, EarningsBeats.com
Reminder
I post a blog article every morning that the stock market is open in a format similar to today's article. If you haven't already subscribed (for FREE) and would like to, simply scroll to the bottom of this article and type your email address into...
READ MORE
MEMBERS ONLY
30% Gain From Here Over Next Year Possible? This Chart Says YES
by Tom Bowley,
Chief Market Strategist, EarningsBeats.com
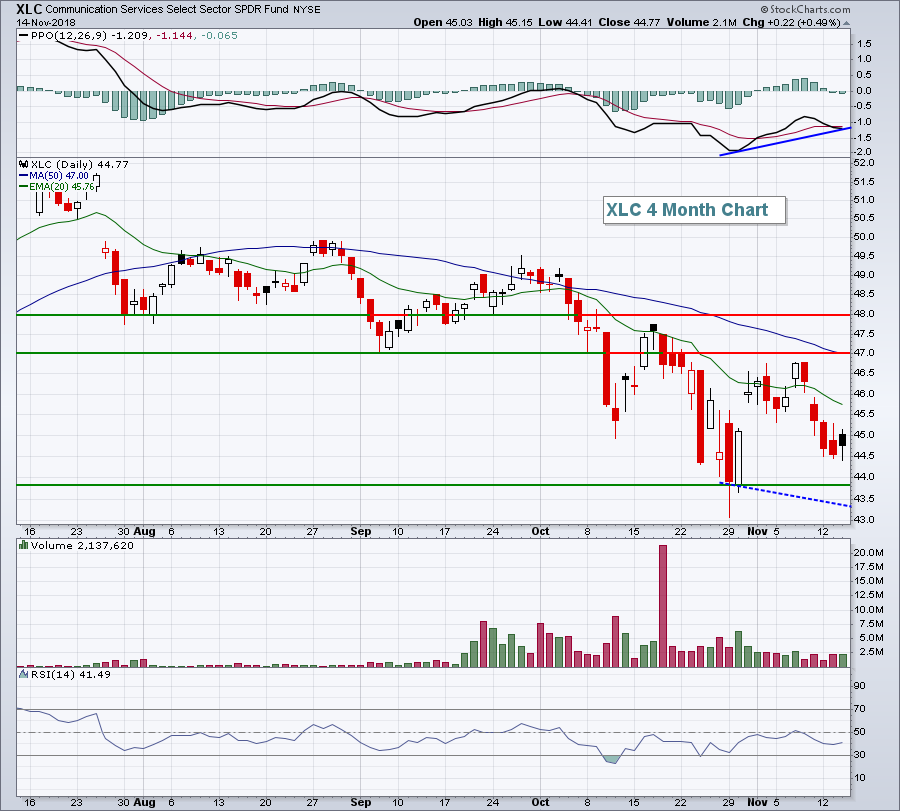
Market Recap for Wednesday, November 14, 2018
In a rare twist, communication services (XLC, +0.49%) was the only sector to gain ground yesterday. The group has underperformed the S&P 500 badly since its July relative high with Facebook's (FB) quarterly earnings report on July 25th...
READ MORE
MEMBERS ONLY
Small cap stocks are leading the market lower.
by Julius de Kempenaer,
Senior Technical Analyst, StockCharts.com
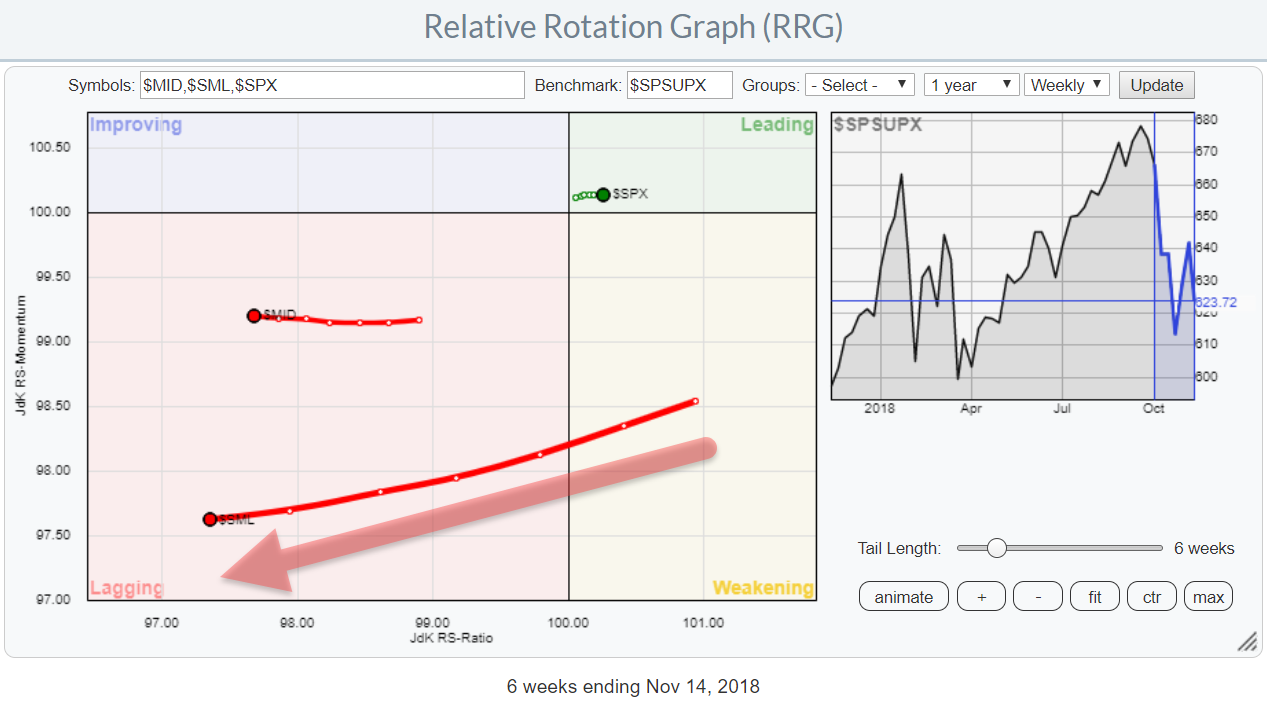
There are many indexes available to monitor and analyze the stock market. The S&P500, together with Daddy "Dow" being among the more popular ones.
But the S&P 500, although covering 500 stocks, is only looking at one segment of the total market. Only large-cap...
READ MORE
MEMBERS ONLY

DP Alert: Two More ST SELL Signals - Monthly PMO SELL Signals Likely
by Erin Swenlin,
Vice President, DecisionPoint.com
Before I get into the nitty gritty here, I want to relate a story of what literally (yes, literally) just happened to me about 10 minutes ago. I got a text from my 10-year old nephew, "Is there anyway I can check what is happening to the Nestle stock...
READ MORE
MEMBERS ONLY
Trade Setup - Tandem (TNDM) In Real Time
by Tom Bowley,
Chief Market Strategist, EarningsBeats.com
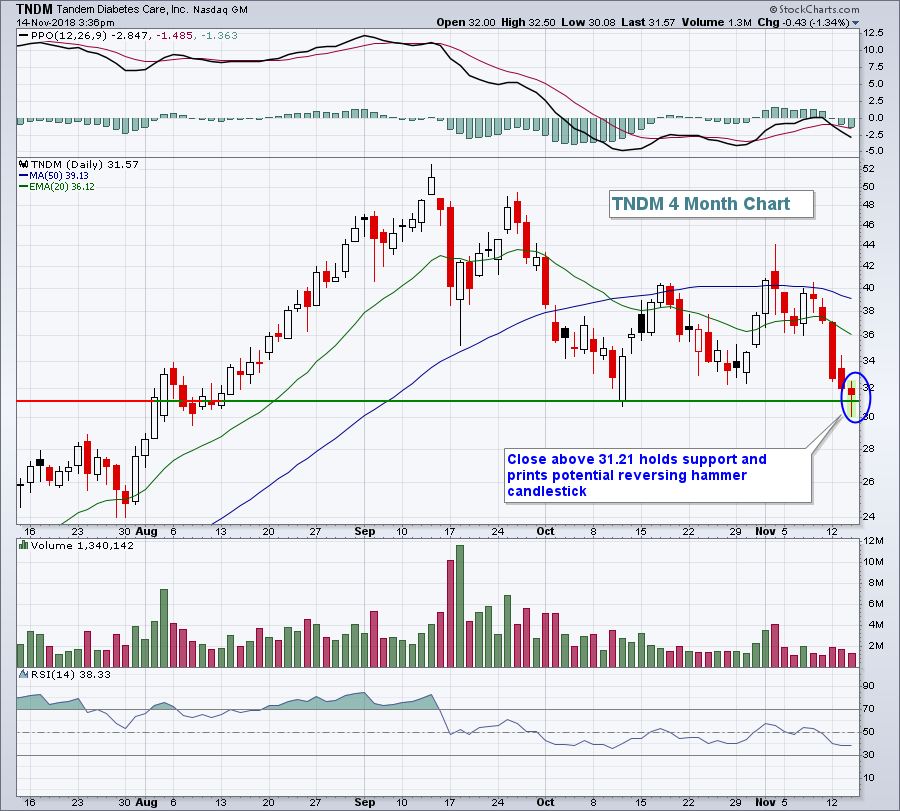
From a trading perspective, I wanted to give you a quick idea of what I look for in a trade. I bought Tandem Diabetes Care (TNDM) when it crossed back above 31.21 and I'll hold it unless it closes beneath 31.00 or moves intraday beneath 30....
READ MORE
MEMBERS ONLY

STOCKS CONTINUE THEIR NOVEMBER SLIDE -- THE S&P 500 MAY RETEST ITS LATE OCTOBER LOW -- THE REASON SHORT-TERM RALLIES ARE FAILING IS BECAUSE WEEKLY CHARTS LOOK EVEN MORE NEGATIVE -- THE S&P 500 MONTHLY CHART ALSO SHOWS SIGNS OF WEAKENING
by John Murphy,
Chief Technical Analyst, StockCharts.com
SHORT-TERM STOCK TREND CONTINUES TO WEAKEN ... Today's higher open is giving way to more afternoon selling. We've seen that same pattern over the past week as stock prices have started to slide again. The daily bars in Chart 1 show the S&P 500 Index...
READ MORE
MEMBERS ONLY

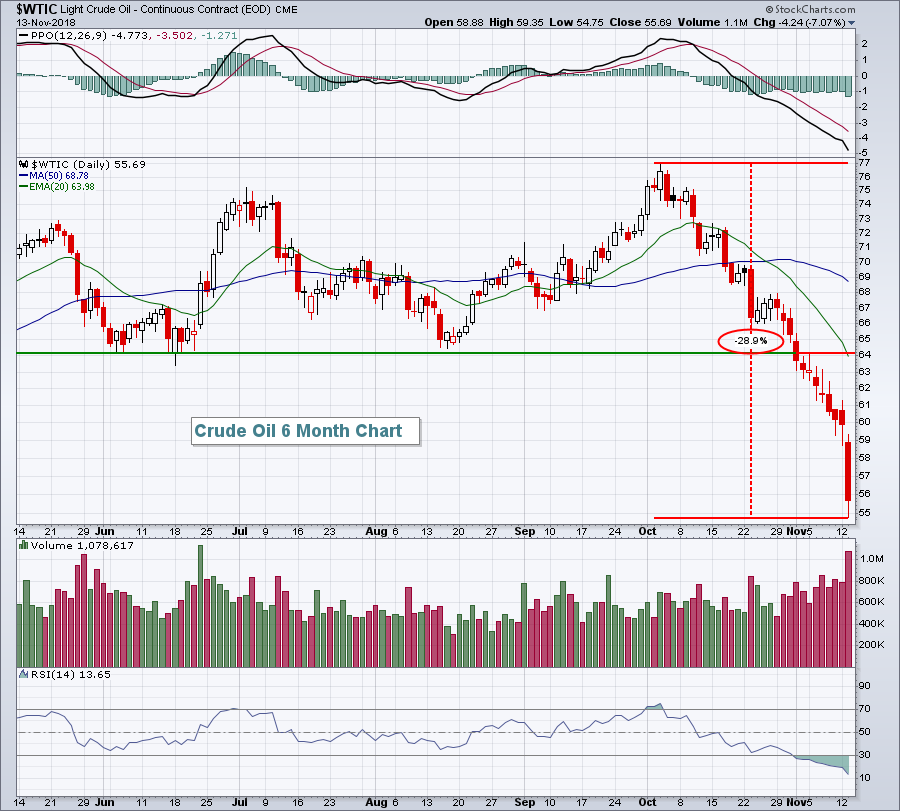
Has Oil Hit A Temporary Bottom?

by Martin Pring,
President, Pring Research
* Commodities in General Remain in a Bear Market
* Oil is Also in a Primary Bear Market
* The Chart That Says That Some Kind of Bottom is at Hand
I last wrote about oil back in early August, in an article entitled More Evidence Of A Commodity Bear Market. Back then,...
READ MORE
MEMBERS ONLY
These Two Stocks Present Short-Term Opportunities
by Milan Vaishnav,
Founder and Technical Analyst, EquityResearch.asia and ChartWizard.ae
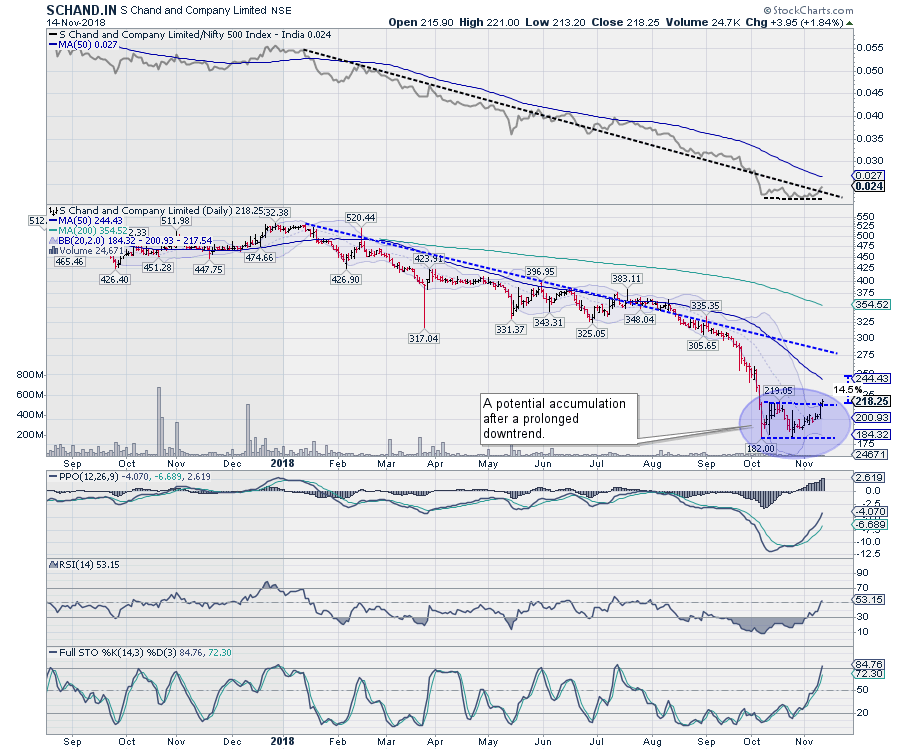
Potential Trend Reversal in SCHAND.IN
S Chand And Company Limited (SCHAND.IN) is one of the leading publishing houses in India. In May 2017, the stock listed at 673. Over the following 17 months, the stock saw its value erode by ~73% as the stock remained in a secular...
READ MORE
MEMBERS ONLY

Key Levels for SPY and QQQ
by Arthur Hill,
Chief Technical Strategist, TrendInvestorPro.com
* SPY Draws a Line in the Sand.
* QQQ Lags SPY on Rebound.
* Scanning for 5-day ROC.
* Auto Parts Stocks Stand Out.
* On Trend on Youtube.
... SPY Draws a Line in the Sand
... The S&P 500 SPDR (SPY) and the Nasdaq 100 ETF (QQQ) gapped up the day after...
READ MORE
MEMBERS ONLY
Gold Downtrend Resuming As Is S&P 500's
by Tom Bowley,
Chief Market Strategist, EarningsBeats.com
Market Recap for Tuesday, November 13, 2018
Losses weren't big on Tuesday as the Dow Jones dropped just 0.40% and was the worst performing of our major indices. But it seemed to be more of a continuation of the recent downtrend as all key areas of the...
READ MORE
MEMBERS ONLY

Thoughts on Technical Indicators

by Greg Morris,
Veteran Technical Analyst, Investor, and Author
There is a myriad of technical indicators available to traders, and regardless of which indicators are used, blending them with other tools and good charting skills can produce a more in-depth picture of the price action. For example, a stock may be approaching a support level defined by a trend...
READ MORE
MEMBERS ONLY

The First Death Crosses Appear
by Arthur Hill,
Chief Technical Strategist, TrendInvestorPro.com
A classic death cross occurs when the 50-day moving average moves below the 200-day moving average. On the flip side, a golden cross occurs when the 50-day SMA moves above the 200-day SMA. The 50-day SMAs have been above the 200-day SMAs for all major stock indexes this entire year...
READ MORE
MEMBERS ONLY
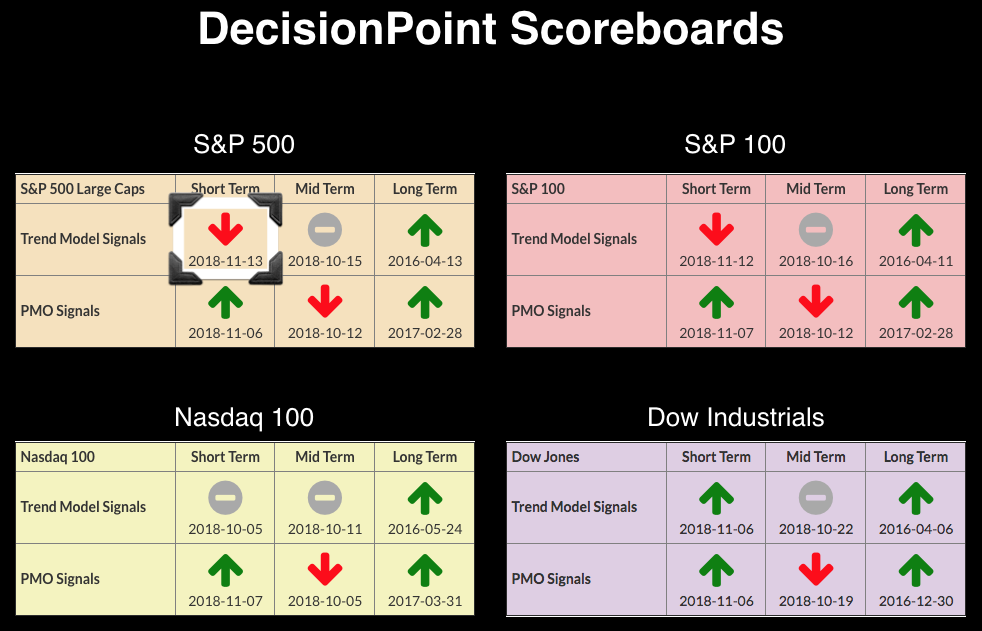
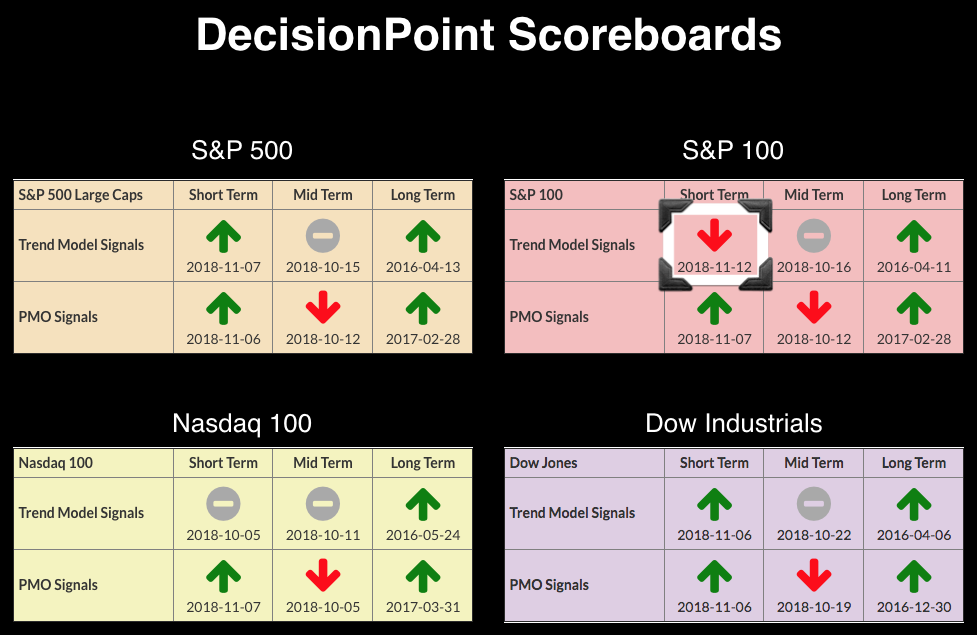
DP Bulletin #2: SPX Adds Short-Term Trend Model SELL Signal
by Erin Swenlin,
Vice President, DecisionPoint.com
The OEX added a ST Trend Model SELL signal yesterday, and today the SPX will join with its own ST Trend Model SELL signal. These signals are generated on 5/20-EMA crossovers. When it is a positive crossover, it is a BUY signal. When it is a negative crossover, the...
READ MORE
MEMBERS ONLY

Natural Gas Lights Up

by Bruce Fraser,
Industry-leading "Wyckoffian"
U. S. Natural Gas Fund (UNG) made an important ‘Spring’ low at the end of 2017. A Change-of-Character (CHoCH) emerged in the trading behavior of UNG in the new year. On the weekly chart UNG had been in a one year downtrend that concluded with a Spring and a Test....
READ MORE
MEMBERS ONLY

When Emotions Take Over

by David Keller,
President and Chief Strategist, Sierra Alpha Research
I recently returned from a 10-day trip to Kuala Lumpur and Singapore. This was my first time in Malaysia, where I spoke at the IFTA Annual Conference along with my fellow StockCharts commentators Julius de Kempenaer and Martin Pring.
After the conference, when I was checking out of the hotel...
READ MORE
MEMBERS ONLY
Semiconductors Are In A Bear Market, Follow This Trading Range
by Tom Bowley,
Chief Market Strategist, EarningsBeats.com
Market Recap for Monday, November 12, 2018
Welcome back bears. Welcome back volatility. It was another day of steep losses on Wall Street, underscoring the likely end to what the bulls were hoping was a sustainable rally back to recent highs. There was a major test last week for the...
READ MORE
MEMBERS ONLY
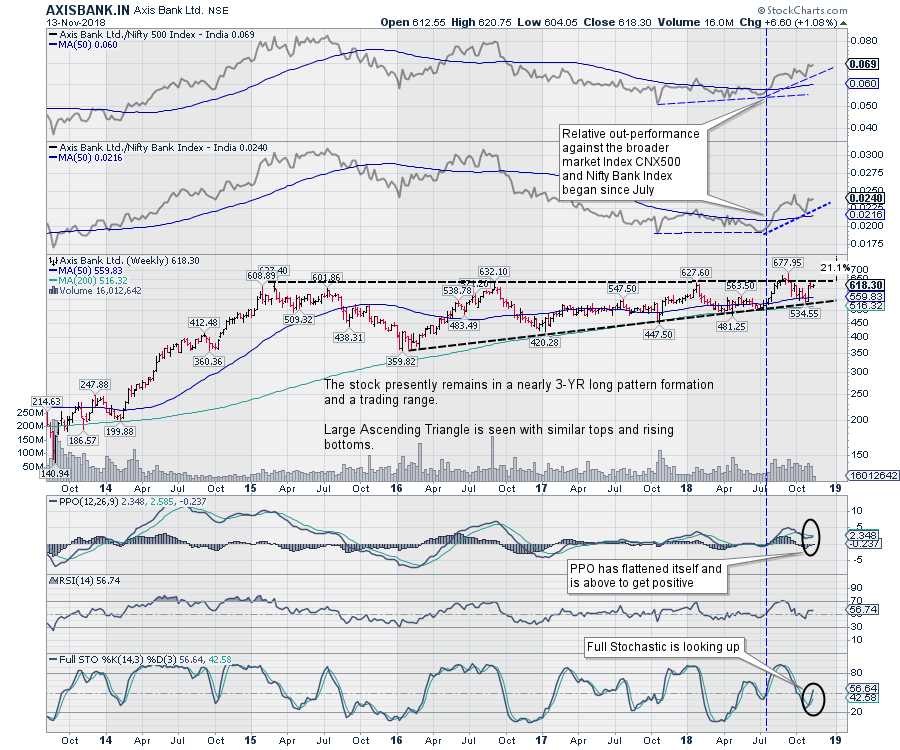
Stock-in-Focus: Despite Some Consolidation, This Banking Stock is Likely to Make Decisive Moves
by Milan Vaishnav,
Founder and Technical Analyst, EquityResearch.asia and ChartWizard.ae
Over the last four to five weeks, the NIFTY Bank Index ($BANKNIFTY) has not only out-performed the Public Sector Bank Index among the banking space, but it has also seen sharp improvement in relative momentum against the Broader Market Index $CNX500. Many of the Nifty Bank Index components are interestingly...
READ MORE
MEMBERS ONLY
Using RRG to find some good and some not so good names inside the DJ Industrials index.
by Julius de Kempenaer,
Senior Technical Analyst, StockCharts.com
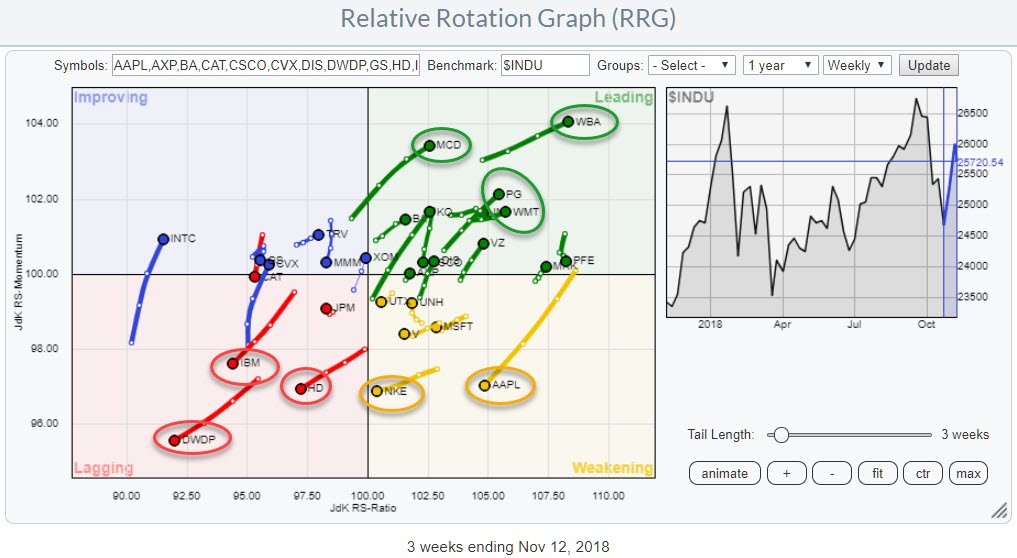
The relative rotation graph above shows the rotation of the 30 DJ Industrials stocks. Watching the interaction on the canvas, a few rotations catch the eye.
Inside the lagging quadrant IBM, HD, and DWDP are clearly moving deeper into negative territory. On the opposite side inside the leading quadrant, we...
READ MORE
MEMBERS ONLY
DP Bulletin: OEX First to Log Short-Term SELL Signal
by Erin Swenlin,
Vice President, DecisionPoint.com
The whipsaw Short-Term Trend Model BUY signal generating on the OEX Friday below its 50-EMA was the culprit for today's ST Trend Model SELL signal. Remember that ST Trend Model signals are generated by 5/20-EMA crossovers in relation to the 50-EMA. A positive crossover is always a...
READ MORE
MEMBERS ONLY

TECH STOCKS CONTINUE TO LEAD MARKET LOWER -- TECHNOLOGY SPDR SLIPS FURTHER BELOW ITS 200-DAY AVERAGE -- APPLE DROPS TOWARD ITS 200-DAY LINE AS MICROSOFT WEAKENS -- BROADCOM AND INTEL LEAD CHIP STOCKS SHARPLY LOWER -- S&P 500 IS BACK BELOW ITS 200-DAY LINE
by John Murphy,
Chief Technical Analyst, StockCharts.com
TECHNOLOGY SPDR FALLS FURTHER BELOW ITS 200-DAY AVERAGE ... Technology stocks continue to lead the stock market lower today. The Technology Sector SPDR (XLK) fell back below its 200-day average on Friday, and is falling further below it today (Chart 1). To get an idea of how much the techs have...
READ MORE
MEMBERS ONLY
Are Copper Prices Signaling S&P 500 Bear Market Like In Prior Years?
by Tom Bowley,
Chief Market Strategist, EarningsBeats.com
Market Recap for Friday, November 9, 2018
There was a return of strength in defensive sectors on Friday as consumer staples (XLP, +0.58%), utilities (XLU, +0.15%) and real estate (XLRE, +0.12%) were the only sectors to finish the session in positive territory. There was also significant relative...
READ MORE
MEMBERS ONLY

Goldman Continues to Struggle
by Arthur Hill,
Chief Technical Strategist, TrendInvestorPro.com
Goldman Sachs is the premier investment bank and a key component of the Financials SPDR (XLF), as well as the Broker-Dealer iShares (IAI). The stock has struggled since March and lagged the market for over six months now. While the S&P 500 moved to a new high in...
READ MORE
MEMBERS ONLY
DP Weekly Wrap: Break or Fake?
by Carl Swenlin,
President and Founder, DecisionPoint.com
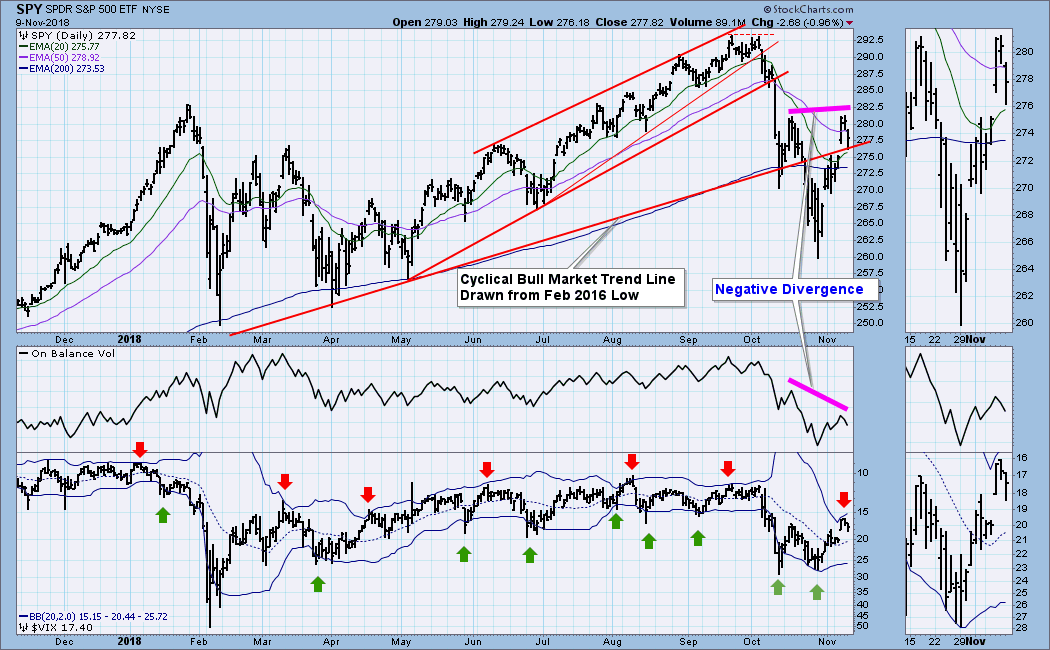
Last week SPY was below the cyclical bull market rising trend line. This week there was a post-election pop on Wednesday that caused SPY to recapture that rising trend line. Will that breakout hold, or is it a fakeout? There are two features on the daily chart that say to...
READ MORE
MEMBERS ONLY
Weekly Outlook: Important for NIFTY to Move Past the 10600-10750 Zones; May Remain Turbulent At Higher Levels
by Milan Vaishnav,
Founder and Technical Analyst, EquityResearch.asia and ChartWizard.ae
In ourprevious Weekly note, we forecasted that the markets would not make any major headway in the truncated week due to the holiday festivities. As expected, the NIFTY spent the week in a narrow range and showed no directional bias. The benchmark index ultimately went nowhere, ending the week on...
READ MORE
MEMBERS ONLY

The Intellectual Void
by Greg Morris,
Veteran Technical Analyst, Investor, and Author
I’m always trying to come up with new ideas for articles and don’t mind if I cross the line a little bit even if it offends a few – I just don’t want to offend everyone; certainly not all at once. This one is going to do just...
READ MORE
MEMBERS ONLY

ENERGY STOCKS FOLLOW CRUDE OIL LOWER -- RISING DOLLAR IS PUSHING COMMODITY PRICES LOWER -- DEFENSIVE SECTORS ARE STILL IN THE LEAD -- CYCLICALS RUN INTO RESISTANCE WHILE TECHOLOLOGY SECTOR WEAKENS
by John Murphy,
Chief Technical Analyst, StockCharts.com
CRUDE OIL ENTERS BEAR MARKET... Commodities as a group have been under a lot of selling pressure for several months. But the weakest part of that group over the past month has been energy. Chart 1 shows the price of WTIC Light Crude Oil (through yesterday) falling to the lowest...
READ MORE
MEMBERS ONLY

Several Indicators Point To A Test Of The October Lows
by Martin Pring,
President, Pring Research
* Indexes Reach Resistance and Retrace 61.8% of the Decline
* Hourly Charts Offer the First Domino
* Short-Term Breadth is Overstretched
* NASDAQ Sports a Series of Declining Peaks and Troughs
Indexes Reach Resistance and Retrace 61.8% of the Decline
The market has been on a tear for the last couple...
READ MORE
MEMBERS ONLY

Weekly Market Review & Outlook (with video) - When Trends Lose Consistency
by Arthur Hill,
Chief Technical Strategist, TrendInvestorPro.com
* Performance Overview.
* When Uptrends Lose Consistency.
* Only One Breadth Thrust.
* Not A Lot of Strong Uptrends.
* Majority of Stocks below 200-day EMA.
* S&P 500 Hits Moment-of-truth.
* On-Trend versus NOT On-Trend.
* Breakdowns Followed by Sharp Rebounds.
* This Week in Art's Charts.
* Notes from the Art's...
READ MORE
MEMBERS ONLY
S&P 500 Hesitates At Next Key Price Resistance
by Tom Bowley,
Chief Market Strategist, EarningsBeats.com
Market Recap for Thursday, November 8, 2018
Well, another Fed day has come and gone. The FOMC ended its two day meeting and left rates unchanged, as expected. It promised, however, further gradual increases. If you recall, the spike in the 10 year treasury yield ($TNX) to 3.25%, a...
READ MORE
MEMBERS ONLY
Very Bullish Sector Rotation Underscores Dow's 500 Point Gain
by Tom Bowley,
Chief Market Strategist, EarningsBeats.com
Market Recap for Wednesday, November 7, 2018
The Dow Jones surged 545 points, or 2.13%, yesterday and that index of conglomerates was a laggard. NASDAQ stocks exploded nearly 200 points higher, or 2.64%, to extend what's been a very impressive rally after October's massacre....
READ MORE