MEMBERS ONLY
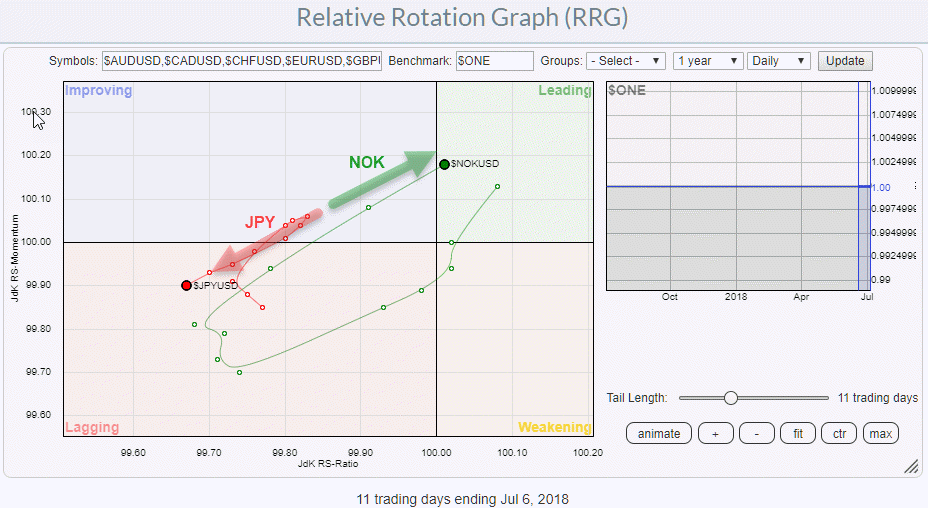
NOK/JPY, a FOREX pair trade from RRG

by Julius de Kempenaer,
Senior Technical Analyst, StockCharts.com
Relative Rotation Graphs are not only used to look at sector-rotation or help with asset allocation decisions but can also help you to pinpoint potential forex trades.
Most currency traders are short-term orientated so the RRG above is a daily chart showing the rotation of the Norwegian Krone and the...
READ MORE
MEMBERS ONLY
A Big Name Clothing & Accessories Company Provides Excellent Reward To Risk Opportunity

by Tom Bowley,
Chief Market Strategist, EarningsBeats.com
Market Recap for Friday, July 6, 2018
It was a solid close to the week on Friday, especially on the tech-laden NASDAQ where that index rose 101 points, or 1.34%. Biotechnology stocks ($DJUSBT, +3.74%) surged on news of positive trial results for Biogen's (BIIB, +19.63%...
READ MORE
MEMBERS ONLY

Fear and Greed

by Greg Morris,
Veteran Technical Analyst, Investor, and Author
I cannot tell you the number of times an investor has asked, “Considering the difficulties of the past few months, do you still believe in your investment process?” These questions always concerned me because I never once considered not believing in my process for managing money just because of short-term...
READ MORE
MEMBERS ONLY
It's hard to believe but some markets are (starting to) outperform(ing) the US...
by Julius de Kempenaer,
Senior Technical Analyst, StockCharts.com
This is an extended version of the recent RRG article in Chartwatchers "Checking out the land down under on a Relative Rotation Graph".
Even if your investment portfolio is tied to a specific country or region it makes sense to keep an eye on developments around your geographical...
READ MORE
MEMBERS ONLY
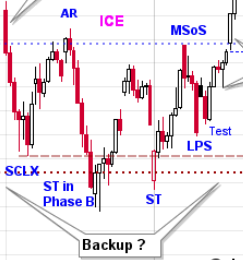
Wyckoff Intraday Workshop

by Bruce Fraser,
Industry-leading "Wyckoffian"
During my most recent guest appearance on MarketWatchers LIVE (7/5/18) I introduced a case study of intraday trading with the Wyckoff Method. Intraday trading is not every traders cup of tea, but even if you are not a short term trader there are benefits to studying the intraday...
READ MORE
MEMBERS ONLY
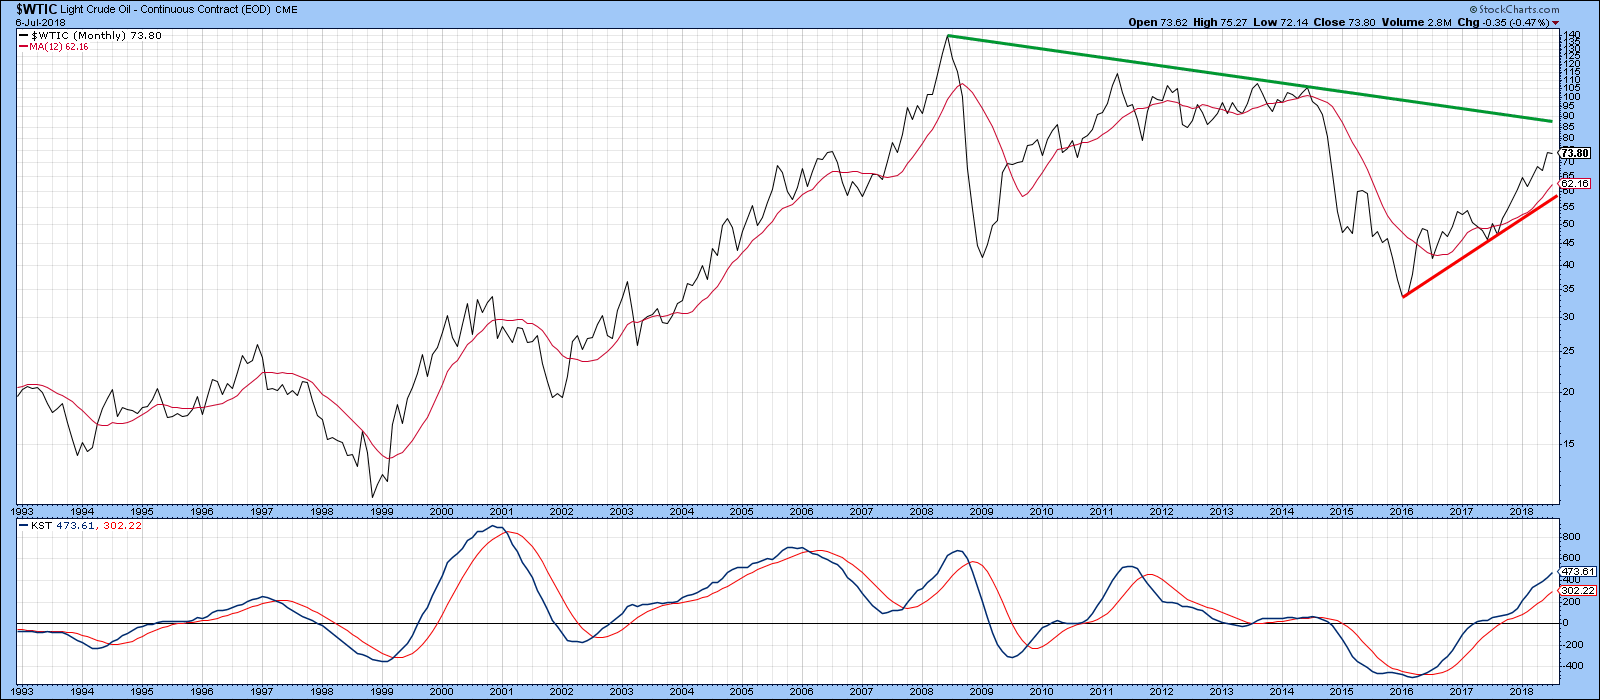
What Would It Take For The Charts To Signal A Top In Oil?

by Martin Pring,
President, Pring Research
* Technical picture is ripe for a turn, but the main trend is up right now
* Tuesday’s outside day could be the first domino
* Negative divergences between several energy components
Technical picture is ripe for a turn, but the main trend is up right now
The oil price remains in...
READ MORE
MEMBERS ONLY

STOCKS START SECOND HALF ON AN UP NOTE -- HEALTHCARE SPDR ACHIEVES BULLISH BREAKOUT -- BIOGEN LEADS BIOTECH RALLY -- BUT A LOT OF OTHER BIOTECHS ARE RISING AS WELL -- PHARMACEUTICAL ISHARES ALSO BREAK OUT -- MERCK, ELI LILLY, AND PFIZER LEAD DRUG RALLY

by John Murphy,
Chief Technical Analyst, StockCharts.com
STOCKS START SECOND HALF ON A STRONG NOTE ... After a shaky month of June, stocks started the second half of the year on a positive note. And moving average lines continue to play an important role in that stronger start. Chart 1 shows the Dow Industrials ending the week on...
READ MORE
MEMBERS ONLY
The Trading Strategy That Makes Money
by Tom Bowley,
Chief Market Strategist, EarningsBeats.com
Let's first talk about a trading strategy that doesn't work.
I steer clear of companies that struggle to meet Wall Street expectations and there's a very simple reason why. Management helps Wall Street set their expectations. So when companies miss their targets, it'...
READ MORE
MEMBERS ONLY
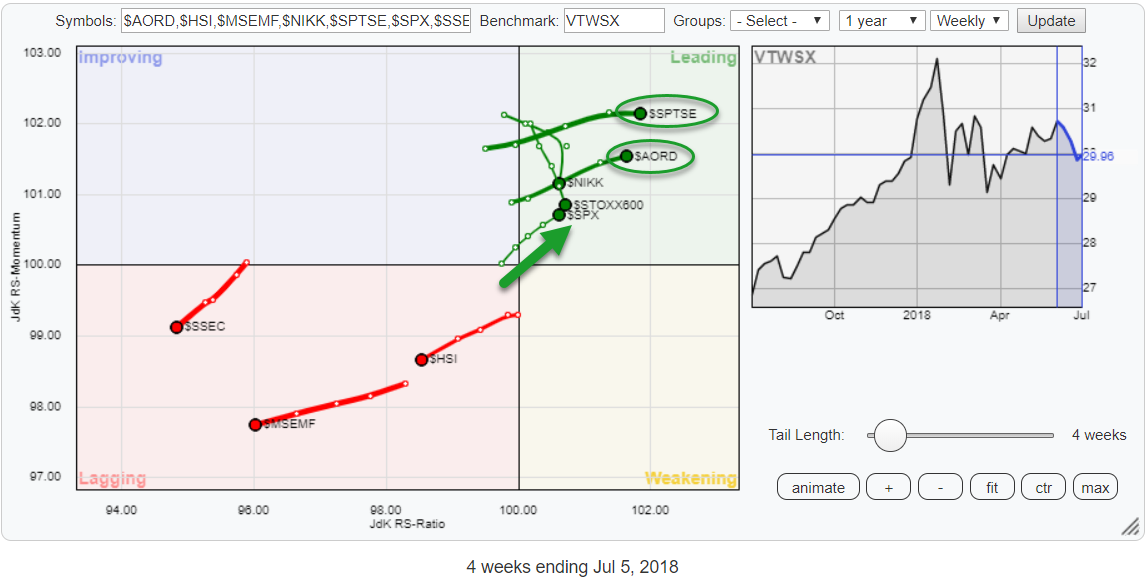
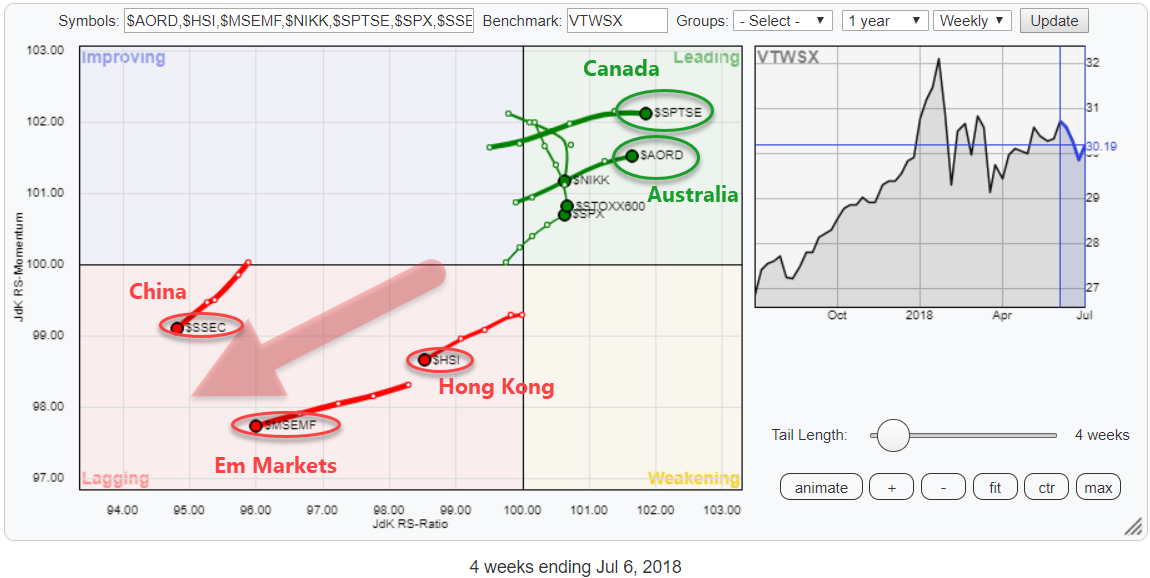
Checking out the land down under on a Relative Rotation Graph
by Julius de Kempenaer,
Senior Technical Analyst, StockCharts.com
On the Relative Rotation Graph above I have grouped a selection of world equity market indices, mainly some big regions, and put them against the Vanguard Total World Stock Index (VTWSX) as the benchmark.
What immediately grabs our attention, or at least mine is the fact that this selection is...
READ MORE
MEMBERS ONLY
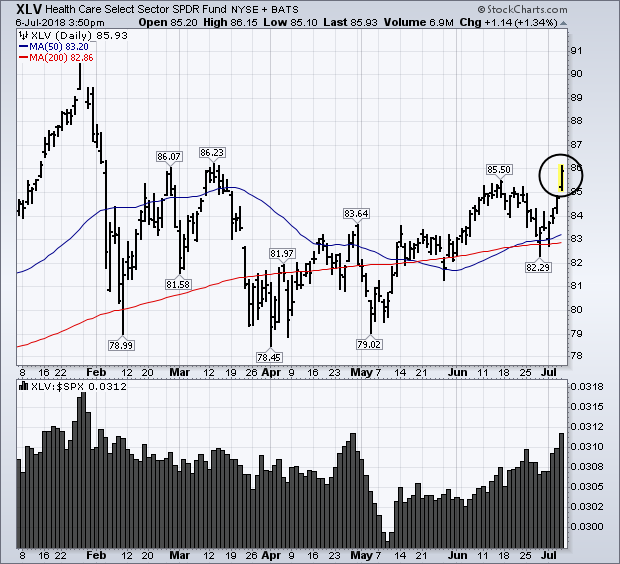
Health Care SPDR Achieves Bullish Breakout
by John Murphy,
Chief Technical Analyst, StockCharts.com
On a day when stocks are rising, and all eleven market sectors are in the black, healthcare is the standout performer. This chart shows the Health Care SPDR (XLV) rising to the highest level since the middle of March. The bottom box shows the XLV/SPX ratio rising to the...
READ MORE
MEMBERS ONLY
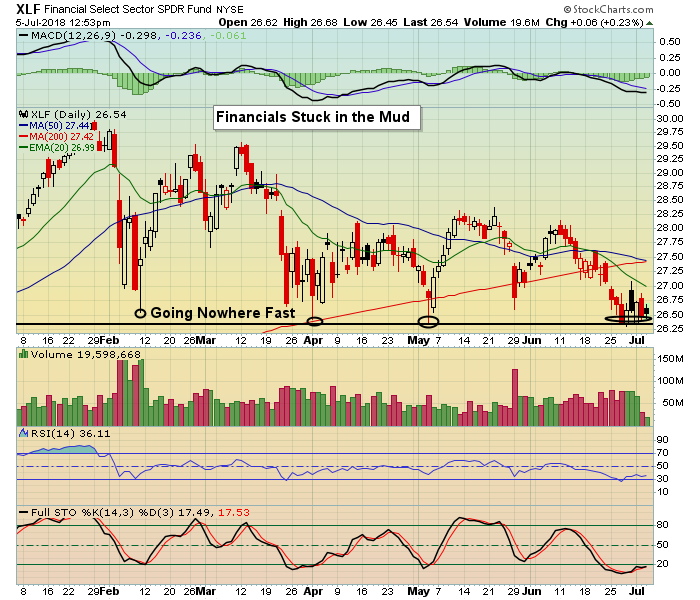
Profiting from Earnings Reports

by John Hopkins,
President and Co-founder, EarningsBeats.com
The market has been in stall mode for quite some time now. Even though the S&P perked up some on Friday it's still hanging out near levels seen in early January, going nowhere fast.At the same time the market has had all kinds of reasons...
READ MORE
MEMBERS ONLY
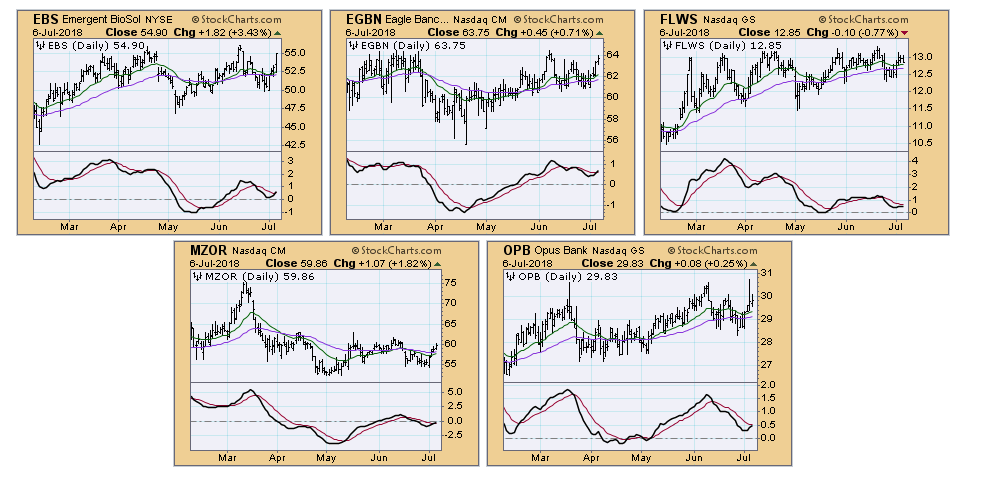
Finding Chart Breakouts with Momentum

by Erin Swenlin,
Vice President, DecisionPoint.com
I've presented my favorite PMO scan numerous times during the MarketWatchers LIVE show, but also in articles. Here's a link to my article on that scan. However today I wanted to present my "Chart Breakouts" scan. I use this scan during the MarketWatchers LIVE...
READ MORE
MEMBERS ONLY
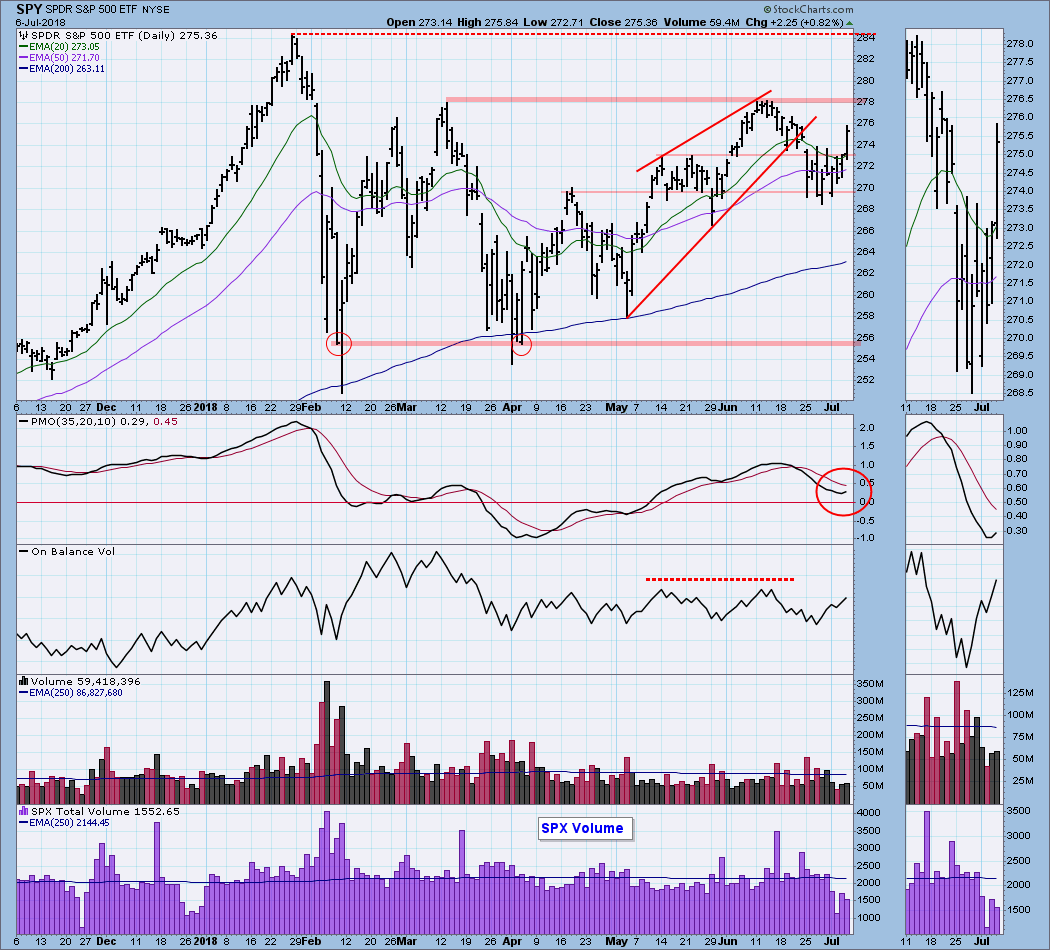
DP Weekly Wrap: SPY Short-Term BUY Signal

by Carl Swenlin,
President and Founder, DecisionPoint.com
Wedges are a favorite of mine because they are so reliable. For example, there is a high probability that rising wedge formations will resolve downward, so it is usually best to wait for this resolution and the aftermath before going long. Two weeks ago SPY broke down from a rising...
READ MORE
MEMBERS ONLY

HEALTH CARE SPDR ACHIEVES BULLISH BREAKOUT -- BIOTECH ISHARES REACH HIGHEST LEVEL IN SIX MONTHS -- STOCKS END WEEK ON STRONG NOTE WITH ALL ELEVEN SECTORS GAINING GROUND
by John Murphy,
Chief Technical Analyst, StockCharts.com
HEALTHCARE SPDR ACHIEVES BULLISH BREAKOUT... On a day when stocks are rising, and all eleven market sectors are in the black, healthcare is the standout performer. Chart 1 shows the Health Care SPDR (XLV) rising to the highest level since the middle of March. The bottom box shows the XLV/...
READ MORE
MEMBERS ONLY
This NASDAQ 100 Giant Flashed BUY Yesterday; History Confirms It
by Tom Bowley,
Chief Market Strategist, EarningsBeats.com
Market Recap for Thursday, July 5, 2018
U.S. equities rallied on Thursday, led by the NASDAQ and Russell 2000, which gained 1.12% and 1.15%, respectively. The Dow Jones and S&P 500 tacked on lesser gains. Technology (XLK, +1.41%), consumer staples (XLP, +1.38%) and...
READ MORE
MEMBERS ONLY
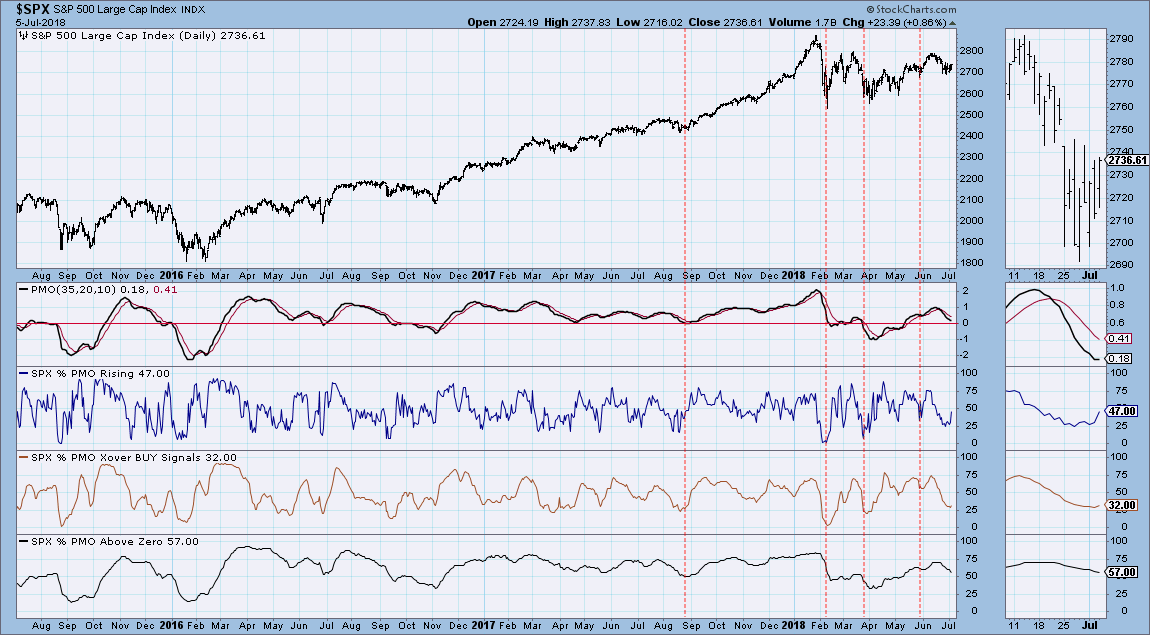
Momentum is on the Rise for Large-Cap Index Components
by Erin Swenlin,
Vice President, DecisionPoint.com
Although we haven't quite seen any changes on the DP Scoreboards in the "momentum" category, detailed analysis of the PMO in all three timeframes shows signs that components of these indexes are gaining positive momentum.
The PMO Analysis charts below are in the DecisionPoint Market Indicator...
READ MORE
MEMBERS ONLY

THE DOW ENDS JUST ABOVE ITS 200-DAY AVERAGE -- WHILE THE S&P 500 REGAINS ITS 50-DAY LINE -- THE RUSSELL 2000 AND NASDAQ 100 LEAD MARKET HIGHER -- SEMICONDUCTOR ISHARES BOUNCE OFF THEIR 200-DAY AVERAGE TO LEAD TECH SECTOR HIGHER
by John Murphy,
Chief Technical Analyst, StockCharts.com
MOVING AVERAGE LINES ARE STILL HOLDING... Major stock index continue to find support around moving average lines. Chart 1 shows the Dow Industrials rising 181 points (+0.75%) to close at 24356. That was enough to put it just above its 200-day moving average. Other stock indexes did even better....
READ MORE
MEMBERS ONLY
Is It Time For A Rally In The Worst Industry Group In 2018?
by Tom Bowley,
Chief Market Strategist, EarningsBeats.com
Market Recap for Tuesday, July 3, 2018
U.S. equities started the holiday-abbreviated trading session on Tuesday quite nicely with gains across each of our major indices. But that strength deteriorated throughout the day and, by the close, all but the small cap Russell 2000 had finished in negative territory....
READ MORE
MEMBERS ONLY
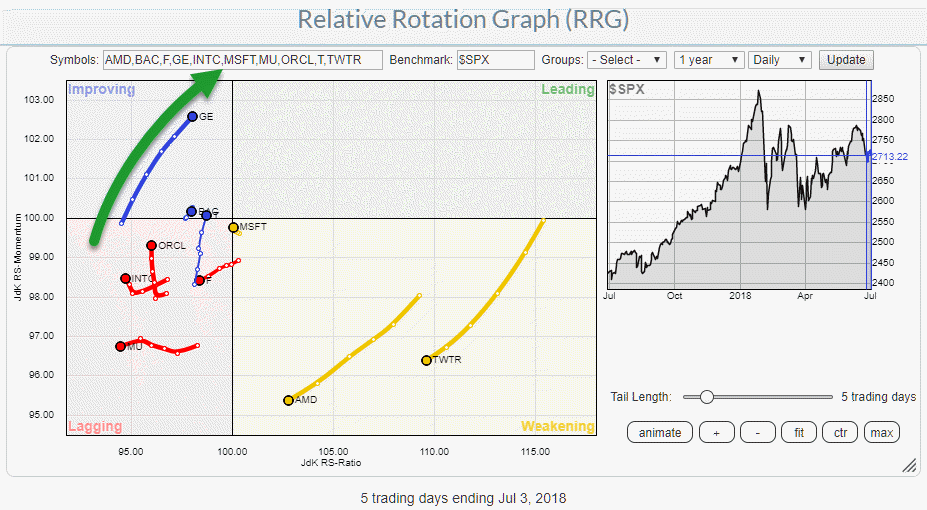
I just picked GE from the Relative Rotation Graph of most active stocks in the S&P 500
by Julius de Kempenaer,
Senior Technical Analyst, StockCharts.com
A good start of the day, at least for me is to go to the StockCharts.com dashboard and look at the Top 10, most active, market movers, in the S&P 500 index. The table gives a quick idea of what has happened the previous day.
From there...
READ MORE
MEMBERS ONLY

Wider Implications For A Sick Looking Dr. Copper?
by Martin Pring,
President, Pring Research
* Copper signals a primary bear market
* Copper’s influence on commodities in general
* Copper and bond yields
It’s often said that Copper has a PHD in economics because it is used widely in many economic sectors. As a result, long-term reversals in its price trend often foreshadow general swings...
READ MORE
MEMBERS ONLY
Are Biotechs Poised To Surge? If So, Consider This Giant
by Tom Bowley,
Chief Market Strategist, EarningsBeats.com
Market Recap for Monday, July 2, 2018
A brief recap from yesterday:
All of our major indices climbed higher with renewed leadership from the NASDAQ and Russell 2000. Technology (XLK, +0.89%) and utilities (XLU, +0.71%) led the action, while energy (XLE, -1.47%) was very weak. Given the...
READ MORE
MEMBERS ONLY

Markets do Trend!
by Greg Morris,
Veteran Technical Analyst, Investor, and Author
For the last couple of decades, I have classified myself as a trend follower. Mind you, this is not market timing. Market timing involves guessing at tops and bottoms. A trend follower will NEVER get in at the bottom or out at the top. It depends on how quickly his/...
READ MORE
MEMBERS ONLY
July Market Round Up With Martin Pring 2018-07-01
by Martin Pring,
President, Pring Research
Here is the link to my current thoughts about the global markets.
Good luck and good charting,
Martin J. Pring
The views expressed in this article are those of the author and do not necessarily reflect the position or opinion of Pring Turner Capital Group of Walnut Creek or its...
READ MORE
MEMBERS ONLY
Watch Potential Channel Support On The NASDAQ 100
by Tom Bowley,
Chief Market Strategist, EarningsBeats.com
Market Recap for Friday, June 29, 2018
The first half of 2018 ended on Friday in bifurcated fashion, which is fitting given that most of 2018 has seen bifurcated action thus far. The NASDAQ gained nearly 9% in the first six months, with the Russell 2000 not too far behind,...
READ MORE
MEMBERS ONLY
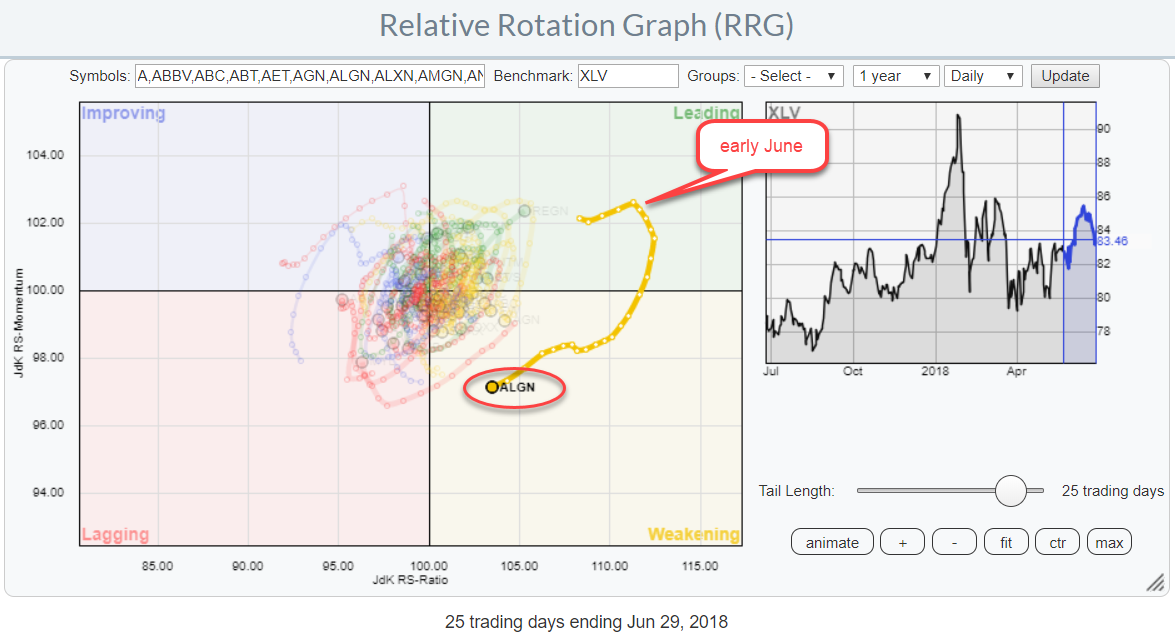
Wide rotation for ALGN on RRG
by Julius de Kempenaer,
Senior Technical Analyst, StockCharts.com
This (DAILY) Relative Rotation Graph shows the rotation of the Health Care stocks against their XLV benchmark.
One stock really stands out because of its wide rotation.
ALGN crossed over into the leading quadrant, from improving, last May and sharply moved higher on the price chart since then while building...
READ MORE
MEMBERS ONLY

A Mid-Year Look at FANG Stocks
by Bruce Fraser,
Industry-leading "Wyckoffian"
Remember to tune in this coming Thursday, July 5th, when I will be a guest on MarketWatchers Live. I recently promised to drill down into intraday charting using the Wyckoff Method. The Wyckoff technique works very well on smaller timeframes and it is fun to do. On Thursday I will...
READ MORE
MEMBERS ONLY

STOCKS GAINED GROUND DURING SECOND QUARTER -- SECTOR LEADERS WERE ENERGY, TECHNOLOGY, REITS, AND UTILITIES -- INDUSTRIALS AND FINANCIALS WERE THE WEAKEST -- FINANCIALS REMAIN IN DOWNTREND -- BANKS ETFS REMAIN UNDER PRESSURE
by John Murphy,
Chief Technical Analyst, StockCharts.com
DOW AND S&P 500 GIVE UP SOME OF FRIDAY'S GAINS... First a quick update on Friday's price action. The Dow and S&P 500 gave up some of their gains on Friday afternoon. The Dow gained 55 points (+0.23%) but ended slightly...
READ MORE
MEMBERS ONLY
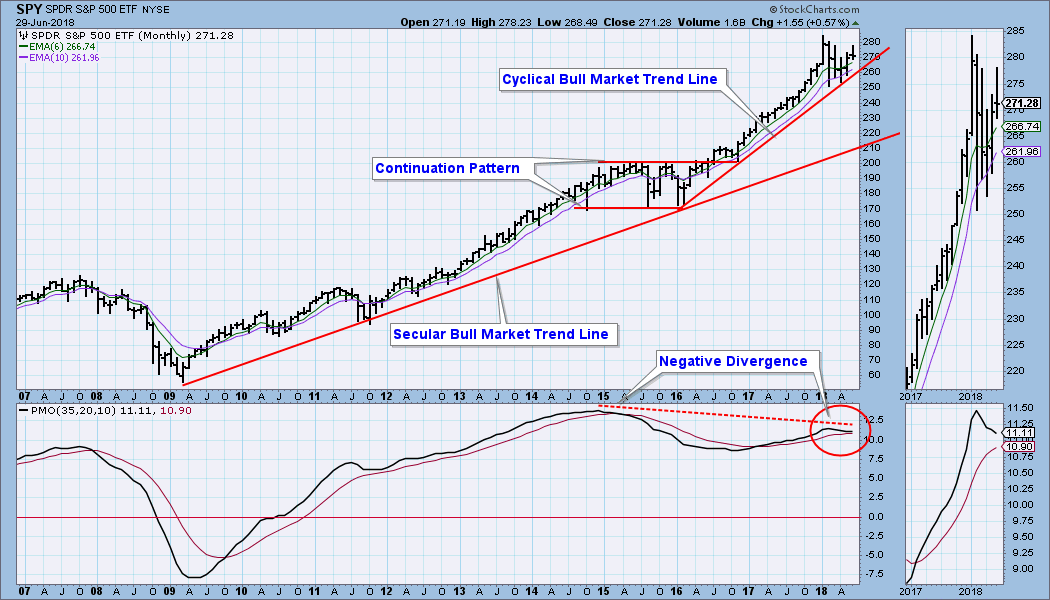
DP Weekly Wrap: Monthly Charts Finalized
by Carl Swenlin,
President and Founder, DecisionPoint.com
Monthly charts were finalized on Friday, so we can get an up-to-date assessment of the very long-term. On the SPY monthly chart below, note that the cyclical bull market up trend has taken price on a very wide departure from the secular bull market rising trend line. The monthly PMO...
READ MORE
MEMBERS ONLY

STOCKS ARE OFF TO A STRONG START -- THE DOW AND S&P 500 REGAIN MOVING AVERAGE LINES -- THE NASDAQ HOLDS 50-DAY LINE -- ENERGY, FINANCIALS, MATERIALS, AND INDUSTRIALS LEAD THE MARKET HIGHER -- CHINA LEADS REBOUND IN EMERGING MARKETS
by John Murphy,
Chief Technical Analyst, StockCharts.com
DOW REGAINS ITS 200-DAY MOVING AVERAGE... Stocks are off to a strong start today. Wednesday's late selloff pushed the Dow below its 200-day average. Chart 1, however, shows the Dow Industrials regaining that long-term support line this morning. Chart 2 shows the S&P 500 regaining its...
READ MORE
MEMBERS ONLY
Technology And Financials Lead End Of Month Rebound
by Tom Bowley,
Chief Market Strategist, EarningsBeats.com
Market Recap for Thursday, June 28, 2018
The selling episode went according to plan, with many higher risk areas taking on most of the bears' wrath. The three worst performing sectors over the past week led the rebound on Thursday. Technology (XLK, +1.22%), financials (XLF, +0.87%) and...
READ MORE
MEMBERS ONLY

Weekly Market Review and Outlook - How Bad is It?

by Arthur Hill,
Chief Technical Strategist, TrendInvestorPro.com
* June Swoon Looks Pretty Tame.
* Programming Note: Up Coming Vacation.
* High-Low Lines Still Rising.
* S&P 500 Sets up First Test.
* Short-term Oversold in Long-term Uptrend.
* XLF and XLI Toy with Support.
* Three Tech ETFs Become Oversold.
* Notes from the Art's Charts ChartList.
...There are plenty of...
READ MORE
MEMBERS ONLY
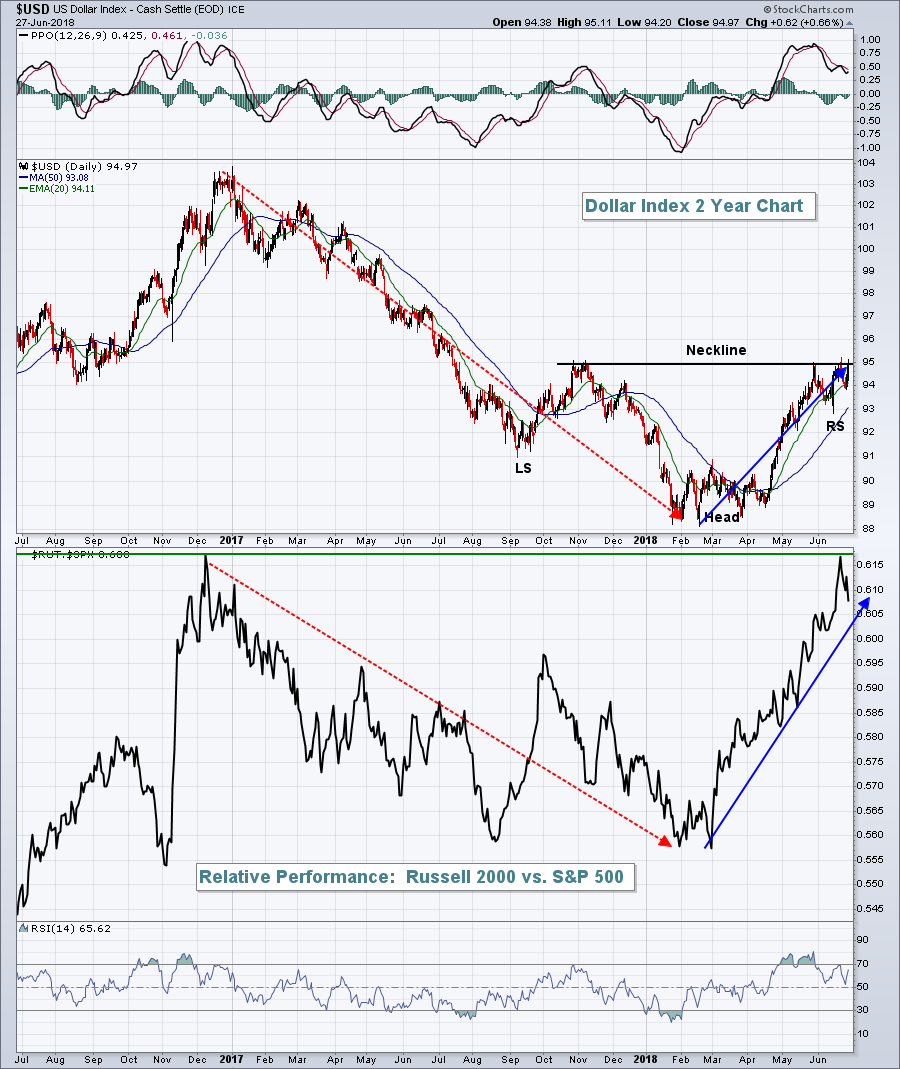
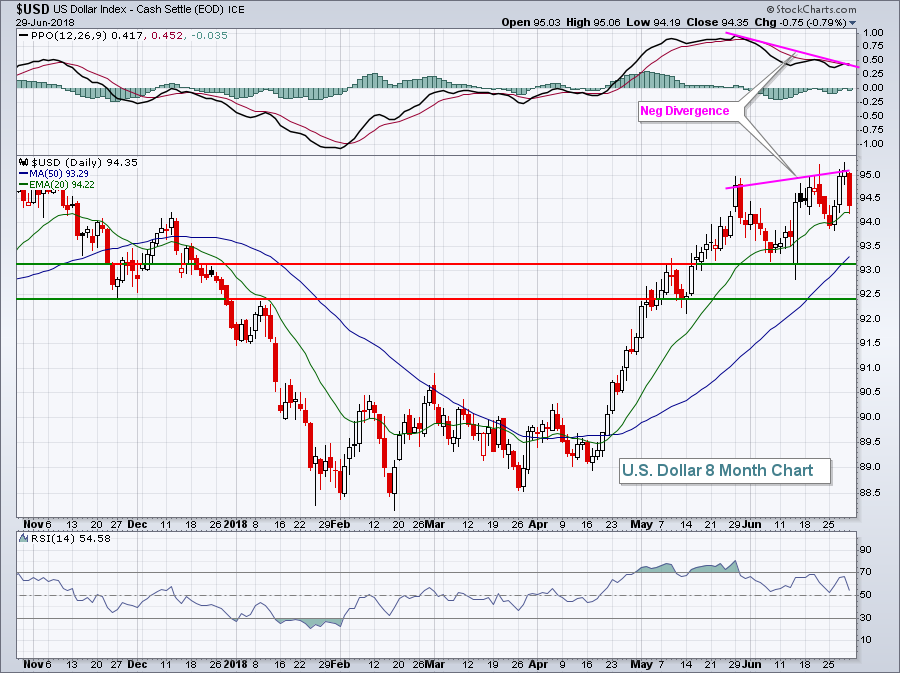
Dollar Breakout Good News For Small Caps, But Rising Volatility Weighs
by Tom Bowley,
Chief Market Strategist, EarningsBeats.com
Market Recap for Wednesday, June 27, 2018
Trade war fears are dominating the headlines, but U.S. Dollar Index ($USD) strength is quietly making the biggest news of all. The rising greenback is potentially good news as it signals that the U.S. economy is humming along, and is perhaps...
READ MORE
MEMBERS ONLY

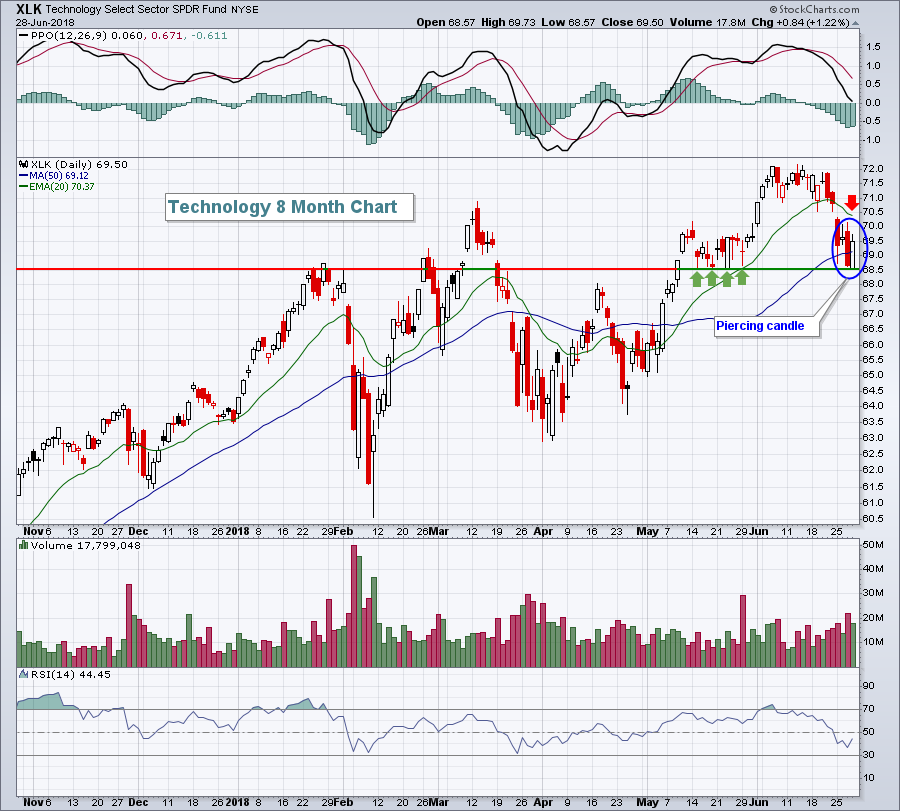
Mind the Gap in XLK - Falling Yields Weigh on Banks, Boost Utes
by Arthur Hill,
Chief Technical Strategist, TrendInvestorPro.com
* Mind the Gap in XLK.
* Offensive Sectors Lead the Correction.
* Bonds Continue to Rise.
* Banks, Utes and the 10-year Yield.
* Yuan Breaks Support.
... Mind the Gap in XLK
... The Technology SPDR (XLK) hit a new high and then gapped down for the third time this year. The red annotations show...
READ MORE
MEMBERS ONLY
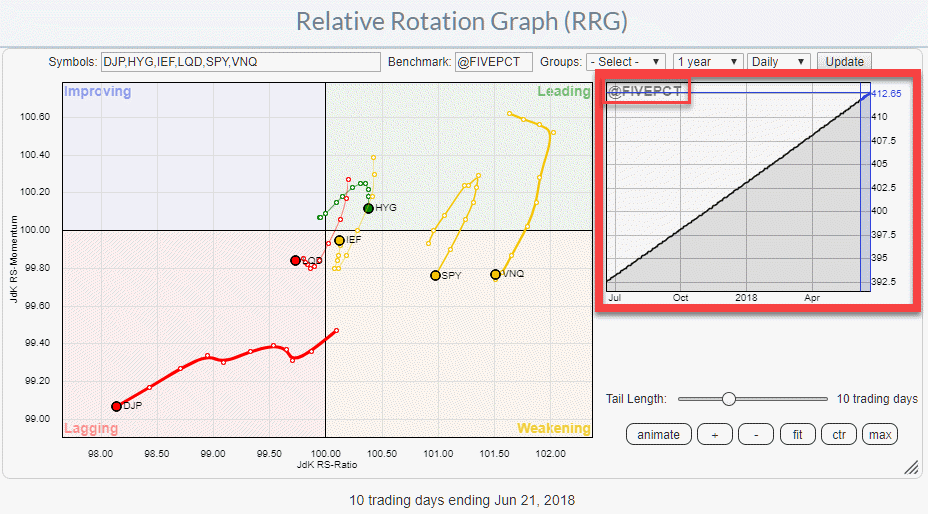
Special benchmarks for Relative Rotation Graphs
by Julius de Kempenaer,
Senior Technical Analyst, StockCharts.com
Last week Thursday (6/21) was the third Thursday (try saying that out loud ;) ) of the month. The day that I join Tom and Erin in the Market Watchers Live show to talk about Relative Rotation Graphs.
In the show, which you can play back here, I talked about different...
READ MORE
MEMBERS ONLY

DP Alert: Dow and Materials (XLB) Log ITTM Neutral - Dollar & Oil Killing It!
by Erin Swenlin,
Vice President, DecisionPoint.com
Another day of decline after a head fake at the open when prices gapped up and rallied. The Nasdaq and Russell 2000 never caught a break as they began their decline right out of the gate. These two indexes have shown great relative strength, but are now taking it on...
READ MORE
MEMBERS ONLY

EARLY RALLY FADES AS STOCKS SUFFER DOWNSIDE REVERSAL DAY -- THE DOW AND S&P 500 CLOSE BELOW MOVING AVERAGE LINES -- THE NASDAQ FOLLOWS TECHNOLOGY STOCKS LOWER -- ENERGY SHARES FOLLOWED CRUDE OIL HIGHER -- UTILITIES RALLIED WITH BONDS AS YIELDS DROPPED
by John Murphy,
Chief Technical Analyst, StockCharts.com
DOWNSIDE REVERSAL DAY ENDS RALLY ATTEMPT ... This morning's market rebound didn't last for long. By day's end the market had suffered a downside reversal day. And some support levels were broken. Chart 1 shows the Dow Industrials falling 165 points (-.68%) and ending...
READ MORE
MEMBERS ONLY

Global and US Equity Markets On A Knife Edge
by Martin Pring,
President, Pring Research
* The US on a knife edge
* Global markets are also on the edge
* Individual regions largely around key support
Last week I wrote about the important upside breakout in the US market vis a vis the rest-of-the-world, and a previous article pointed out that the S&P had also...
READ MORE
MEMBERS ONLY

OVERSOLD DOW BOUNCES OFF 200-DAY AVERAGE -- INDUSTRIALS AND MATERIALS ARE ALSO GAINING -- CRUDE OIL NEARS ANOTHER YEARLY HIGH -- THAT'S MAKING ENERGY THE DAY'S STRONGEST SECTOR
by John Murphy,
Chief Technical Analyst, StockCharts.com
THE DOW IS LEADING TODAY'S RALLY ... After weighing on the rest of the market all month, the Dow is leading today's rebound. And it couldn't come at a better time. Chart 1 shows the Dow Industrials bouncing off chart support near their late-May low...
READ MORE
MEMBERS ONLY
Weakness In Railroads Setting Up Trading Opportunities
by Tom Bowley,
Chief Market Strategist, EarningsBeats.com
Market Recap for Tuesday, June 26, 2018
Tepid gains on Wall Street allowed trade fears to subside for a day, but technical indications suggest this is likely just a temporary breather. The Dow Jones gained 30 points on the session, while the small cap Russell 2000 and tech-laden NASDAQ produced...
READ MORE
MEMBERS ONLY

Oil & Gas Equip & Services SPDR hits Reversal Zone, but Lags Oil
by Arthur Hill,
Chief Technical Strategist, TrendInvestorPro.com
The Oil & Gas Equip & Services SPDR (XES) is trading near a potential reversal zone, but the ETF is not keeping pace with strength in oil.
The first chart shows XES, the Light Crude Continuous Contract ($WTIC) and the Correlation Coefficient for the two. XES bounced between 13 and...
READ MORE