MEMBERS ONLY

MORTGAGE RATES HIT A SEVEN-YEAR HIGH ALONG WITH TEN-YEAR TREASURY YIELD -- RISING MORTGAGE RATES MAY BE CONTRIBUTING TO SELLING OF HOMEBUILDING STOCKS -- A RECORD HIGH IN THE PRICE OF LUMBER ALSO RAISES THE COSTS OF BUILDING A NEW HOUSE

by John Murphy,
Chief Technical Analyst, StockCharts.com
RISING MORTGAGE RATES ARE WEIGHING ON HOMEBUILDERS ... The first page of today's Wall Street Journal carries the headline: "Era of Ultracheap Mortgages Ends as Rates Hit 7-Year HIgh". The article goes on to point out that rising mortgage rates might make it harder for prospective home...
READ MORE
MEMBERS ONLY

Small-caps Lead, but Mid-caps and Large-caps Lack Leadership

by Arthur Hill,
Chief Technical Strategist, TrendInvestorPro.com
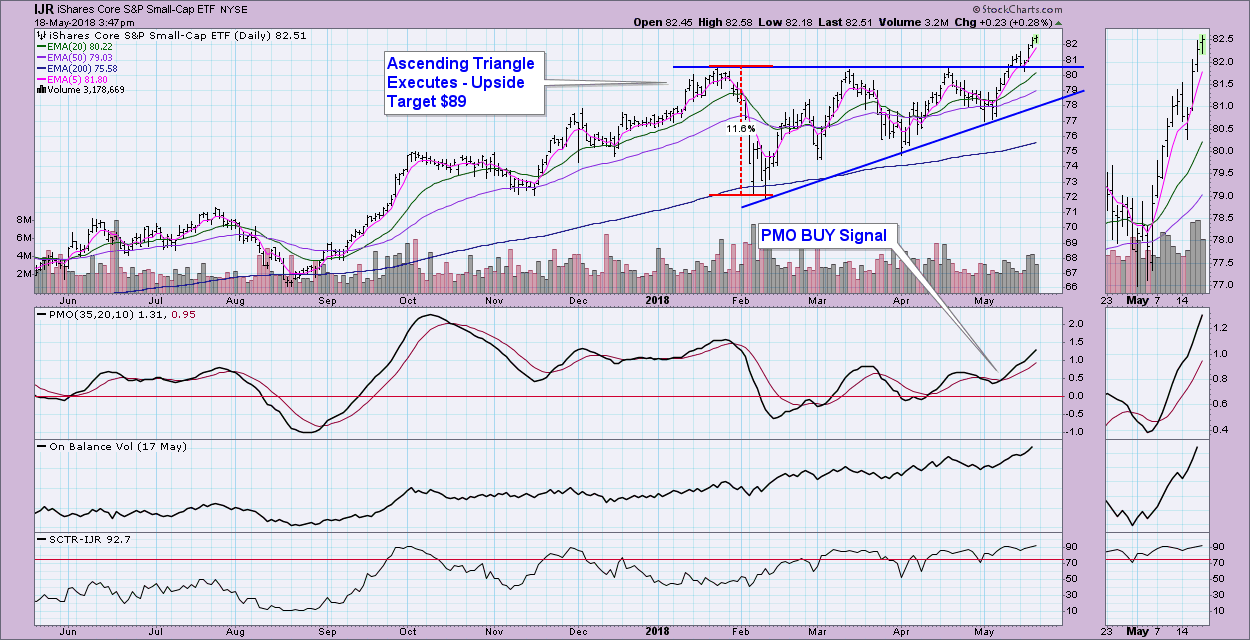
Stocks recording new 52-week highs are the leaders and a key component to broad market strength. Small-caps are doing their part with plenty of new highs, but large-caps and mid-caps are lagging in this category.
The S&P Small-Cap 600 moved to a new 52-week high this week and...
READ MORE
MEMBERS ONLY
DP Weekly Wrap: Bullish Flag Forming

by Carl Swenlin,
President and Founder, DecisionPoint.com
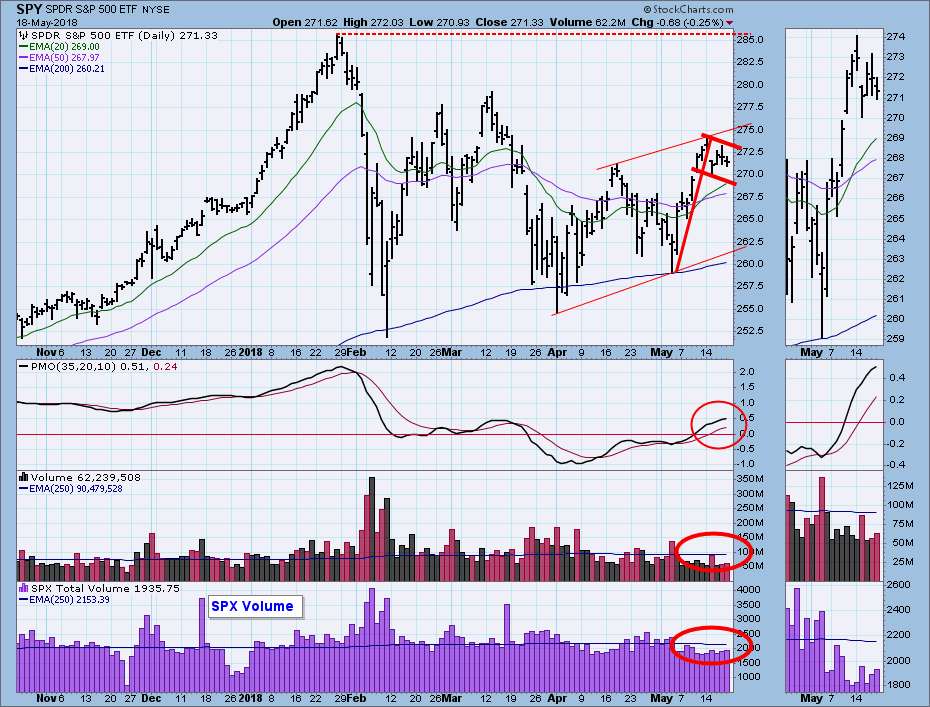
Back in the day, options expiration days were characterized by high volatility and exceptionally high volume; however, in recent years the market stays relatively calm, and the high volume only appears at the end of each quarter. These expectations were not disappointed in today's trading. In fact, the...
READ MORE
MEMBERS ONLY

Steady As She Goes: Several Indicators Say The Market Is Headed Higher

by Martin Pring,
President, Pring Research
Volume is offering a mixed picture
Last week I pointed out that several short-term indicators, including breadth and net new high indicators, were still pointing north. One area that was not showing any strength of note was volume, in the form of the PVO for the NYSE. Chart 1 shows...
READ MORE
MEMBERS ONLY
Small-Caps Leading the Way - Indicators for $SML Bullish

by Erin Swenlin,
Vice President, DecisionPoint.com
Small-cap stocks and indexes are quite healthy, far more than the large-cap indexes which are lagging behind. During today's MarketWatchers LIVE show and in my Wednesday "DP Alert" blog article, I discussed the SPX's short-term bearish indicators contrasted with the now bullish short-term indicators...
READ MORE
MEMBERS ONLY

Teach Your Young Investors! Here's How And Why You'll Both Benefit

by Gatis Roze,
Author, "Tensile Trading"
This is personal. I’ve spent a lifetime learning how to make consistent profits in the investing arena. Yes, the stock markets have been good to me. They’ve allowed me to stay healthy by learning to manage my stress and they’ve also allowed me to enjoy an extremely...
READ MORE
MEMBERS ONLY

Weekly Market Review & Outlook - New Sector and Industry Group Leaders
by Arthur Hill,
Chief Technical Strategist, TrendInvestorPro.com
* The Mother of all Double Bottoms.
* The Shifting Relationship between Stocks and Bonds.
* S&P SmallCap iShares Hit New High.
* Small-caps Lead Breadth Indicators.
* S&P 500 Pauses Near Breakout Zone.
* Materials and Industrials Show Upside Leadership.
* XLI and XLB Bid to End 2018 Corrections.
* XLF Forms High...
READ MORE
MEMBERS ONLY
Energy Has All Guns Blazing, Leads Bifurcated Market

by Tom Bowley,
Chief Market Strategist, EarningsBeats.com
Market Recap for Thursday, May 17, 2018
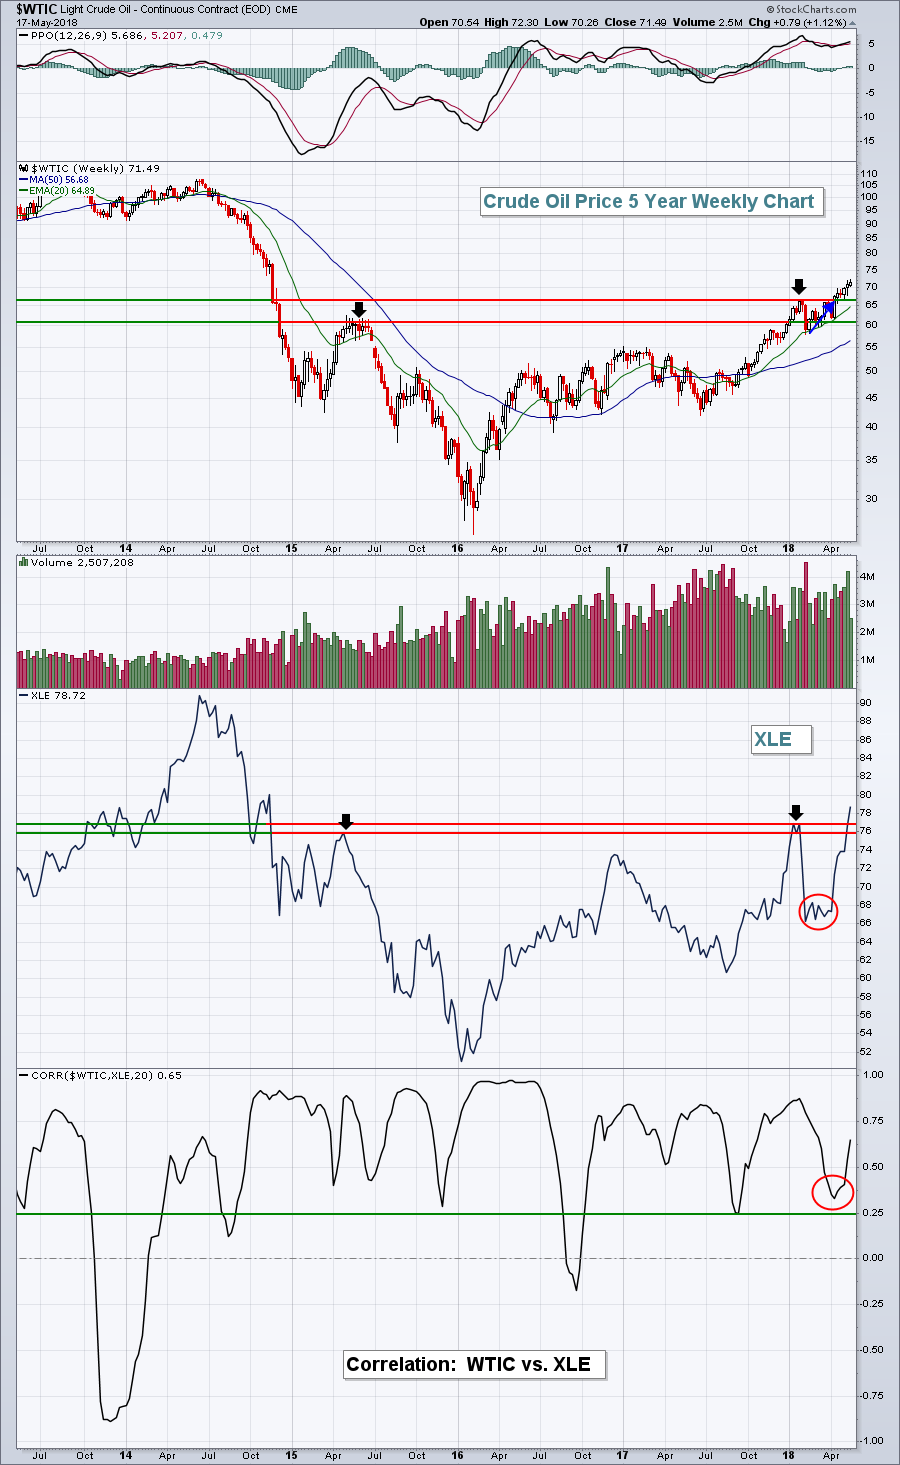
There's a new sheriff on Wall Street and it's the energy ETF (XLE, +1.51%). Its SCTR has soared to 97.1 with the second best SCTR (XLK - technology ETF) at 86.8. The distance between the two...
READ MORE
MEMBERS ONLY
Beat the Energy sector by avoiding XOM & CVX

by Julius de Kempenaer,
Senior Technical Analyst, StockCharts.com
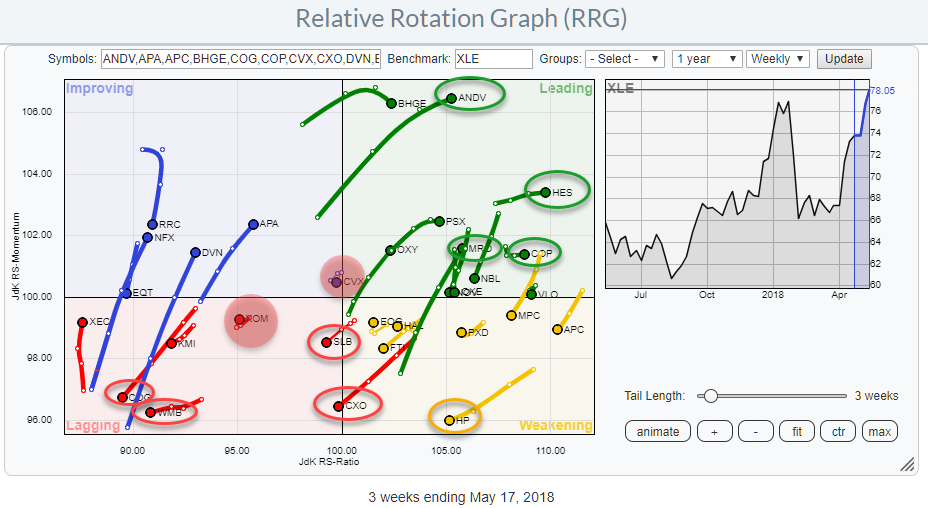
In the previous RRG blog, I introduced the availability of pre-populated groups holding individual equities for each of the ten S&P sectors. This addition makes it much easier for users of the Relative Rotation Graph tool on Stockcharts.com to drill down to the individual equity level from...
READ MORE
MEMBERS ONLY
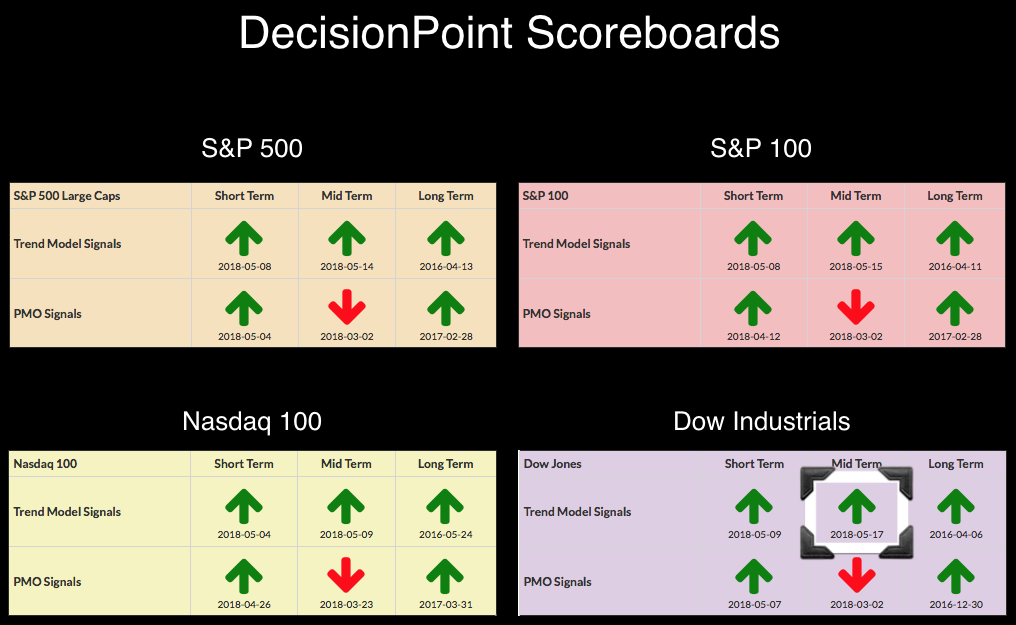
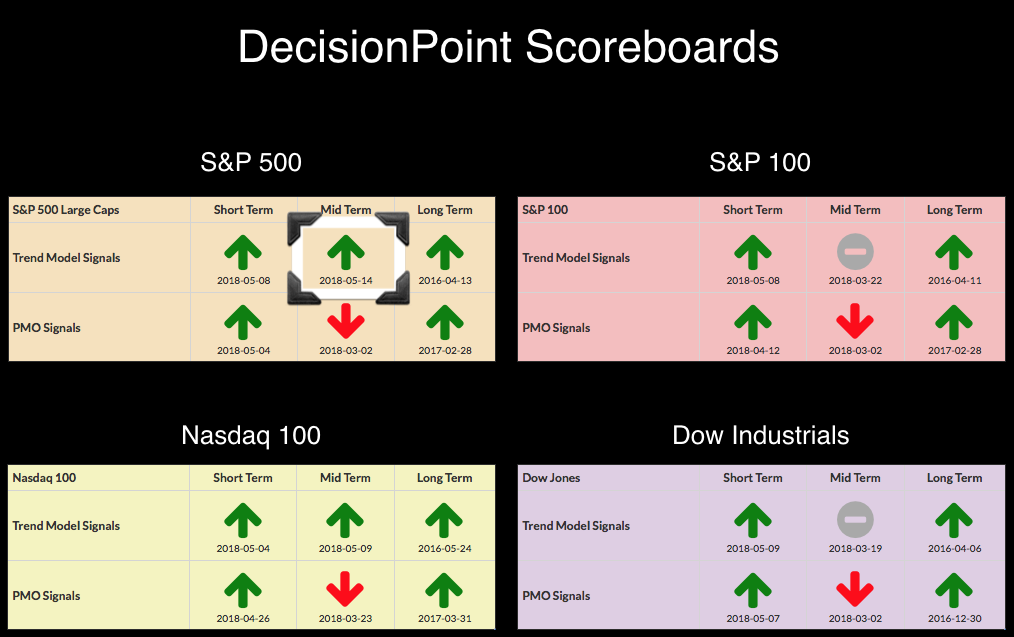
DP Bulletin #3: Trend Models on BUY Signals in All Timeframes as Dow Triggers ITTM BUY
by Erin Swenlin,
Vice President, DecisionPoint.com
The Dow was the laggard but it finally managed an Intermediate-Term Trend Model BUY signal today when the 20-EMA crossed above the 50-EMA. This moves all four Scoreboards' Trend Models to BUY signals in the short-, intermediate- and long-terms. The last time all three timeframes were all on Trend...
READ MORE
MEMBERS ONLY
Correlation Suggests This Financial Group Is About To Explode Higher, Get In Early
by Tom Bowley,
Chief Market Strategist, EarningsBeats.com
Market Recap for Wednesday, May 16, 2018
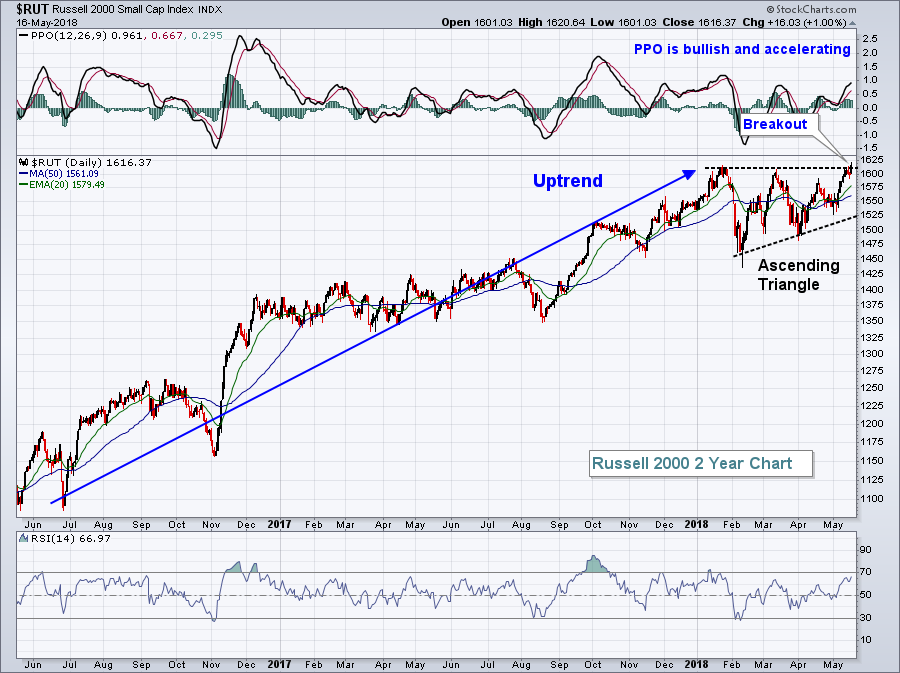
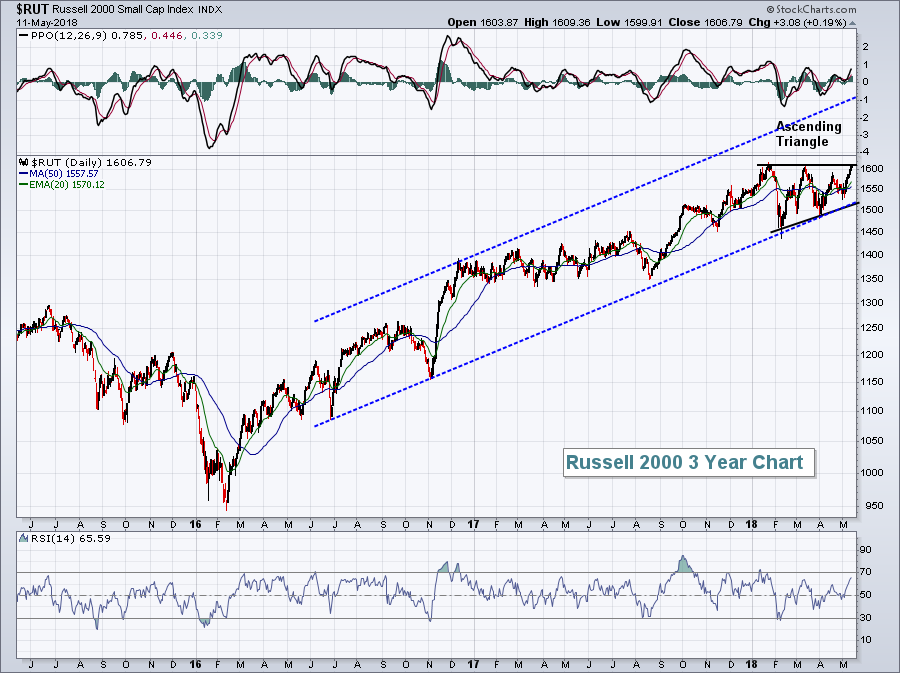
We saw another advance on Wall Street on Wednesday as key indices continue to clear important hurdles. Perhaps the most significant yesterday was the Russell 2000, which ended its bullish continuation pattern as expected - with a bullish breakout to the upside:
It&...
READ MORE
MEMBERS ONLY

Metals, Mining and Steel Lead in May - Plus Copper, COPX and 4 Stocks
by Arthur Hill,
Chief Technical Strategist, TrendInvestorPro.com
* Materials Sector Leads in May.
* Metals & Mining SPDR Breaks Out of Consolidation.
* Steel Dynamics, Allegheny and Reliant Lead Group.
* The Long Correction in Copper.
* Copper Miners ETF Challenges Resistance.
* Continuous Commodity Contracts are Mixed.
* Stocks to Watch: ADSK, CA, HPE, HCA.
The EW Technology ETF, EW Industrials ETF and...
READ MORE
MEMBERS ONLY

DP Alert: Short-Term Weakness Should Clear Soon - $90/Barrel Not Out of the Questiorm
by Erin Swenlin,
Vice President, DecisionPoint.com
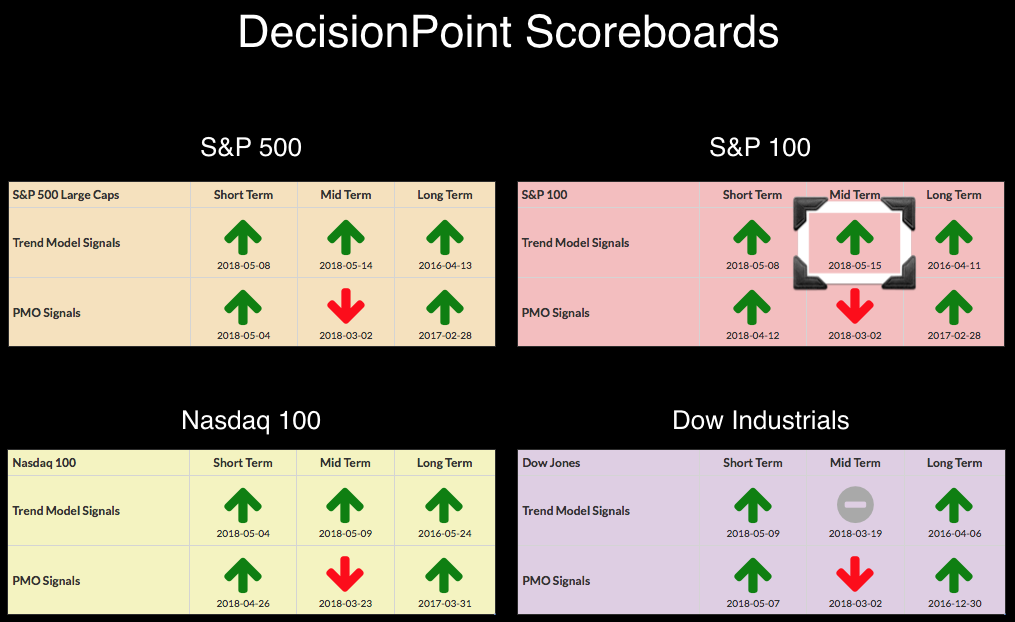
There still may be some growing pains to endure, but seeing Intermediate-Term Trend Model BUY signals beginning to populate the DP Scoreboards for the first time since March. The Dow should be joining the ITTM BUY signal party very soon. I was surprised it didn't trigger today, but...
READ MORE
MEMBERS ONLY

RETAIL SPDR JUMPS TO A FOUR-MONTH HIGH AND HAS BECOME A NEW MARKET LEADER -- RETAIL LEADERS INCLUDE MACYS, UNDER ARMOUR, AND NIKE -- RISING BOND YIELDS BOOST THE DOLLAR WHICH HELPS SMALL CAP STOCKS -- RUSSELL 2000 HITS A NEW RECORD
by John Murphy,
Chief Technical Analyst, StockCharts.com
S&P RETAIL SPDR GOES FROM LAGGARD TO LEADER... A strong April retail report yesterday was credited with helping push bond yields to the highest level in seven years. That's because it showed strong consumer spending which is two-thirds of the U.S. economy. Retail stocks must...
READ MORE
MEMBERS ONLY

These Two Materials Stocks are Looking to Lead
by Arthur Hill,
Chief Technical Strategist, TrendInvestorPro.com
The Materials SPDR (XLB) is having a good month with a 4+ percent gain so far in May. Within the sector, I am seeing some strength in two big chemical stocks, Air Products (APD) and Eastman Chemical (EMN).
Before looking at the charts, note that both are above their rising...
READ MORE
MEMBERS ONLY
The Four Decade-Long Downtrend In Interest Rates Is Over And This Is What It Means
by Tom Bowley,
Chief Market Strategist, EarningsBeats.com
Reminder
If you like my daily Trading Places blog articles and you haven't done so already, please subscribe below. It's a great feature that StockCharts.com provides for all of the blogs here, and it's FREE and easy. Simply scroll to the bottom of...
READ MORE
MEMBERS ONLY

Highlights from Tuesday's Show (On Trend)
by Arthur Hill,
Chief Technical Strategist, TrendInvestorPro.com
* Ranking Sectors by High-Low Percent.
* Sector SPDR Chart Analysis (big wedges).
* Oil and Energy-Related ETFs Continue to Work.
* 10-yr T-Yield Turns Back Up.
* Winners and Losers in Rising Rate Environment.
* Stocks: TSLA, DHR, NKE, ROST, SYK, UNH.
Today's c
ommentary and charts show some highlights from "On...
READ MORE
MEMBERS ONLY
DP Bulletin #2: OEX Adds IT Trend Model BUY Signal
by Erin Swenlin,
Vice President, DecisionPoint.com
Another Intermediate-Term Trend Model BUY signal arrived on the OEX Scoreboard. The Dow is very close to the same signal. For more information, I refer you to yesterday's article about the SPX IT Trend Model BUY signal. My analysis remains the same as yesterday. The outlook is improving...
READ MORE
MEMBERS ONLY

TEN-YEAR TREASURY YIELD RISES TO SEVEN-YEAR HIGH -- REGIONAL BANKS GAIN ON HIGHER YIELDS -- WHILE RATE SENSITIVE REITS TUMBLE -- S&P 500 SUFFERS MODEST PULLBACK -- DOLLAR JUMPS TO SIX-MONTH HIGH WHICH HURTS GOLD BUT SUPPORTS SMALL CAPS
by John Murphy,
Chief Technical Analyst, StockCharts.com
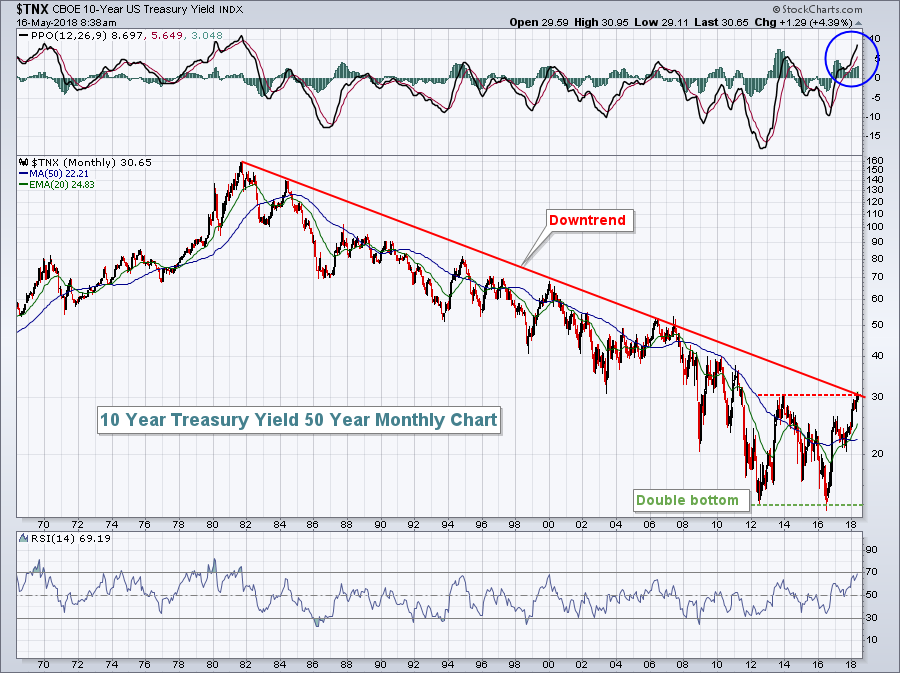
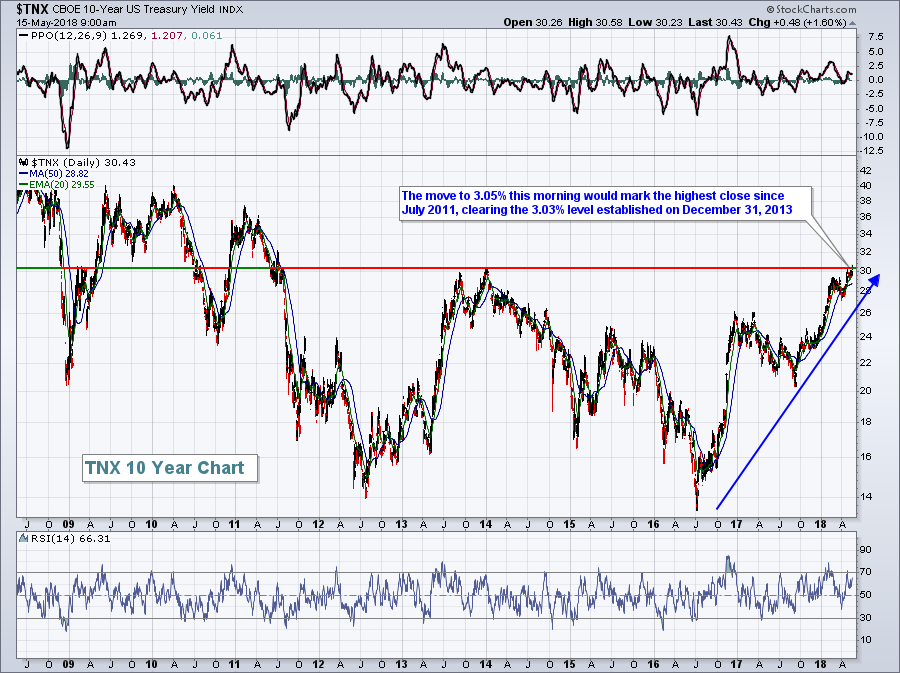
TEN-YEAR TREASURY REACHES 3.08%... The 10-year Treasury yield rose 8 basis points today to 3.08% which pushed it above its late 2013 peak near 3.03%. The monthly bars in Chart 1 shows the TNX now trading at the highest level since the summer of 2011. That'...
READ MORE
MEMBERS ONLY
Transports Fail Again At Resistance, Watch Them Closely
by Tom Bowley,
Chief Market Strategist, EarningsBeats.com
Market Recap for Monday, May 14, 2018
It was a day of bifurcated action, although the Dow Jones did manage to close higher for the 8th consecutive trading session, the longest such streak in 2018. One look at sector performance, however, illustrates the mixed action. Four sectors finished higher while...
READ MORE
MEMBERS ONLY
DP Bulletin #1: SPX Generates a New Intermediate-Term Trend Model BUY Signal
by Erin Swenlin,
Vice President, DecisionPoint.com
The SPX is the 2nd of the four DP Scoreboard indexes to trigger a new IT Trend Model BUY signal. This signal replaces a late March Neutral signal.
I've added the OEX and Dow charts below the SPX so you can see how close they are to triggering...
READ MORE
MEMBERS ONLY

Pfizer Surges within Consolidation
by Arthur Hill,
Chief Technical Strategist, TrendInvestorPro.com
The healthcare sector is coming alive on Monday and leading the broader market. As with the S&P 500, this sector struggled in 2018 and the Health Care SPDR (XLV) is up around 1.5% year-to-date. SPY, for reference, is up almost 3% this year.
The chart below shows...
READ MORE
MEMBERS ONLY

New pre-populated universes for Relative Rotation Graphs
by Julius de Kempenaer,
Senior Technical Analyst, StockCharts.com
If you have ever watched one of the webinars or Market Watchers Live shows that I have done here at Stockcharts.com, you may have seen me use Relative Rotation Graphs holding individual stocks and compare them to their sector benchmark.
After each appearance, I always got a few questions...
READ MORE
MEMBERS ONLY

Smaller Biotechs are Outperforming Larger Biotechs (IBB, XBI and XLV)
by Arthur Hill,
Chief Technical Strategist, TrendInvestorPro.com
* Biotechs Perk Up.
* Average-Cap XBI versus Large-cap IBB.
* IBB Surges off Support.
* XBI Holds Above Support.
* Health Care SPDR Bounces off Retracement Zone.
Biotechs showed some upside leadership with a big surge last week, most of which occurred on Friday. This group has been lagging the market in 2018, but...
READ MORE
MEMBERS ONLY
Biotechs Break To Six Week High As Healthcare Advances; Biotechs Poised To Lead Again
by Tom Bowley,
Chief Market Strategist, EarningsBeats.com
Market Recap for Friday, May 11, 2018
Considering the gains that the bulls enjoyed earlier in the week, Friday's end-of-day numbers weren't too shabby. Only the NASDAQ (-2.09 points) lost ground. Over the six prior sessions, the NASDAQ moved from its intraday low on May...
READ MORE
MEMBERS ONLY

CHARTS SUGGEST THAT STOCKS HAVE TAKEN A TURN FOR THE BETTER -- VANGUARD TOTAL STOCK MARKET ETF BREAKS THROUGH RESISTANCE BARRIERS -- FOREIGN STOCK ETFS ARE ALSO BOUNCING -- HONG KONG LEADS EMERGING MARKET REBOUND -- DON'T GET COMPLACENT ON INFLATION
by John Murphy,
Chief Technical Analyst, StockCharts.com
STOCKS APPEAR TO HAVE TURNED THE CORNER ... Stocks had a very good week. Major U.S. stock indexes had their best week in two months, with all of them gaining more than 2%. Small caps and the Nasdaq led the market higher. The S&P 600 Small Cap Index...
READ MORE
MEMBERS ONLY

Richard W. Arms Jr., Wyckoffian

by Bruce Fraser,
Industry-leading "Wyckoffian"
Richard (Dick) Arms was a very creative market technician. He tackled one of the most elusive concepts in technical analysis: Volume. He became famous for creating the ‘ARMS Index’ (previously known as the TRIN Index). Dick created the ARMS Index in 1967 and published it in Barron’s Magazine. It...
READ MORE
MEMBERS ONLY
This Rally Looks Like It Has Legs
by Martin Pring,
President, Pring Research
* When a top is not a top
* The rally is broadly based
* Is the US about to out-perform the world again?
When a top is not a top
Last week I pointed out that several indicators were positioned for a nice rally. However, one of the lingering questions related to...
READ MORE
MEMBERS ONLY
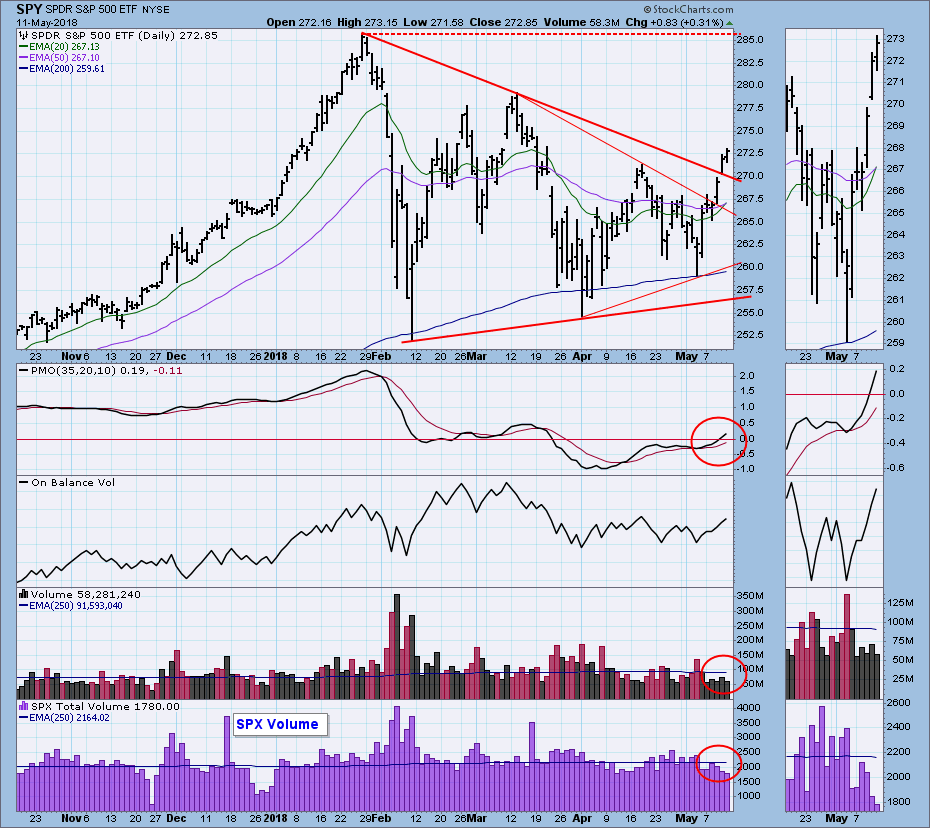
DP Weekly Wrap: SPY New BUY Signal
by Carl Swenlin,
President and Founder, DecisionPoint.com
On Friday the SPY 20EMA crossed up through the 50EMA, generating an Intermediate-Term Trend Model (ITTM) BUY signal for the broad market (SPY). Does this mean that I will have to reconsider my assumption that we are in a bear market? Well, I can hardly avoid it, but I still...
READ MORE
MEMBERS ONLY

DOW INDUSTRIALS NEAR UPSIDE BREAKOUT -- TRANSPORTS ARE ALSO NEARING APRIL HIGH -- BANKS AND FINANCIALS SHOW MARKET LEADERSHIP -- % OF NYSE STOCKS ABOVE 200-DAY MOVING AVERAGE TURNS UP -- COMMON STOCK ONLY AD LINE HITS NEW RECORD
by John Murphy,
Chief Technical Analyst, StockCharts.com
LOOKING FOR A DOW THEORY BUY SIGNAL ... It's always a good sign to see the Dow Industrials and Transports rising together, as they're doing today. The price bars in the upper chart show the Dow Industrials testing their mid-April peak at 24,900. An upside breakout...
READ MORE
MEMBERS ONLY
Treasury Yields, Dollar Take Breather; Utilities Rise
by Tom Bowley,
Chief Market Strategist, EarningsBeats.com
Market Recap for Thursday, May 10, 2018
It was a very bullish day on Wall Street. I suppose you could nit pick and point to utilities (XLU, +1.41%) outperforming on an up day, but it's difficult to ignore the solid participation during yesterday's rise. All...
READ MORE
MEMBERS ONLY

Weekly Market Review & Outlook (with Video) - Semis, Finance and Industrials Rebound
by Arthur Hill,
Chief Technical Strategist, TrendInvestorPro.com
* Weighing the Evidence.
* S&P 500 Breaks April High and Reverses Downswing.
* Small-caps Lead with New High.
* Small-caps are Really Really Small.
* Nasdaq 100 Leads New High List.
* Small-cap Sectors Lead.
* Tech, Finance and Industrials Dominate.
* Small-cap Industrials Sector Leads.
* Finance Sector Recovers.
* Notes from the Art's...
READ MORE
MEMBERS ONLY

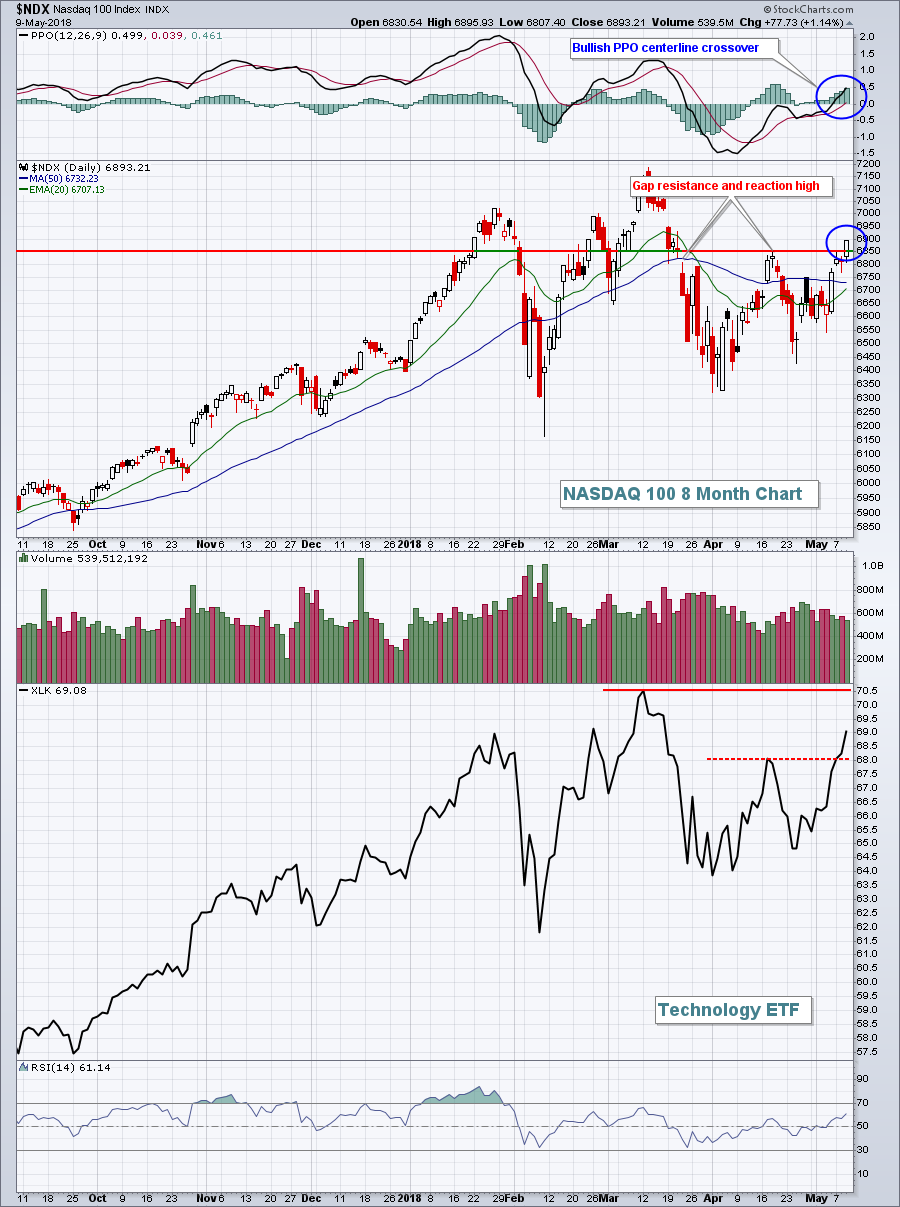
THE NASDAQ 100 IS LEADING THE MARKET HIGHER -- SO IS THE TECHNOLOGY SECTOR -- THE S&P 600 SMALL CAP INDEX IS BREAKING OUT TO A NEW RECORD -- THE RUSSELL 2000 ISN'T FAR BEHIND -- THAT'S PULLING LARGE CAPS HIGHER
by John Murphy,
Chief Technical Analyst, StockCharts.com
NASDAQ 100 AND TECHNOLOGY SECTOR ACHIEVE BULLISH BREAKOUTS ... The technical picture for the stock market continues to improve on a lot of fronts. One of them is this week's upside breakout in Nasdaq market. Chart 1 shows the PowerShares Nasdaq 100 (QQQ) climbing above its mid-April high to...
READ MORE
MEMBERS ONLY
Building a Rules-Based Trend Following Model - 9

by Greg Morris,
Veteran Technical Analyst, Investor, and Author
One of my trend following indicators was created because I felt that there were some issues with market breadth that needed attention. For example, the Friday after Thanksgiving. The market is only open a few hours and trading volume is very light. There are price changes but nothing exceptional. However,...
READ MORE
MEMBERS ONLY
S&P Small Caps Close At All-Time High; Falling VIX Says NO To Bear Market
by Tom Bowley,
Chief Market Strategist, EarningsBeats.com
Market Recap for Wednesday, May 9, 2018
Was Wednesday the day that marked the resumption of the 9 year bull market? Some might argue it began with the bottom last week, while others might argue it hasn't begun because the Dow Jones and S&P 500 are...
READ MORE
MEMBERS ONLY
DP Alert: NDX First to Get IT BUY Signal - Bullish Indicators - Dow ST BUY Signal
by Erin Swenlin,
Vice President, DecisionPoint.com
It's going to be one of those weeks apparently when we watch the DecisionPoint Scoreboards flip out. We have had seven signal changes starting May 4th. The reversals in the short-term trend is typical during volatile periods. What I'm most interested in right now are the...
READ MORE
MEMBERS ONLY

THREE-YEAR HIGH IN OIL MAKES ENERGY MARKET LEADERS -- S&P OIL & GAS EXPLORATION & PRODUCTION SPDR BREAKS OUT -- OCCIDENTAL AND EOG ARE XOP LEADERS -- RISING OIL AND BOND YIELDS EXPLAIN WHY ENERGY SHARES ARE DOING BETTER THAN UTILITIES
by John Murphy,
Chief Technical Analyst, StockCharts.com
ENERGY SHARES HAVE BECOME MARKET LEADERS... This shouldn't come as news to readers of this website. Articles written by myself and my colleagues at Stockcharts.com have been bullish on crude oil and energy stocks since the first quarter. So this is just an update of an ongoing...
READ MORE
MEMBERS ONLY
Bullish Rotation Continues On Tuesday Despite Flat Market
by Tom Bowley,
Chief Market Strategist, EarningsBeats.com
Market Recap for Tuesday, May 8, 2018
There are days when the stock market seems to go nowhere and are relatively meaningless. Tuesday wasn't one of those days. While the Dow Jones and NASDAQ gained a measly 2.89 and 1.69 points, respectively, and the S&...
READ MORE
MEMBERS ONLY

Ringing the Bell for Hilton
by Arthur Hill,
Chief Technical Strategist, TrendInvestorPro.com
Hilton (HLT) led the market in the second half of 2017 and then took a breather in 2018. This is looking like the pause that refreshes as the stock challenges resistance.
First and foremost - you know the drill - the long-term trend is up and this means I am...
READ MORE
MEMBERS ONLY

Banks Lead on Multiple Timeframes - Plus JPM, MS, Energy-ETFs, Bonds and Utes
by Arthur Hill,
Chief Technical Strategist, TrendInvestorPro.com
* Banks Lead on Multiple Timeframes.
* Regional Bank SPDR Extends Upturn.
* Big Banks are Mixed.
* Wedge Corrections for JPM and MS.
* Small-caps Get Dollar Tailwind.
* Energy ETFs Break Out of Consolidations.
* Bond Market Breakdown Holds.
* Utilities Look Poised to Continue Downtrend.
Banks Lead on Multiple Timeframes...
The PerfChart below shows the...
READ MORE