MEMBERS ONLY

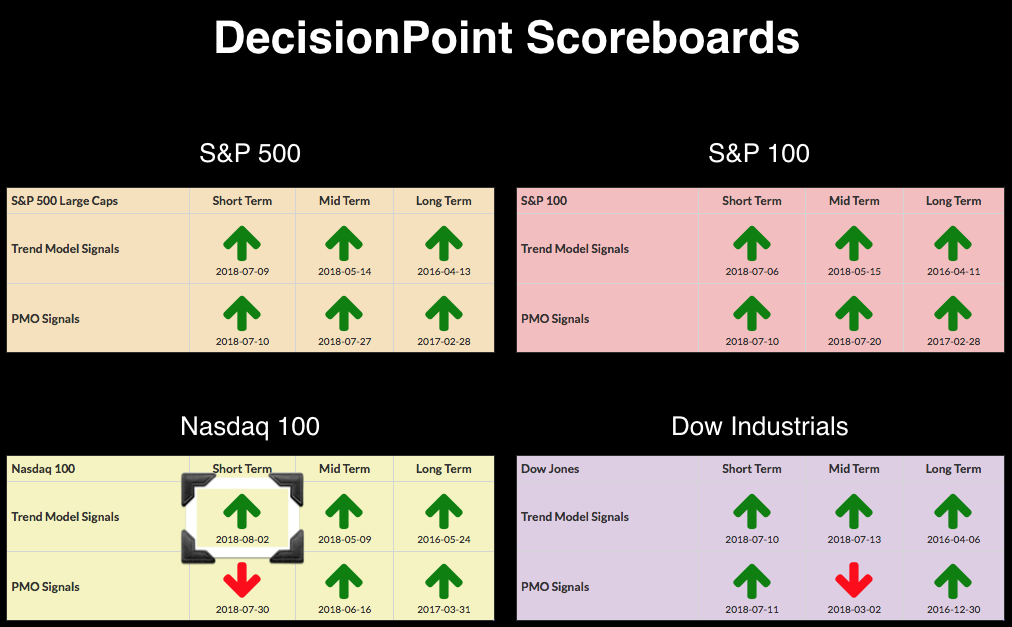
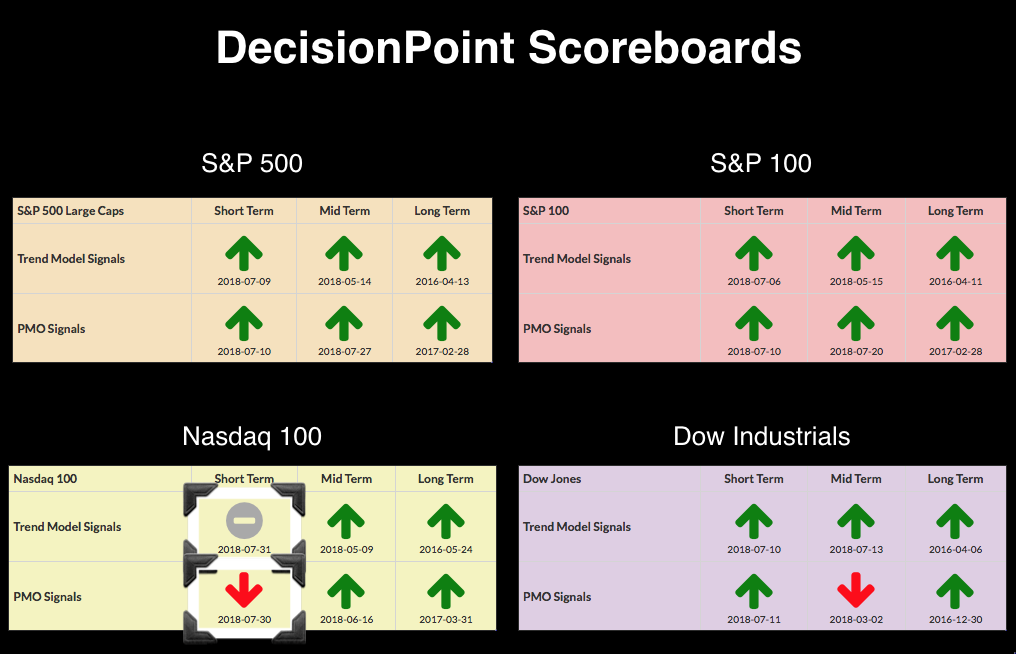
DP Alert: New PMO BUY Signal on NDX - Dollar Pulls Back a Little More

by Erin Swenlin,
Vice President, DecisionPoint.com
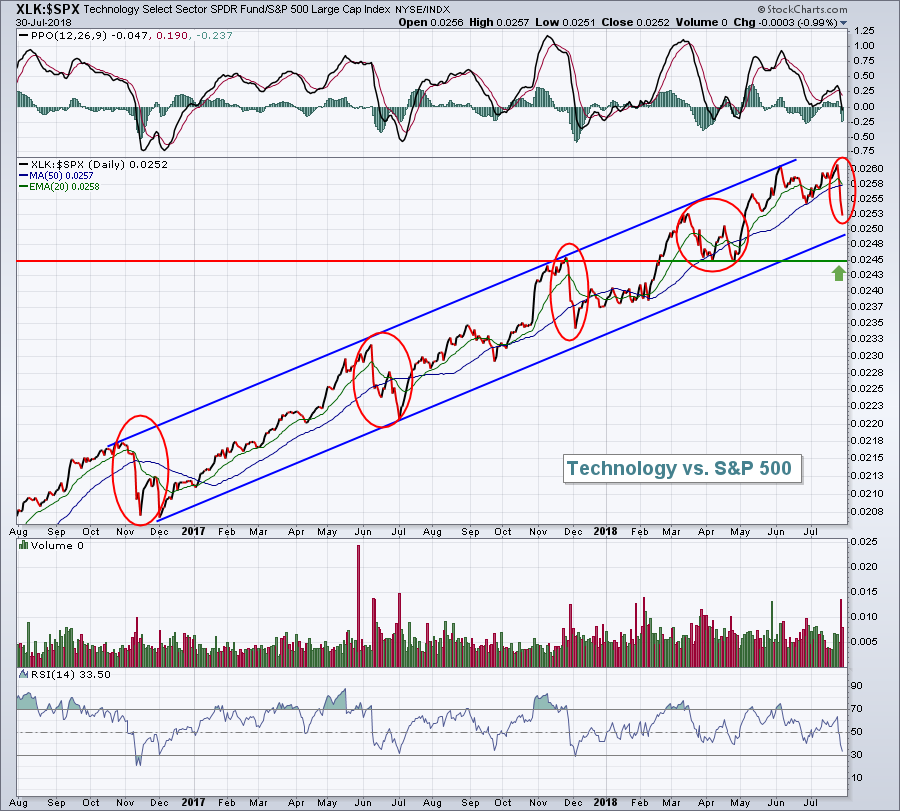
The DecisionPoint Scoreboards are nearly all "green" with BUY signals. Today the NDX completed its green Scoreboard with a PMO BUY signal on the daily chart. The Technology Sector (XLK) and the NDX ETF (QQQ) also logged new Short-Term PMO BUY signals. It appears the tech sector is...
READ MORE
MEMBERS ONLY

LONG-RANGE DOLLAR UPTREND REMAINS INTACT -- LATE CYCLE COMMODITY UPTURN IS UNLIKELY WITH A RISING DOLLAR -- STRONG DOLLAR FAVORS U.S. OVER FOREIGN STOCKS -- ESPECIALLY EMERGING MARKETS

by John Murphy,
Chief Technical Analyst, StockCharts.com
LONG-TERM TREND OF THE DOLLAR IS STILL UP... The direction of the U.S. dollar is important because it influences (or is influenced by) by a lot of other markets. That includes commodities, global interest rates, and global stocks. Dollar direction also influences the relative performance of small cap stocks...
READ MORE
MEMBERS ONLY
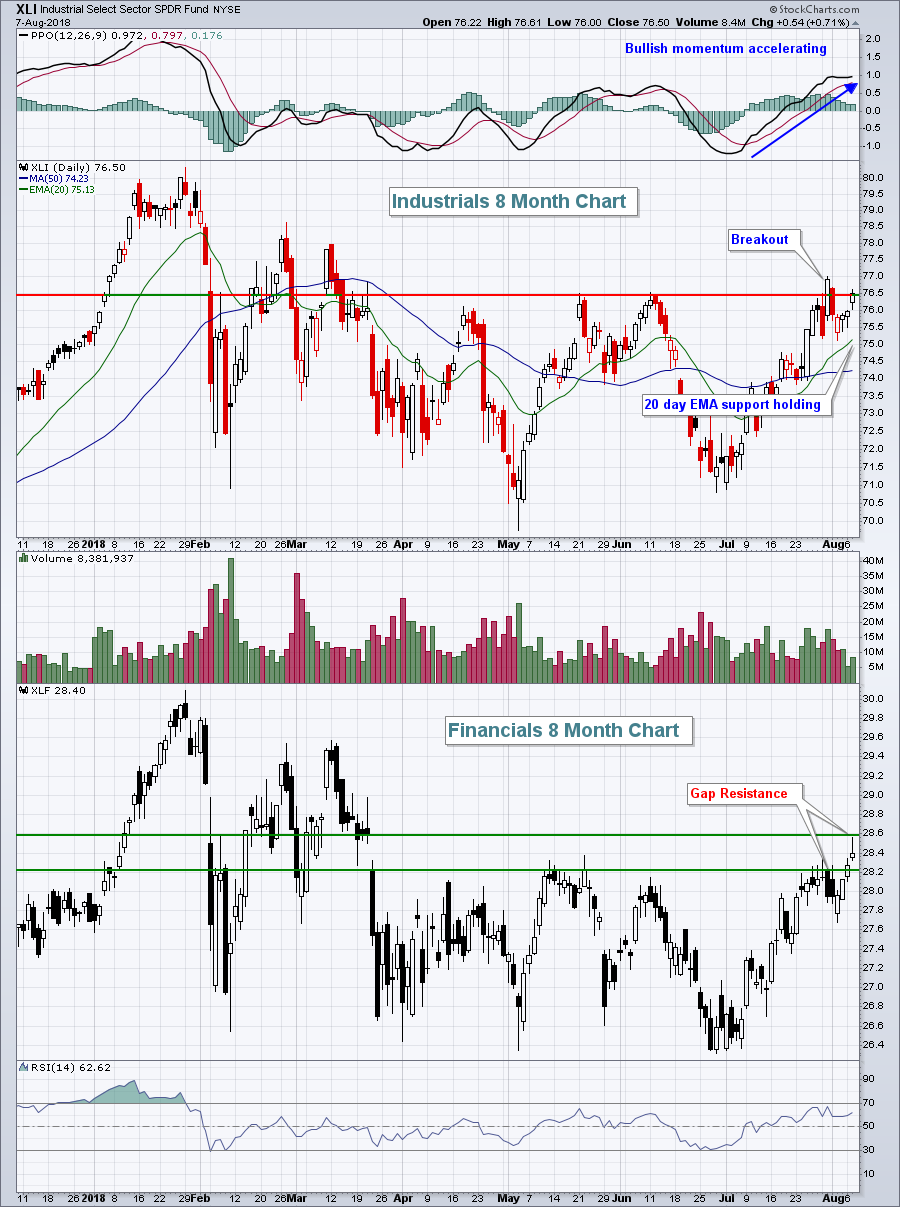
Energy And Industrials Lead Wall Street Rally, But Here's The Bullish News

by Tom Bowley,
Chief Market Strategist, EarningsBeats.com
Market Recap for Tuesday, August 7, 2018
It was another nice rally on Wall Street, led by energy (XLE, +0.74%) and industrials (XLI, +0.71%). Since the beginning of July, we've seen renewed strength in larger cap stocks. Industials, along with financials (XLF, +0.46%) have been...
READ MORE
MEMBERS ONLY
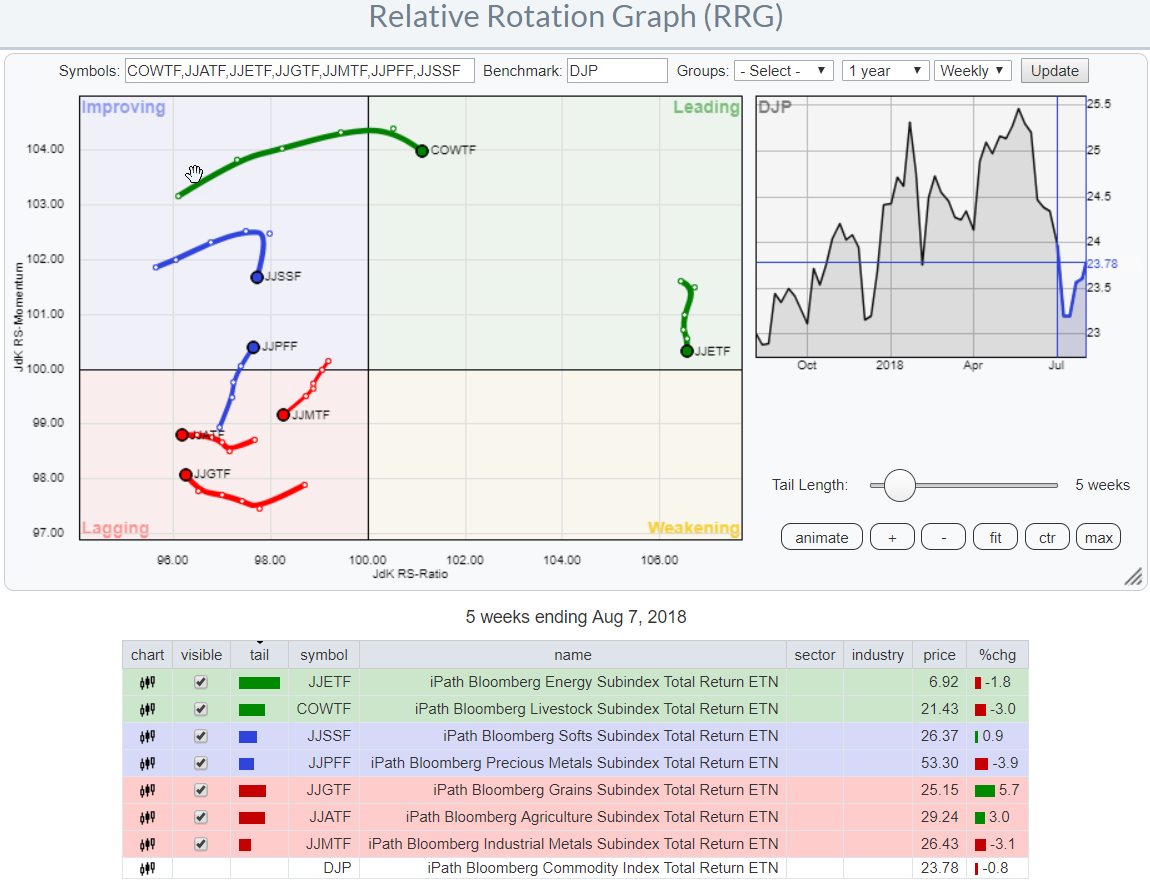
Relative Rotation Graphs can show (much) more than just equity sectors (extended)

by Julius de Kempenaer,
Senior Technical Analyst, StockCharts.com
Relative Rotation Graphs are a great tool to visualize equity sector rotation and they are probably most used for that purpose. However, there are many more areas where RRGs can be used to get a big picture view of what is going on among a group of securities or related...
READ MORE
MEMBERS ONLY

Dollar Gains Momentum, PMO BUY Signal Triggered
by Erin Swenlin,
Vice President, DecisionPoint.com
Yesterday's breakout on UUP was impressive and although the Dollar pulled back slightly today, it didn't matter to the Price Momentum Oscillator (PMO) as it crossed its signal line and triggered a BUY signal.
While studying the OHLC chart for UUP, I realized if I looked...
READ MORE
MEMBERS ONLY

FINANCIAL SPDR ACHIEVES BULLISH BREAKOUT -- INDUSTRIAL SPDR MAY BE NEXT -- MATERIALS SPDR REGAINS MOVING AVERAGE LINES -- THE DOW INDUSTRIALS AND TRANSPORTS ARE BREAKING OUT TOGETHER -- THE S&P 500 NEARS TEST OF JANUARY HIGH
by John Murphy,
Chief Technical Analyst, StockCharts.com
FINANCIALS SPDR BREAKS OUT ... Global stocks are having a strong day. Rebounds in foreign developed and emerging markets set the tone for higher trading in the states. All major U.S. indexes are in the black, as are most stock sectors. The strongest sectors are energy, financials, industrials, and materials....
READ MORE
MEMBERS ONLY
Weight of the Evidence

by Greg Morris,
Veteran Technical Analyst, Investor, and Author
In my recent Building a Rules-Based Trend Following Model series, I talked extensively about the Weight of the Evidence. This is my measure to tell me what the market is doing based upon nine different technical measures made up of price, breadth, and relative strength (PBR, like the beer). Tushar...
READ MORE
MEMBERS ONLY
Small Caps Ready To Flourish With Dollar Surge? Watch This Signal
by Tom Bowley,
Chief Market Strategist, EarningsBeats.com
Market Recap for Monday, August 6, 2018
The Russell 2000 and NASDAQ paced a day of strength on Wall Street as they gained 0.65% and 0.61%, respectively. The S&P 500 and Dow Jones enjoyed smaller gains as money rotated back towards more aggressive areas. The 10...
READ MORE
MEMBERS ONLY

Are We Seeing The Early Sign Of A Change In Market Leadership?

by Martin Pring,
President, Pring Research
* The Inflation/Deflation ratio
* Lagging sectors
* Defensive sectors
The Inflation/Deflation ratio
Last week I charted my Inflation/deflation ratio for the first time in a while and was surprised to see that it had broken to the downside. For those unfamiliar with the concept, the Inflation Ratio (!PRII) consists...
READ MORE
MEMBERS ONLY
Friday Action Bifurcated As Dollar Awaiting Bullish Breakout
by Tom Bowley,
Chief Market Strategist, EarningsBeats.com
Market Recap for Friday, August 3, 2018
The stock market has clearly turned more defensive over the past 2-3 months and Friday was another perfect example of that. The more aggressive small cap Russell 2000 was the laggard, dropping 0.52%. Meanwhile, the NASDAQ produced only a minor 0.12%...
READ MORE
MEMBERS ONLY

Gilead Gets another Bollinger Band Squeeze

by Arthur Hill,
Chief Technical Strategist, TrendInvestorPro.com
Gilead is in the midst of its fourth Bollinger Band squeeze in the past year. The last four instances foreshadowed pretty strong moves so I will be watching the current squeeze closely for the next directional clue.
A Bollinger Band squeeze occurs when the bands contract and the Bandwidth indicator...
READ MORE
MEMBERS ONLY

Homework Assignment

by Bruce Fraser,
Industry-leading "Wyckoffian"
ChartCon 2018 is fast approaching and preparations are being made. Let’s take a few minutes during this busy week to study some charts. For contrast we will compare the NASDAQ Composite, which is one of the leadership indexes, to the Dow Jones Industrials, which is a laggard.
A big...
READ MORE
MEMBERS ONLY

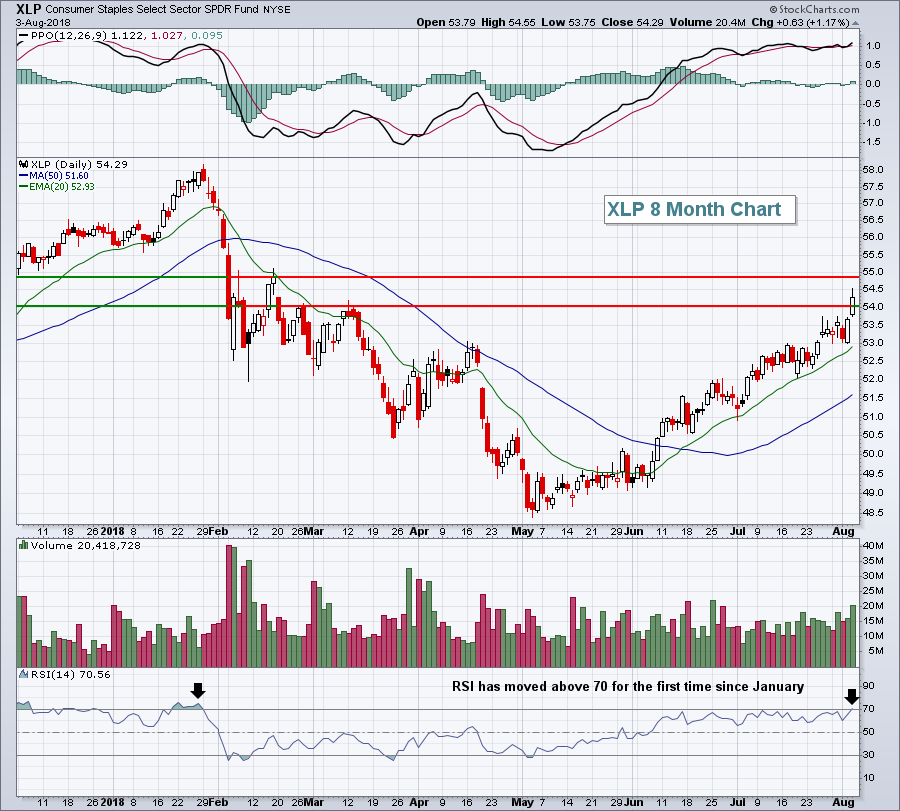
DEFENSIVE STOCKS ARE LEADING THE MARKET HIGHER -- CONSUMER STAPLES SPDR TURNS UP AND SHOWS MARKET LEADERSHIP -- SO DO UTILITIES AND REITS -- PHARMA IS LEADING HEALTHCARE SECTOR HIGHER -- ALL OF WHICH SUGGESTS INVESTORS MAY BE TURNING MORE DEFENSIVE
by John Murphy,
Chief Technical Analyst, StockCharts.com
CONSUMER STAPLES TURN UP... Although the stock market continued to climb this week, it's a little surprising to see defensive stocks leading it higher. The four strongest sectors this past week were REITs (+3.3%), healthcare (+2.1%), consumer staples (+1.7%), and utilities (+1.2%). All did...
READ MORE
MEMBERS ONLY
The Question Rarely Addressed - When Do I Sell?
by Tom Bowley,
Chief Market Strategist, EarningsBeats.com
Buying is so easy. When you pull that trigger to buy, optimism abounds. Maybe it was a recommendation from a friend. Perhaps there was water cooler talk of the next Apple (AAPL). You might even have uncovered it from a time-tested scan. The reason doesn't really matter. The...
READ MORE
MEMBERS ONLY
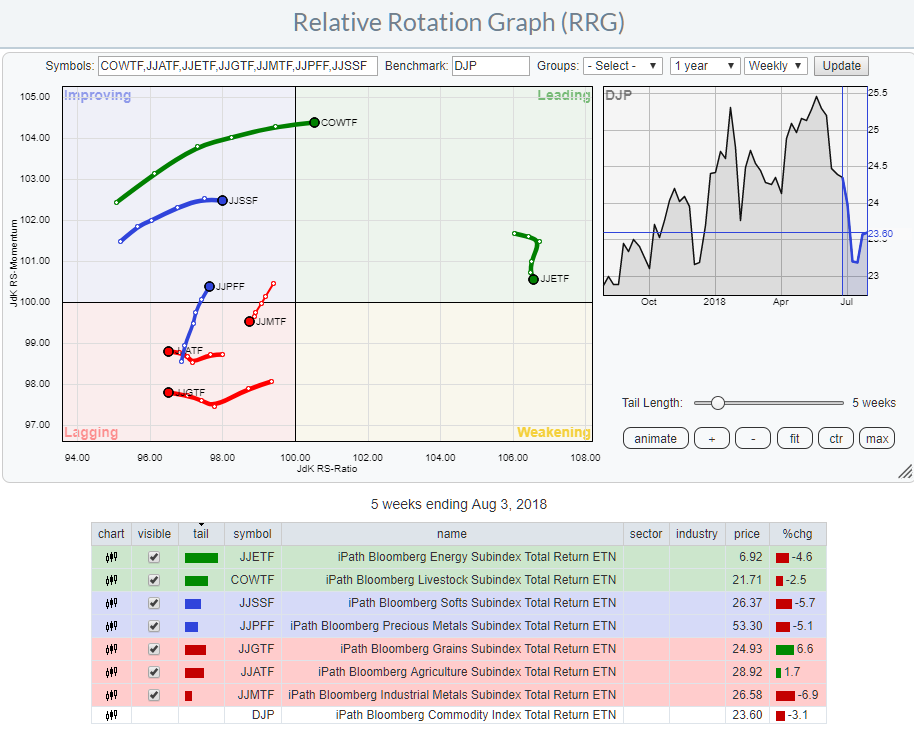
Relative Rotation Graphs can show (much) more than just equity sectors
by Julius de Kempenaer,
Senior Technical Analyst, StockCharts.com
Relative Rotation Graphs are a great tool to visualize equity sector rotation and they are probably most used for that purpose. However, there are many more areas where RRGs can be used to get a big picture view of what is going on among a group of securities or related...
READ MORE
MEMBERS ONLY
Finding Leading Stocks in Strong Uptrends (Trend Following)
by Arthur Hill,
Chief Technical Strategist, TrendInvestorPro.com
Trend following strategies are built on the premise that trends persist and we can make money by simply following the trend until it ends. There will be losers along the way, but a few strong trends will more than make up for the losses. It sounds great in theory, but...
READ MORE
MEMBERS ONLY
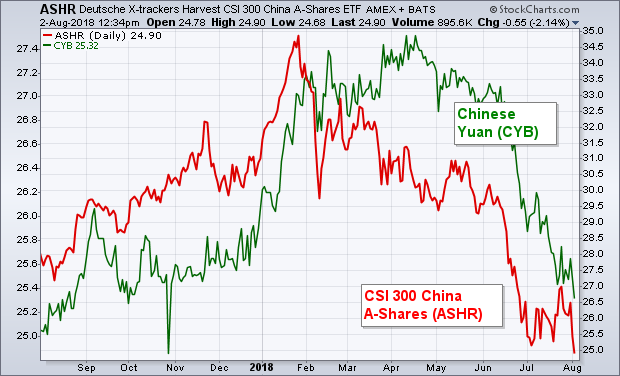
Selling in China Unsettles Global Stocks This Morning on Tariff Threats -- But US Stock Indexes Are Recovering from Early Selling
by John Murphy,
Chief Technical Analyst, StockCharts.com
Editors Note: This article was originally published in John Murphy's Market Message on Thursday, August 2nd at 1:43pm ET.
TARIFF THREATS PUSH CHINESE MARKETS LOWER ... Threats of higher tariffs on Chinese imports, combined with Chinese threats of retaliation, put international markets on the defensive today. It started...
READ MORE
MEMBERS ONLY
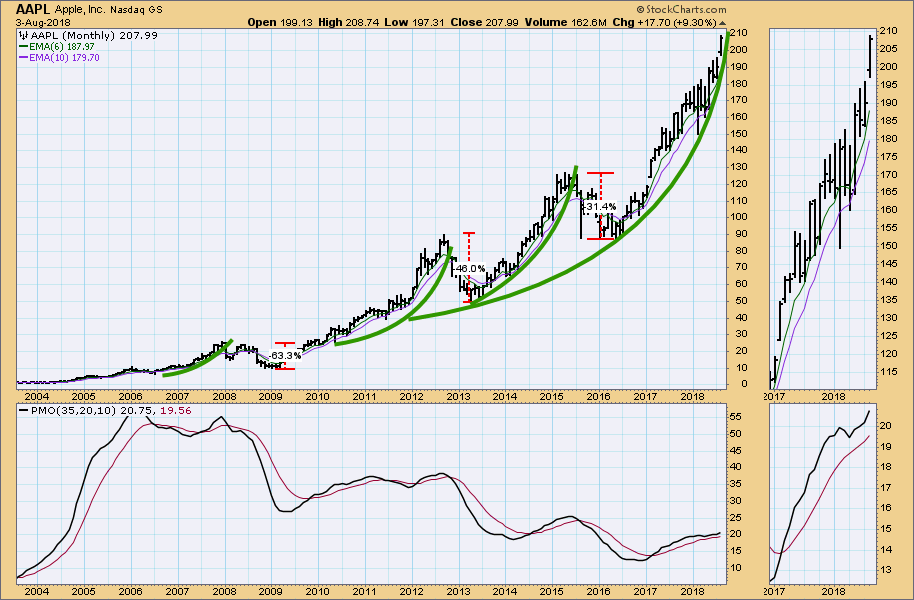
DP Weekly Wrap: Apple Hits $1 Trillion

by Carl Swenlin,
President and Founder, DecisionPoint.com
On Thursday, when Apple's (AAPL) market cap went over the $1 trillion mark, Dennis Gartman (The Gartman Letter) said something to the effect that this is the kind of thing we see at market tops, not in the middle of a long advance. I felt the same way....
READ MORE
MEMBERS ONLY
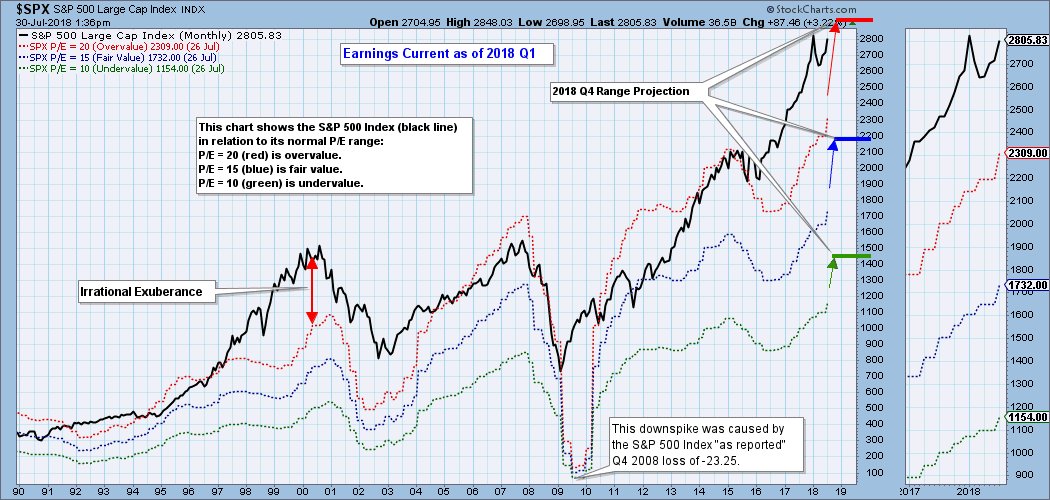
Fundamentals: Market Still Extremely Overvalued
by Carl Swenlin,
President and Founder, DecisionPoint.com
What's a technical guy doing talking about fundamentals? Well, I believe that charts of fundamental data are as useful as price charts in helping us visualize fundamental context and trends. In the case of earnings, the following chart shows us where the S&P 500 would have...
READ MORE
MEMBERS ONLY

Weekly Market Review and Outlook - 3 Sectors Pick up the Slack
by Arthur Hill,
Chief Technical Strategist, TrendInvestorPro.com
* Weekly Performance Review.
* Changing of the Guard Continues
* S&P SmallCap iShares Outperforms Russell 2000 iShares
* S&P 500 is in a Bull Market
* High-Low Lines Continue to Rise
* QQQ Becomes Short-term Oversold
* IJR Consolidates Near Highs
* Measuring Trend Strength with Stochastics
* XLF and XLI Challenge Resistance
* This...
READ MORE
MEMBERS ONLY
Apple Tops $1 Trillion Market Cap, Leads Technology Higher
by Tom Bowley,
Chief Market Strategist, EarningsBeats.com
Special Note
I will be traveling to Seattle this weekend for ChartCon 2018. My schedule the next two weeks is likely to be quite different and sporadic, perhaps posting articles during the trading day or possibly even after the market closes. If you've grown accustomed to my articles...
READ MORE
MEMBERS ONLY

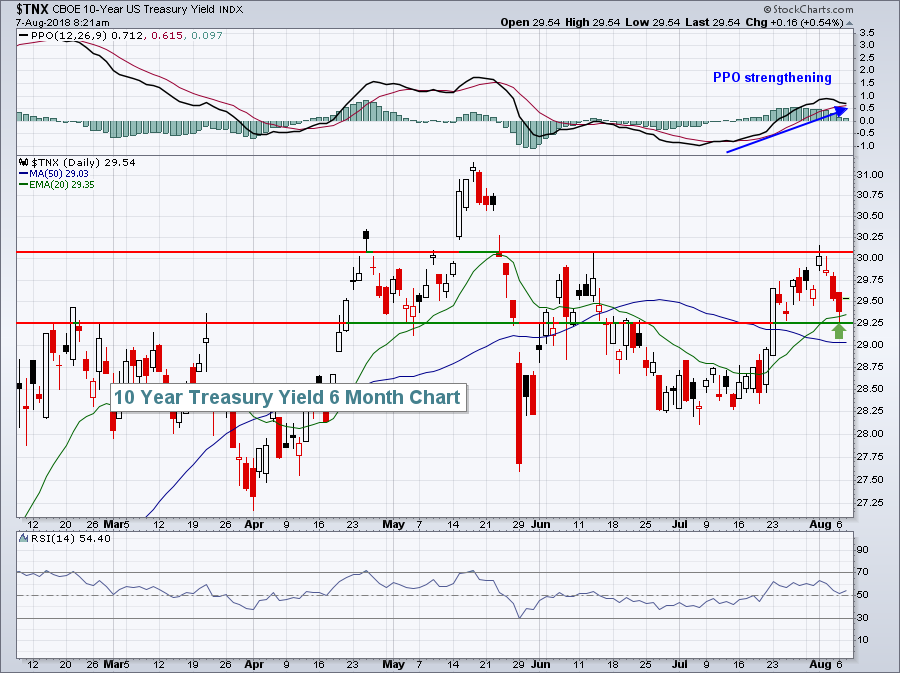
Bond Yields Hit Mega Resistance. Will They Go Through?
by Martin Pring,
President, Pring Research
* 3- and 10-year series challenging their secular down trendlines
* Three indicators that suggest lower bond yields
* The Crunch Chart
3- and 10-year series challenging their secular down trend lines
US government bond yields have reached very important resistance, at a time when they are overextended on a long-term momentum basis....
READ MORE
MEMBERS ONLY
NDX Erases ST Neutral Signal - Insult to Injury...TLT Adds Another SELL Signal
by Erin Swenlin,
Vice President, DecisionPoint.com
The ST Trend Model Neutral signal that the NDX carried for a few days gave way to a new BUY signal as the 5-EMA launched above the 20-EMA on today's strong rally. I've annotated the change on the DecisionPoint Scoreboards below. TLT triggered a Long-Term Trend...
READ MORE
MEMBERS ONLY

You're One Week Away From The Two Most Transformative Days Of 2018

by Grayson Roze,
Chief Strategist, StockCharts.com
Hello Fellow ChartWatchers!
Can you believe that we’re just ONE WEEK AWAY from ChartCon 2018? Our 5th online investing conference goes LIVE on the morning of August 1oth at 10:00am ET, and I can hardly contain my excitement. The presentations have been sent in, our bonus videos are...
READ MORE
MEMBERS ONLY

SELLING IN CHINA UNSETTLES GLOBAL STOCKS THIS MORNING ON TARIFF THREATS -- BUT US STOCK INDEXES ARE RECOVERING FROM EARLY SELLING -- MATERIAL STOCKS ARE DAY'S WEAKEST SECTOR -- TECHNOLOGY SPDR AND QQQ BOUNCE OFF 50-DAY LINES TO LEAD MARKET RECOVERY
by John Murphy,
Chief Technical Analyst, StockCharts.com
TARIFF THREATS PUSH CHINESE MARKETS LOWER ... Threats of higher tariffs on Chinese imports, combined with Chinese threats of retaliation, put international markets on the defensive today. It started in Asia, spread to Europe, and caused a lower stock opening here. China took the biggest hit. The red line in Chart...
READ MORE
MEMBERS ONLY

Noise is Deafening!
by Greg Morris,
Veteran Technical Analyst, Investor, and Author
Just in the course of a normal week, we are bombarded with information from sources such as the FED, television analysts, brokerage firm analysts, economists’ projections, newspapers, junk mail, neighbors, war reporters, fake news, etc. Making investment decisions without a plan or methodology is truly a gamble. And to think...
READ MORE
MEMBERS ONLY
Apple Soars, Trade Fears Send Futures Plummeting
by Tom Bowley,
Chief Market Strategist, EarningsBeats.com
Market Recap for Wednesday, August 1, 2018
Wednesday was a day of bifurcated action with Apple (AAPL) leading technology (XLK, +0.90%) and the NASDAQ higher, while the Dow Jones, S&P 500, Russell 2000 and most sectors finished lower. It was a case of one behemoth, nearly $1...
READ MORE
MEMBERS ONLY

Utes and REITs form Bullish Continuation Patterns - HACK and XBI Become Short-term Oversold
by Arthur Hill,
Chief Technical Strategist, TrendInvestorPro.com
* Pick your Timeframe to Suit your Message.
* Aroons Signal Consolidation in XLU.
* XLRE Breaks Out of Flag.
* REITs, Utilities and the 10-year Correlation.
* HACK Becomes Oversold in an Uptrend.
* The Dreaded Double Dip in RSI.
.... Timeframe and Message
... The Utilities SPDR (XLU), the Energy SPDR (XLE) and the Real Estate...
READ MORE
MEMBERS ONLY
DP Alert: TLT Triggers a Long-Term SELL Signal - Monthly Chart Review
by Erin Swenlin,
Vice President, DecisionPoint.com
The monthly charts 'went final' yesterday after the market closed, so it's time to review and prepare for next month. I highly recommend you check out the video version on today's MarketWatchers LIVE show where I had more time and space to discuss.
The...
READ MORE
MEMBERS ONLY
August Market Round Up With Martin Pring Video 2018-08-01
by Martin Pring,
President, Pring Research
This month, the Market Roundup carries a lot of information about how acute the current market position is in globally.
Good luck and good charting,
Martin J. Pring
The views expressed in this article are those of the author and do not necessarily reflect the position or opinion of Pring...
READ MORE
MEMBERS ONLY
Apple Delivers With The Fed On Deck
by Tom Bowley,
Chief Market Strategist, EarningsBeats.com
Market Recap for Tuesday, July 31, 2018
It was a solid day on Wall Street to close out July. The small cap Russell 2000, weak on a relative basis during July, regained its leadership role, spiking more than 1% and doubling the performance of its other major index counterparts. Industrials...
READ MORE
MEMBERS ONLY

Waters Corp Stalls Near Key Retracement
by Arthur Hill,
Chief Technical Strategist, TrendInvestorPro.com
Waters Corp led the market in 2017 with a 65 percent gain, but lagged in 2018 as the stock corrected the last six months. I am watching this correction pattern for a breakout that would signal a continuation of the bigger uptrend. Waters Corp makes analytical equipment and software for...
READ MORE
MEMBERS ONLY
DP Bulletin: NDX Loses Its Short-Lived BUY Signals
by Erin Swenlin,
Vice President, DecisionPoint.com
The DecisionPoint Scoreboards were blemished by the loss of the green BUY signals on the NDX. The weekly PMO on the Dow has been holding out for awhile, but it is rising suggesting momentum is still positive in the intermediate term.
Not to be alarmist, but the NDX has reached...
READ MORE
MEMBERS ONLY

INDUSTRIAL SPDR ACHIEVES BULLISH BREAKOUT TO LEAD MARKET HIGHER -- XLI LEADERS INCLUDE XYLEM, HARRIS, AND EATON -- THE DOW TRANSPORTS ARE CHALLENGING THEIR JUNE HIGH -- TRAN LEADERS INCLUDE FEDEX AND RYDER -- PFIZER SURGES TO NEW RECORD TO LEAD DOW HIGHER
by John Murphy,
Chief Technical Analyst, StockCharts.com
INDUSTRIAL SPDR REACHES FOUR-MONTH HIGH ... While media attention seems to be focused on struggling FANG stocks, investors are putting their money elsewhere. Chart 1 shows the Industrial Sector SPDR (XLI) rising above its June high to reach the highest level in four months. That's a healthy sign for...
READ MORE
MEMBERS ONLY
This Part Of Energy Completes Right Side Of Cup, Very Bullish
by Tom Bowley,
Chief Market Strategist, EarningsBeats.com
Market Recap for Monday, July 30, 2018
Only three sectors were able to finish in positive territory on Monday as bears permeated Wall Street. Two of the three - financials (XLF, +0.07%) and healthcare (XLV, +0.06%) - barely managed to eke out gains. The only real strength was...
READ MORE
MEMBERS ONLY
US Bancorp Makes a Break for It
by Arthur Hill,
Chief Technical Strategist, TrendInvestorPro.com
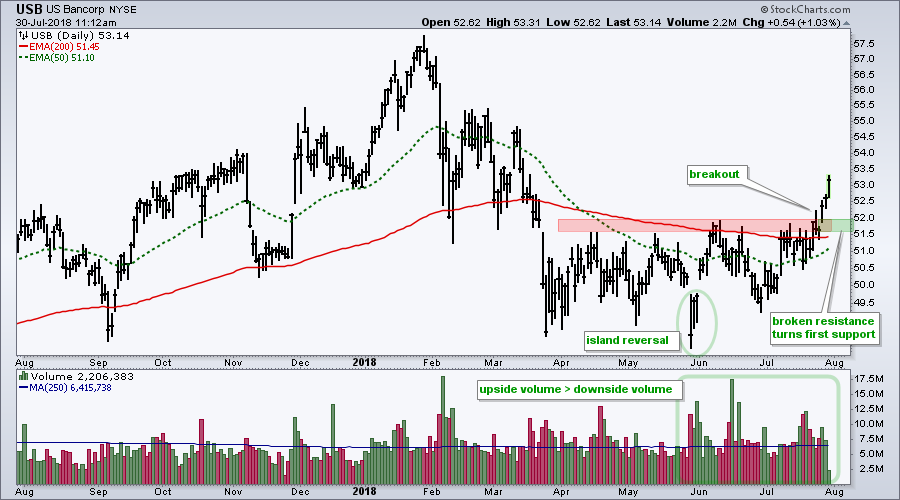
US Bancorp lagged the broader market the first half of the year, but managed to firm from March to June and lead with a breakout in July.
The chart shows USB falling from 57 to 49 with a sharp decline from late January to late March. The stock managed to...
READ MORE
MEMBERS ONLY

Oil Extends Uptrend and Lifts Energy-Related Shares
by Arthur Hill,
Chief Technical Strategist, TrendInvestorPro.com
* Oil Surges back above $70.
* XLE Turns Up within Range.
* XES Surges off Support.
* Chevron Bounces on Big Volume.
* Halliburton versus Baker Hughes.
... Oil Surges back above $70
... Oil fell on Friday and rebounded on Monday to keep its mean-reversion bounce alive. I highlighted oil, XLE and the Oil &...
READ MORE
MEMBERS ONLY
Twitter Provides Internet Bears A Double Dose Of Adrenaline
by Tom Bowley,
Chief Market Strategist, EarningsBeats.com
Market Recap for Friday, July 27, 2018
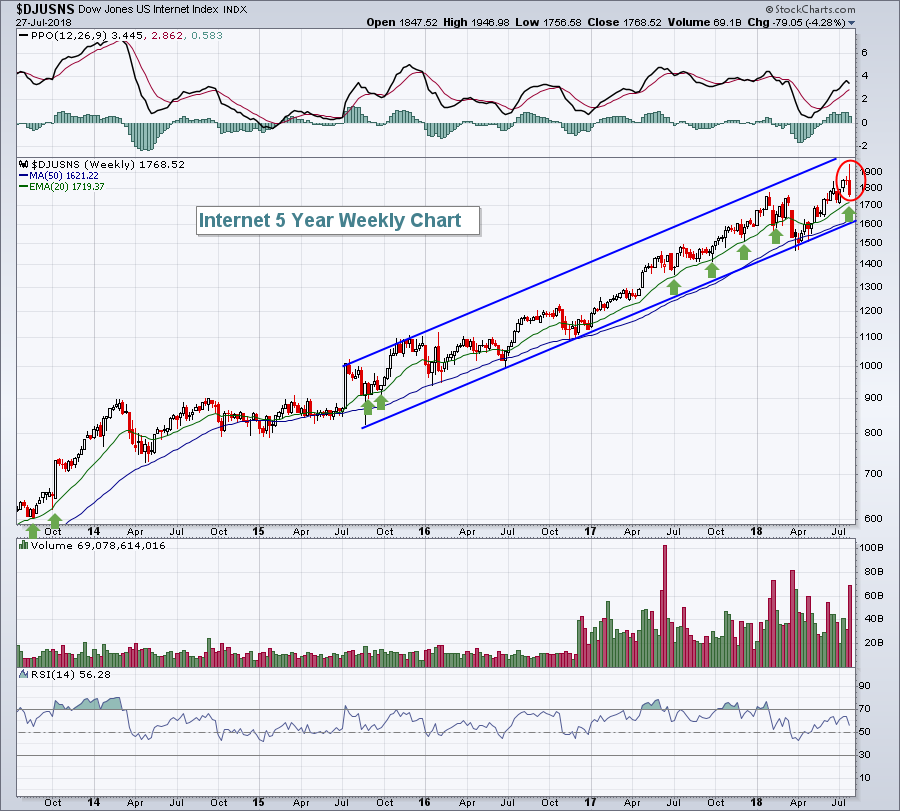
A second wave of internet troubles came in the form of Twitter Inc (TWTR) after the recently-soaring internet giant disappointed traders with its latest quarterly results. It was an UGLY reaction by Wall Street as TWTR fell nearly 21% exactly one day after...
READ MORE
MEMBERS ONLY

SMALL CAPS LOOK TOPPY AND ARE STARTING TO WEAKEN -- WHILE THE S&P 500 SPDR IS TESTING OVERHEAD RESISTANCE AT ITS JANUARY HIGH -- THAT COULD LEAD TO A CHOPPY AUGUST
by John Murphy,
Chief Technical Analyst, StockCharts.com
SMALL CAPS ROLL OVER WHILE SPY TESTS JANUARY HIGH ... Stocks are beginning to look a little toppy. That's especially true of small caps. Chart 1 shows the Russell 2000 Small Cap Index ($RUT) ending the week below its 50-day moving average (blue circle). The RUT has been losing...
READ MORE
MEMBERS ONLY

This New Behind-The-Scenes Video Perfectly Captures The ChartCon Spirit
by Grayson Roze,
Chief Strategist, StockCharts.com
Hello Fellow ChartWatchers!
In case you missed it, we just released a special behind-the-scenes video that I want to make sure you see. I can hardly believe that ChartCon 2018 is now only TWO WEEKS AWAY, but watching this video really made it feel even more real.
Last week, while...
READ MORE