MEMBERS ONLY

QQQ Traps Traders on the Island as SPY Extends Wedge Break

by Arthur Hill,
Chief Technical Strategist, TrendInvestorPro.com
* QQQ Holds Gap for Three Days.
* SPY Holds Wedge Break.
* Charting the Fab Five.
* MMM and Honeywell Join Dow Triangulation.
QQQ Traps Traders on the Island ...
QQQ formed an island reversal with Monday's gap down and held this gap for three days. Chartists sometimes apply time filters to...
READ MORE
MEMBERS ONLY

DP Alert: Bearish Double-Top on SPY - USO Breaks Out Big

by Erin Swenlin,
Vice President, DecisionPoint.com
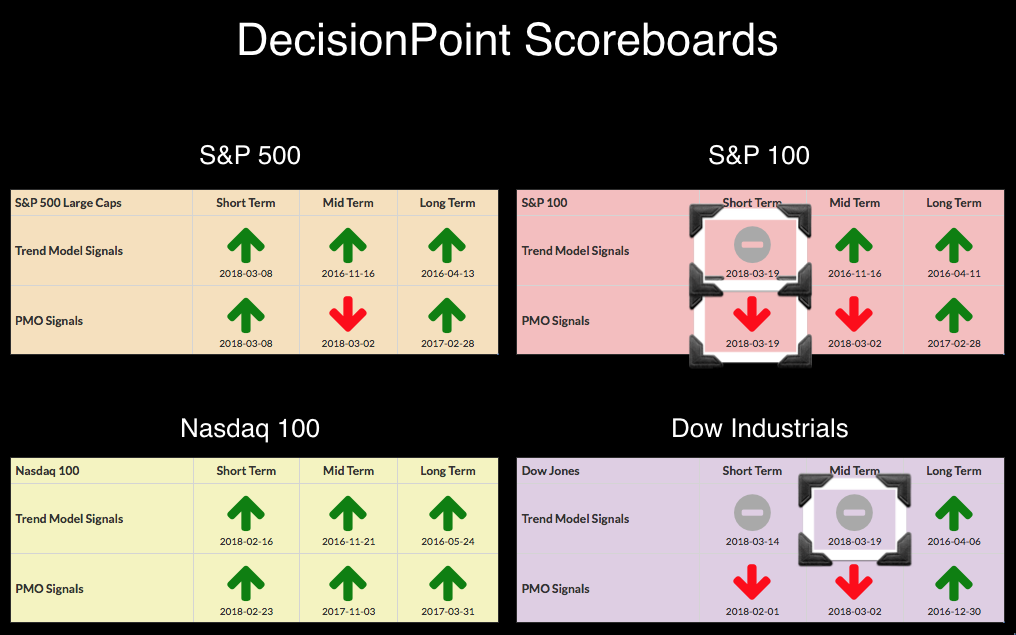
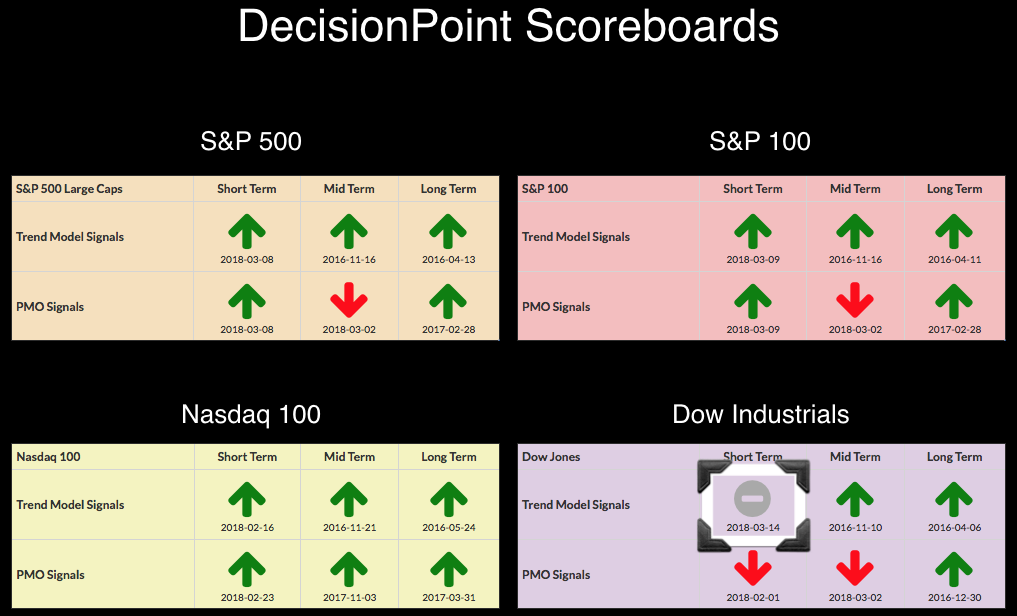
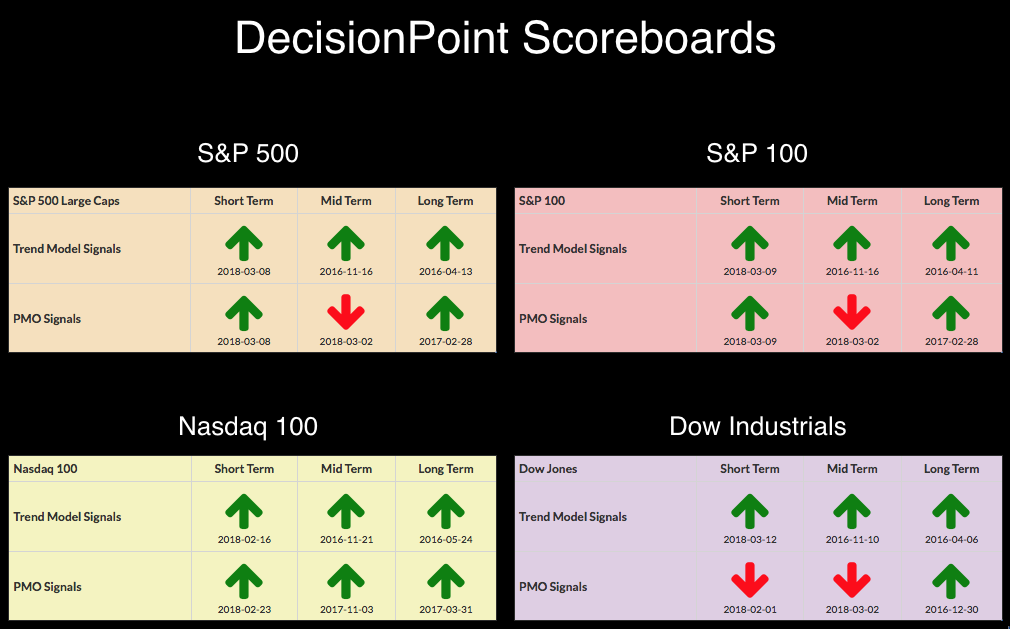
Below you'll find the latest DP Scoreboards. I've included a Sector Scoreboard that Carl and I will keep updated for analysis of sector rotation. The NDX is the only Scoreboard index holding its own. I don't think the NDX is out of the woods...
READ MORE
MEMBERS ONLY

Gold: Is this Another Head Fake or the Beginning of a Move?
by Arthur Hill,
Chief Technical Strategist, TrendInvestorPro.com
* Gold and the Dollar Hit Inflection Points.
* Dollar Bumps Into Short-term Resistance.
* Gold Miners Underperform Gold.
* GDX Tests Low End of Range.
Gold Channels Harden...
For the third time in six weeks, the Gold SPDR (GLD) is surging above the 125 level and making a bid to reverse within a...
READ MORE
MEMBERS ONLY

CRUDE OIL IS NEARING ANOTHER THREE-YEAR HIGH AND BOOSTING ENERGY SHARES -- ENERGY SPDR IS BOUNCING OFF MAJOR TRENDLINE SUPPORT AND 200-DAY AVERAGE -- OIL SERVICE ETF IS EVEN STRONGER -- ENERGY LEADERS ARE TRANSOCEAN, NATIONAL OILWELL, AND HESS

by John Murphy,
Chief Technical Analyst, StockCharts.com
PRICE OF OIL NEARS THREE-YEAR HIGH... WTIC Light Crude is trading more than 2% higher today near $65. The weekly bars in Chart 1 (plotted through yesterday) show Light Crude Oil also nearing another three-year high. Brent crude is in a similar situation. Chart 2 shows the United States Oil...
READ MORE
MEMBERS ONLY

Small-caps Catch a Little March Madness
by Arthur Hill,
Chief Technical Strategist, TrendInvestorPro.com
The S&P SmallCap iShares (IJR) held up better than the S&P 500 SPDR (SPY) during last week's decline and small-caps are outperforming large-caps in 2018.
The chart shows IJR moving above its late February high with a surge above the blue zone in mid-March....
READ MORE
MEMBERS ONLY
I'm Betting On The Gambling Stocks This Spring

by Tom Bowley,
Chief Market Strategist, EarningsBeats.com
Market Recap for Tuesday, March 20, 2018
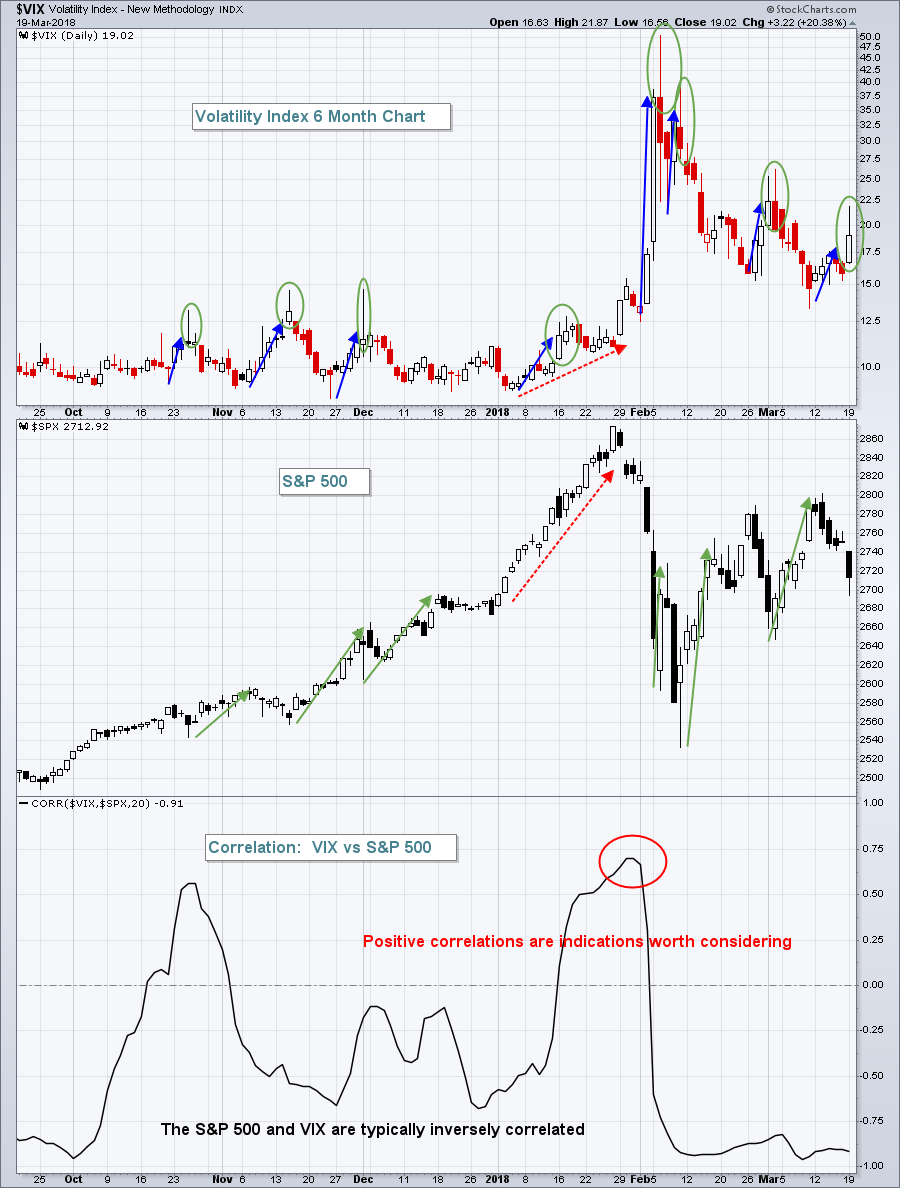
There weren't huge gains on Tuesday, but given how poorly Monday went, I'd say yesterday was a very solid day. On Monday, we saw the Volatility Index ($VIX) spike more than 20% back above 19 as fear ramped up....
READ MORE
MEMBERS ONLY
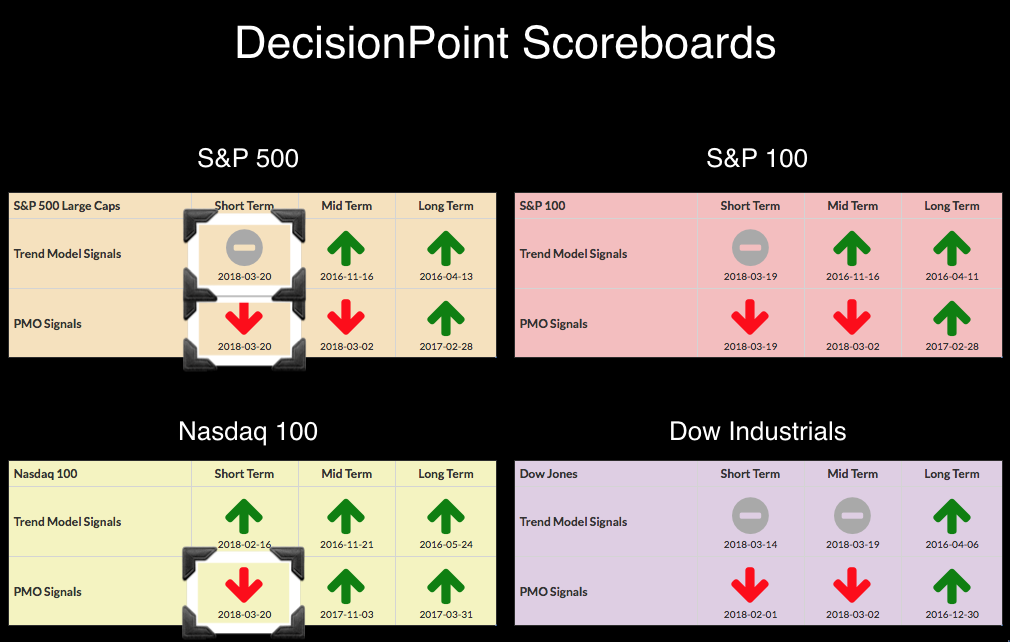
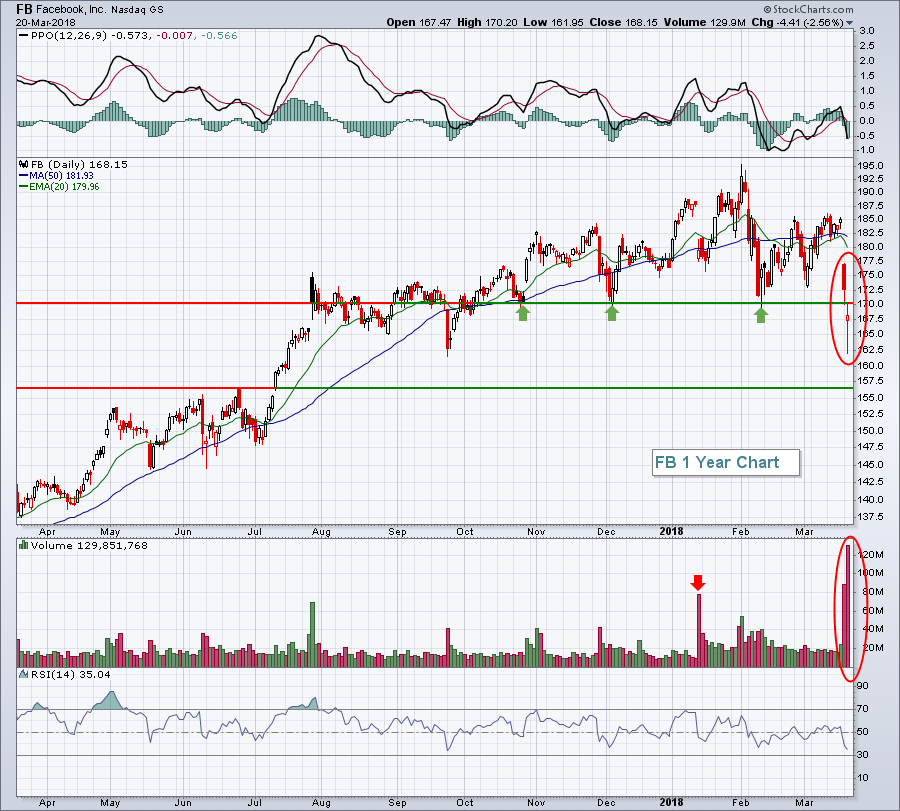
NDX Catches the Bearish Contagion - SPX Loses Both Short-Term BUY Signals
by Erin Swenlin,
Vice President, DecisionPoint.com
Just like dominos, the BUY signals on the DP Scoreboards are toppling and we're finally seeing some deterioration on the NDX. With Facebook (FB) and other technology stocks taking it on the chin the past few days, the NDX is finally succumbing to the downside pressure. A look...
READ MORE
MEMBERS ONLY

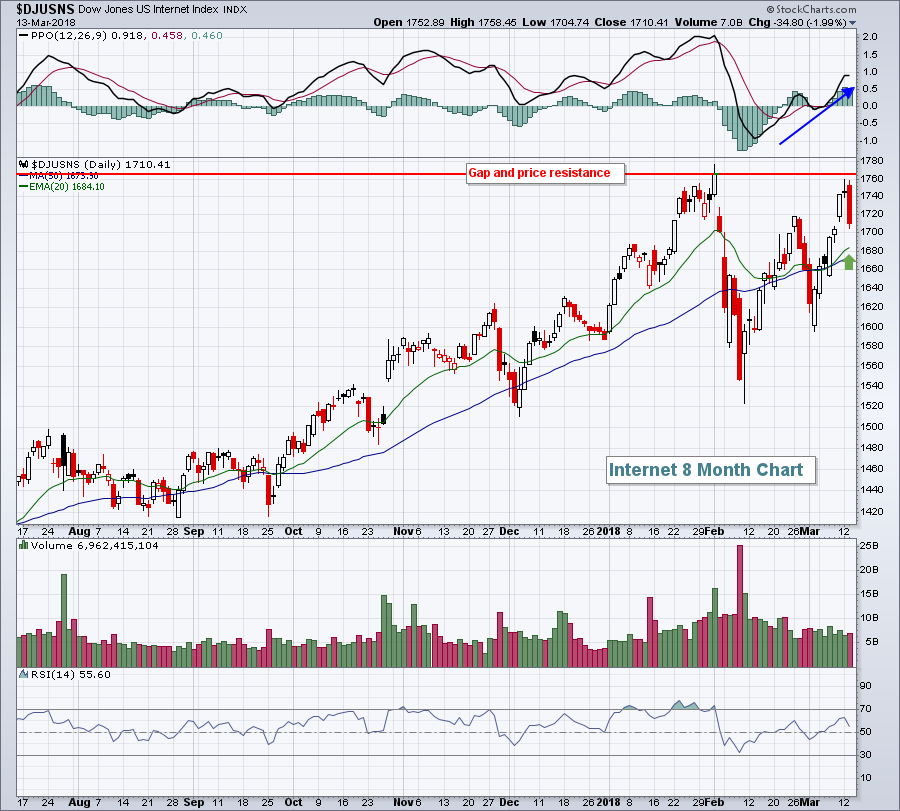
NEGATIVE DIVERGENCE LEADS TO TECH SELLING -- FACEBOOK FALLS TO SIX-MONTH LOW AND LEADS INTERNET GROUP LOWER -- TECH SECTOR MAY BE VULNERABLE TO MORE PROFIT-TAKING -- DOW INDUSTRIALS AND S&P 500 ARE TESTING POTENTIAL TRENDLINE SUPPORT
by John Murphy,
Chief Technical Analyst, StockCharts.com
OVER-EXTENDED TECHNOLOGY SPDR TURNS LOWER... Last Wednesday's message showed the technology sector looking over-extended and vulnerable to profit-taking. So this week's tech selling wasn't too much of a surprise. The daily bars in Chart 1 shows the Technology SPDR (XLK) falling yesterday in heavy...
READ MORE
MEMBERS ONLY
A view on Asset Class rotation and the difference between open and closed universes.

by Julius de Kempenaer,
Senior Technical Analyst, StockCharts.com
Last week I was the guest of Tom and Erin in their Market Watchers Live show on stockcharts.tv.
In that show, I talked about the difference between open and closed universes and what it means for a Relative Rotation Graph and following that discussion we had a look at...
READ MORE
MEMBERS ONLY

SPY Erases the Gap - ITA Bucks the Trend - Focus on Defense Stocks
by Arthur Hill,
Chief Technical Strategist, TrendInvestorPro.com
* Broad Selling in Technology.
* SPY Erases the Gap.
* New Floors and Ceilings.
* Defense Stocks Buck the Selling.
* Six Stocks with Bullish Continuation Patterns.
* Oil Consolidates within an Uptrend.
* Oil and XES Still Positively Correlated.
* XES Battles Retracement Zone.
Broad Selling in Technology ...
The technology sector led the way lower as...
READ MORE
MEMBERS ONLY
Facebook Shares Crater Amid Controversy; Leads Another Big Selloff
by Tom Bowley,
Chief Market Strategist, EarningsBeats.com
Market Recap for Monday, March 19, 2018
Ok, let's start with the obvious. It was an ugly day for U.S. equities. The Dow Jones, S&P 500, NASDAQ and Russell 2000 fell 1.35%, 1.42%, 1.84% and 0.98%, respectively. The Volatility Index ($VIX)...
READ MORE
MEMBERS ONLY
Dow Troubles: New IT Trend Model Neutral Signal - OEX Triggers ST Bearish Signals - Indicators Bearish
by Erin Swenlin,
Vice President, DecisionPoint.com
You'll note three BUY signals were lost today on the Dow and the OEX. The Industrials have been struggling. The Dow was unable to trigger a PMO BUY signal when the other three indexes had managed them with ease. The picture is getting worse for the Dow and...
READ MORE
MEMBERS ONLY

Investors Cut the Cord on Disney
by Arthur Hill,
Chief Technical Strategist, TrendInvestorPro.com
Dow component Disney (DIS) is feeling the heat today with a triangle break and move below the 200-day moving average.
Disney has been one of the weaker stocks in the Dow Industrials over the last few years. The stock peaked way back in August 2015 and formed lower highs the...
READ MORE
MEMBERS ONLY

Building a Rules-Based Trend Following Model - 7

by Greg Morris,
Veteran Technical Analyst, Investor, and Author
This article is a follow up of the previous one in this series - Building a Rules-Based Trend Following Model - 6. Table A is an example of the detailed research behind each of the various indicators used in the weight of the evidence. This example uses over 30 years...
READ MORE
MEMBERS ONLY
Energy And Utilities Fuel Dow Jones Rise
by Tom Bowley,
Chief Market Strategist, EarningsBeats.com
Market Recap for Friday, March 16, 2018
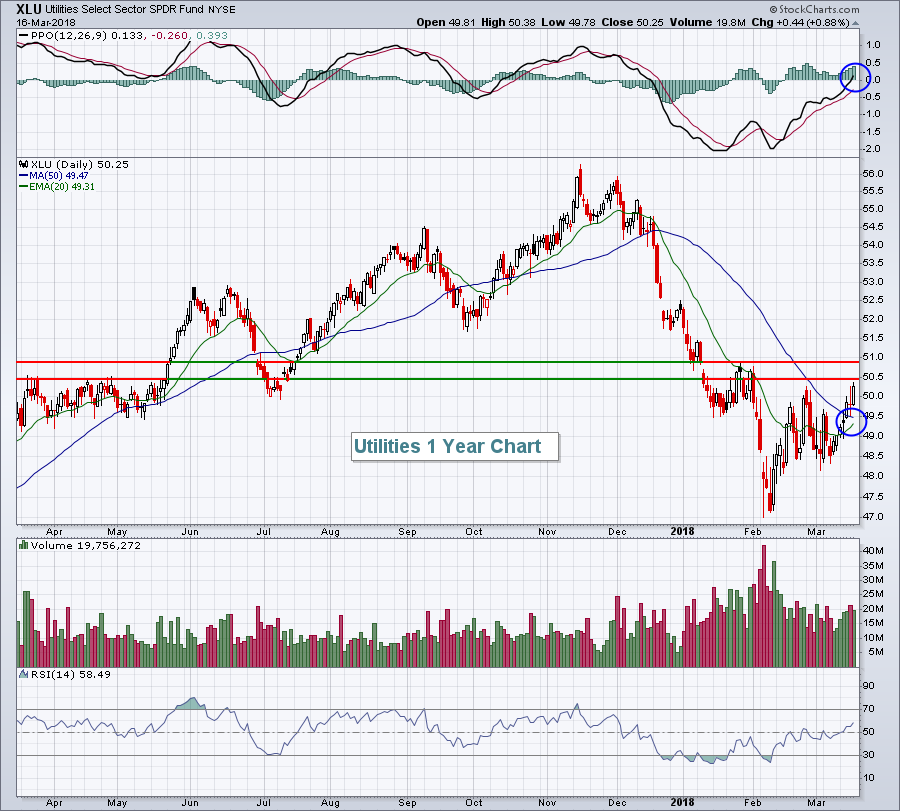
There was an industry-wide rally in energy stocks (XLE, +0.89%) on Friday and utilities (XLU, +0.88%) also performed well. The latter looks much better technically, however, as it has broken above its 50 day SMA. There's still much work...
READ MORE
MEMBERS ONLY
Dow Industrials May Be Forming a Triangle of Their Own
by John Murphy,
Chief Technical Analyst, StockCharts.com
Editor's Note: This article was originally published in John Murphy's Market Message on Thursday, March 15th at 12:34pm ET
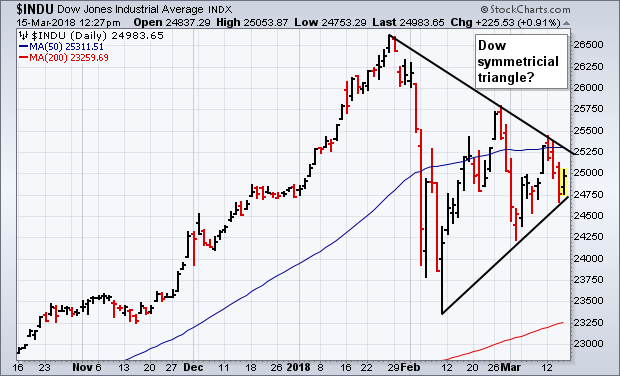
The two converging trendlines in the chart below show the Dow Industrials forming a potential "symmetrical triangle" (which has one trendline falling and the...
READ MORE
MEMBERS ONLY
Here Are Two Seasonal Winners In The NASDAQ 100 For April And May
by Tom Bowley,
Chief Market Strategist, EarningsBeats.com
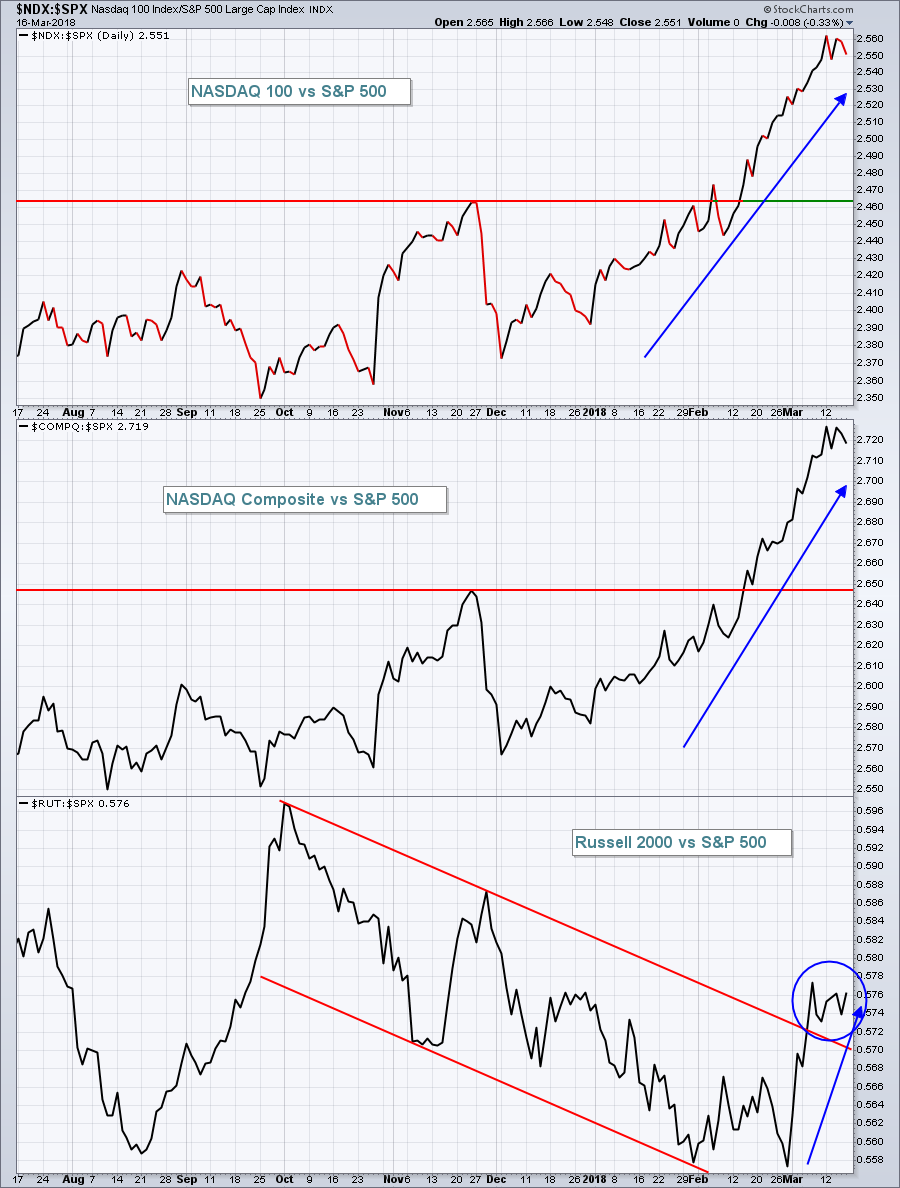
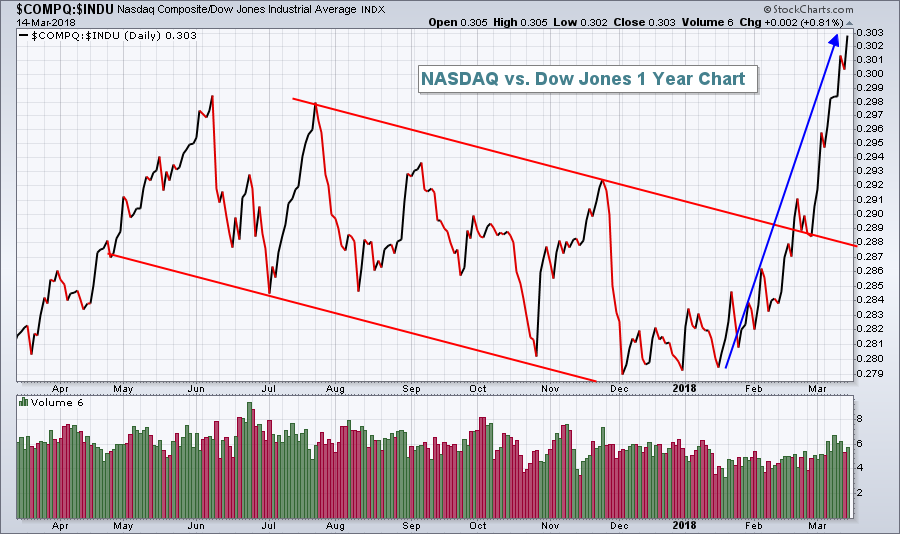
The NASDAQ Composite and NASDAQ 100 became the first two key indices to break to fresh all-time highs and their 2018 relative strength can be underscored by this chart:
The NASDAQ 100 is seeing money rotate its way in 2018 so it's prudent to focus on this index...
READ MORE
MEMBERS ONLY

Dow Industrials Coils Up as Breakout Nears
by Arthur Hill,
Chief Technical Strategist, TrendInvestorPro.com
The Dow Industrials is in the midst of a narrowing consolidation and chartists should watch the March range for the next directional clue.
The 2018 range extends from the January high (26,617) to the February low (23,360), which is 3257 points or around 13% of the current close....
READ MORE
MEMBERS ONLY
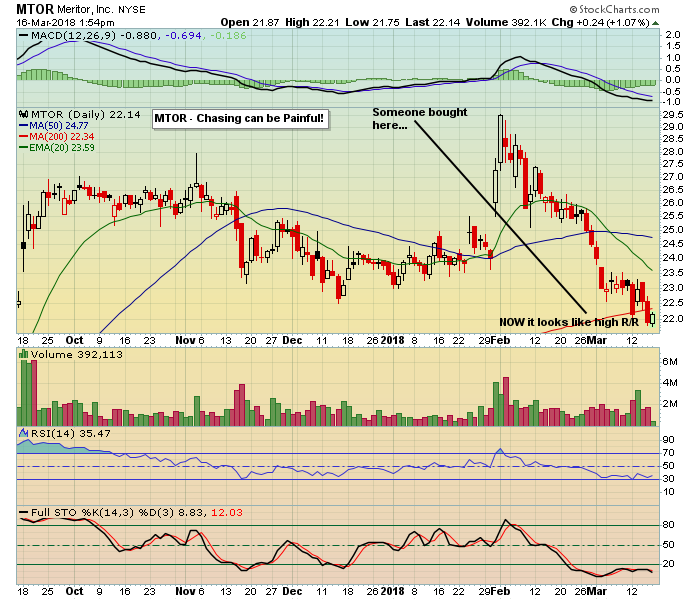
No Need to Rush into a Trade

by John Hopkins,
President and Co-founder, EarningsBeats.com
If there's one thing I've learned over my many years trading in the market, it's to avoid chasing a stock, especially if it's overbought. This might seem like an obvious strategy but many traders are drawn to those stocks that are ascending...
READ MORE
MEMBERS ONLY
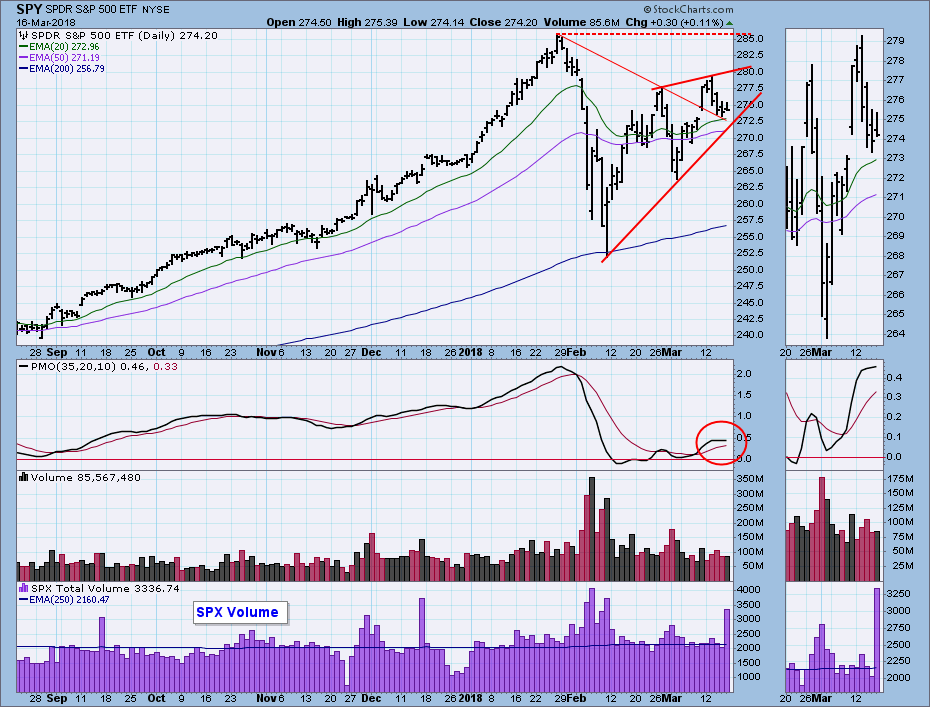
DP Weekly Wrap: Bearish Rising Wedge Appears

by Carl Swenlin,
President and Founder, DecisionPoint.com
First, the super high S&P 500 volume today was because of options expiration, so don't read anything else into it.
Last Friday's encouraging breakout is looking like a short-term bull trap , as the market pulled back to the declining tops line support this week....
READ MORE
MEMBERS ONLY
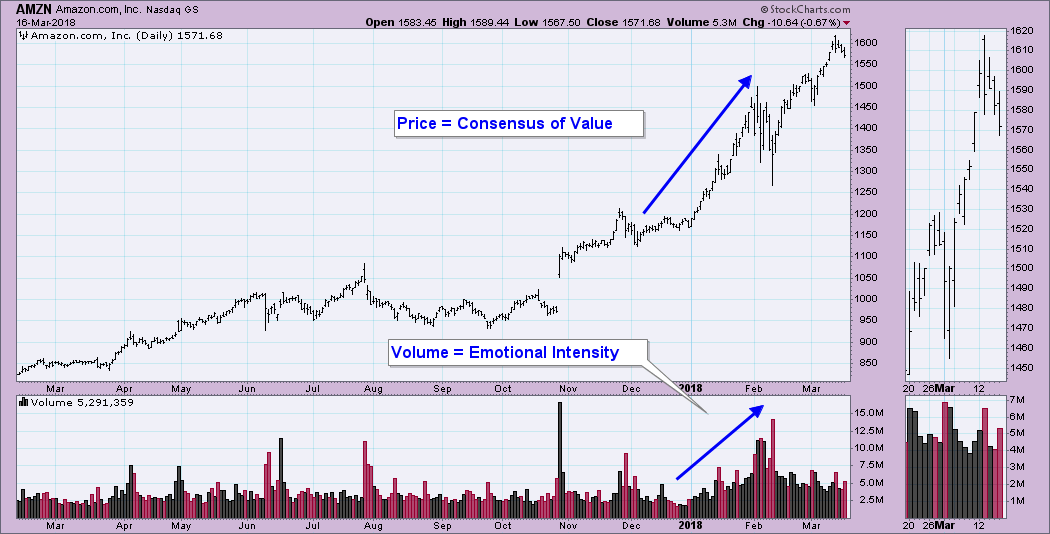
Why Is Volume Important?
by Erin Swenlin,
Vice President, DecisionPoint.com
On Friday's MarketWatchers LIVE program, I did a workshop on volume. Highly recommend you check it out on the StockCharts YouTube Channel or it is available under the webinars tab until Monday's show begins. We talk about volume all the time, but why is understanding and...
READ MORE
MEMBERS ONLY
Bitcoin Is A Mania But Is It Over?

by Martin Pring,
President, Pring Research
* Longer-term perspective
* Short-term Charts
* Dollar trying to break to the upside
Longer-term perspective
At its December 18 peak of $18,723, the Bitcoin Index ($NYXBT) outstripped all other bull markets in recorded history. By this yardstick alone this phenomenon qualifies as a mania. So far, the post high, low water...
READ MORE
MEMBERS ONLY

Two Years of Action Practice Exercises: An Introduction and Index

by Gatis Roze,
Author, "Tensile Trading"
I’ve been teaching investment courses across North America for over 18 years now – in seminars, at conferences, to professional organizations and, most recently, through our own investment education company, Stock Market Mastery. By last count, I’ve had over 5,000 students.
When it comes to different investor types,...
READ MORE
MEMBERS ONLY

Weekly Market Review & Outlook (with Video) - Monitoring the Sector High-Low Lines
by Arthur Hill,
Chief Technical Strategist, TrendInvestorPro.com
* Pop and Drop for Two Key Sectors.
* SPY Approaches First Test.
* High-Low Percent Pops and Drops.
* Sector High-Low Lines Still Rising.
* Big Sectors Remain Mixed.
* Gold Corrects within Correction.
* Treasury Bonds Get Oversold Bounce.
* Funding the Growing Deficit.
* Notes from the Art's Charts ChartList.
The S&P...
READ MORE
MEMBERS ONLY
Several Technical Signs Pointing To A Surge In The US Dollar
by Tom Bowley,
Chief Market Strategist, EarningsBeats.com
Market Recap for Thursday, March 15, 2018
It was just another day of bifurcated action on Wall Street. But this time it featured a strengthening Dow Jones. The Dow gained 0.47%, while the S&P 500, NASDAQ and Russell 2000 fell 0.08%, 0.20% and 0.49%...
READ MORE
MEMBERS ONLY

THE DOW TRANSPORTS ARE ALSO STRUGGLING AT 50-DAY AVERAGE -- BUT MAY BE FORMING ASCENDING TRIANGLE -- THE DOW INDUSTRIALS MAY BE FORMING BULLISH TRIANGLE OF ITS OWN -- THAT WOULD FIT INTO ELLIOTT WAVE FOUR CONSOLIDATION PATTERN
by John Murphy,
Chief Technical Analyst, StockCharts.com
DOW TRANSPORT UPTREND IS ALSO STALLED AT 50-DAY AVERAGE... Yesterday's message showed the Dow Industrials falling below their 50-day average. Today's message shows the Dow Transports doing the same. The daily bars in Chart 1 show the Dow Jones Transportation Average backing off from a test...
READ MORE
MEMBERS ONLY
The Dollar's January Bottom Is Spooking Stocks In This Major Index
by Tom Bowley,
Chief Market Strategist, EarningsBeats.com
Market Recap for Wednesday, March 14, 2018
The U.S. stock market continued its bifurcated ways on Wednesday. While all of our major indices declined, it was not across-the-board selling. The Dow Jones (-1.00%) saw the brunt of the selling, while the NASDAQ Composite (-0.19%) outperformed by a...
READ MORE
MEMBERS ONLY
Dow's Weakness and DP Indicators Suggest Gloomy Short Term
by Erin Swenlin,
Vice President, DecisionPoint.com
It was only yesterday that I added a new BUY signal to the Dow's Scoreboard and today, it's already gone. The Short-Term Trend Model (STTM) is based on 5/20-EMA crossovers. The Dow's 5-EMA crossed below the 20-EMA while it was above the 50-EMA--that...
READ MORE
MEMBERS ONLY

Centene Moves to Recapture 50-day SMA
by Arthur Hill,
Chief Technical Strategist, TrendInvestorPro.com
Centene (CNC), which is part of the healthcare sector, sports a steady uptrend over the past year and recently surged towards its 50-day SMA.
First and foremost, the long-term trend is clearly up because the stock recorded a 52-week high in January, the 50-day SMA is above the 200-day SMA...
READ MORE
MEMBERS ONLY

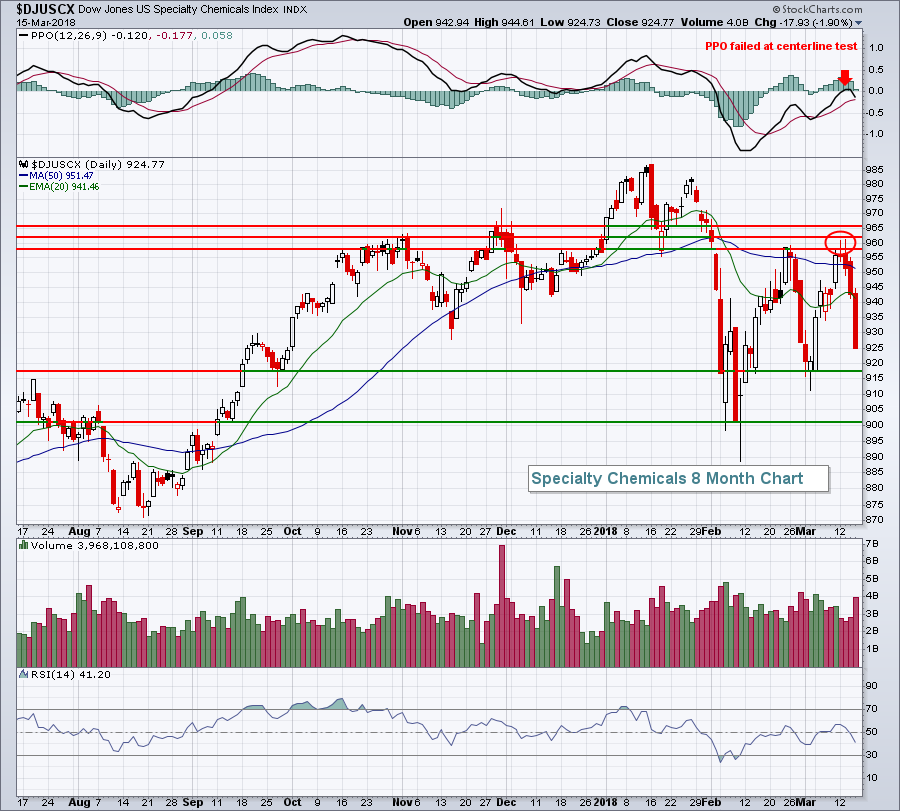
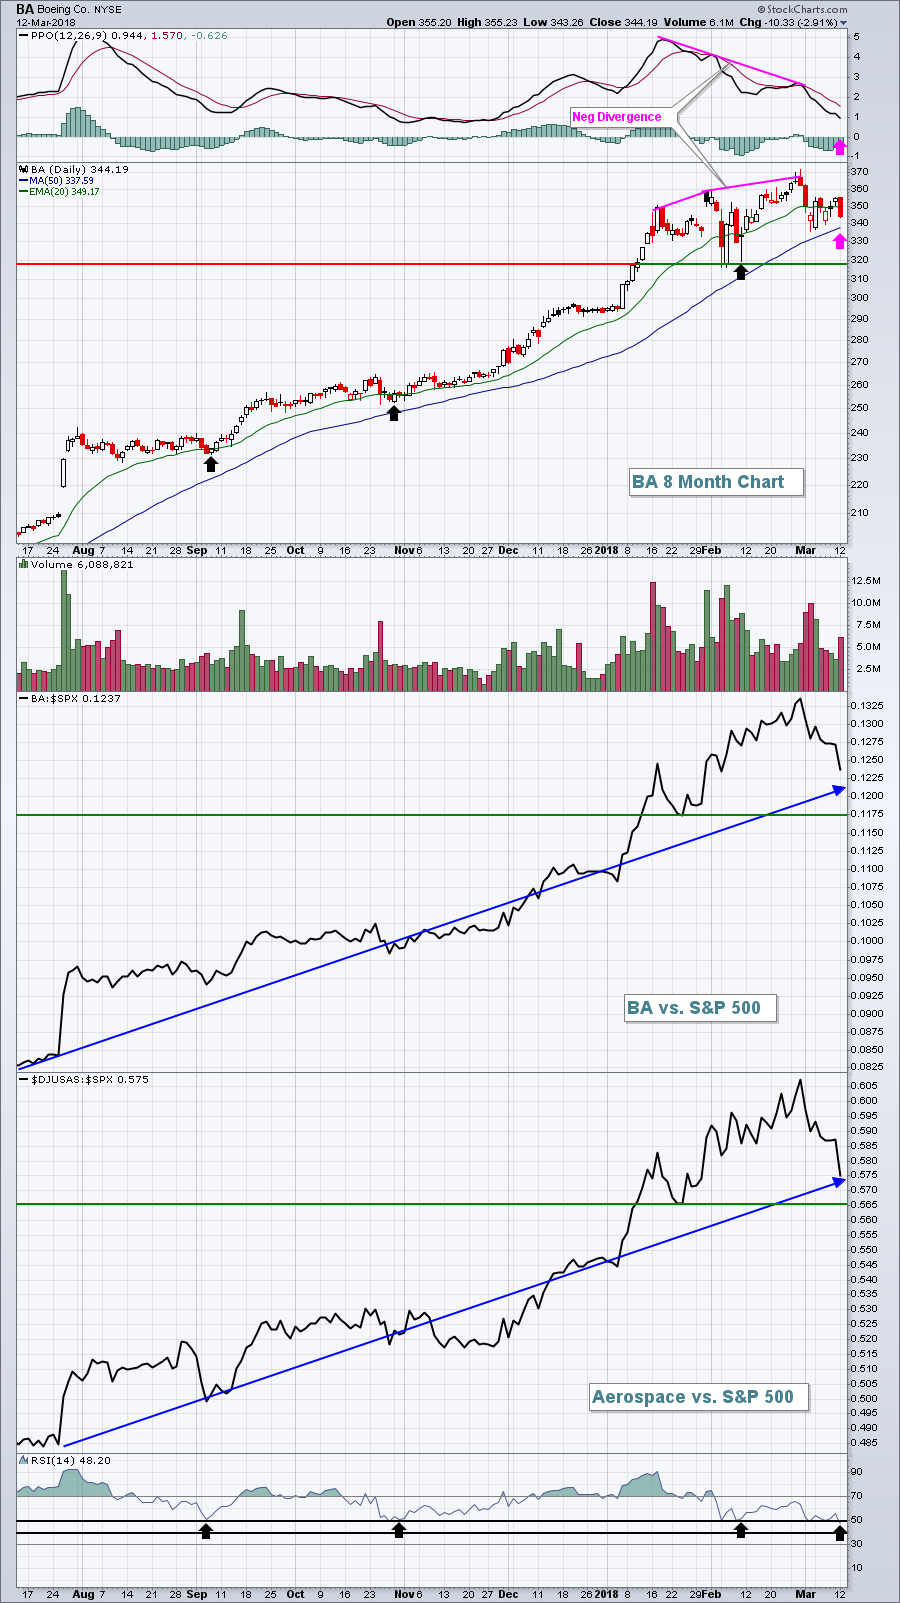
STOCK UPTREND WEAKENS -- INDUSTRIAL SPDR RUNS INTO RESISTANCE AT 50-DAY LINE -- BOEING LEADS AEROSPACE LOWER -- ALUMINUM AND CHEMICALS PULL MATERIALS SPDR LOWER -- DOW INDUSTRIALS FALL BELOW 50-DAY LINE AS S&P 500 STALLS AT FEBRUARY HIGH
by John Murphy,
Chief Technical Analyst, StockCharts.com
BOEING LEADS INDUSTRIAL SPDR BELOW ITS 50-DAY LINE... The stock rally is starting to lose some upside momentum. That's partially because some market sectors are running into resistance at their 50-day moving average. The daily bars in Chart 1 show the Industrial Sector SPDR (XLI) slipping back below...
READ MORE
MEMBERS ONLY
Internet, Technology Stocks Lead Southbound Train
by Tom Bowley,
Chief Market Strategist, EarningsBeats.com
Market Recap for Tuesday, March 13, 2018
It appears to be a case of "too much of a good thing". Technology stocks (XLK, -1.15%) retreated off of a 60 minute negative divergence and that reverberated throughout most parts of the NASDAQ (-1.02%), which led our major...
READ MORE
MEMBERS ONLY

Non-confirmations Persist, but Bulls have the Edge in this Stock Pickers Market
by Arthur Hill,
Chief Technical Strategist, TrendInvestorPro.com
* Non-confirmations Continue to Nag.
* Setting the Benchmark Highs.
* RSP Sector Weights are Quite Different.
* EW Consumer Discretionary and Industrials Lag.
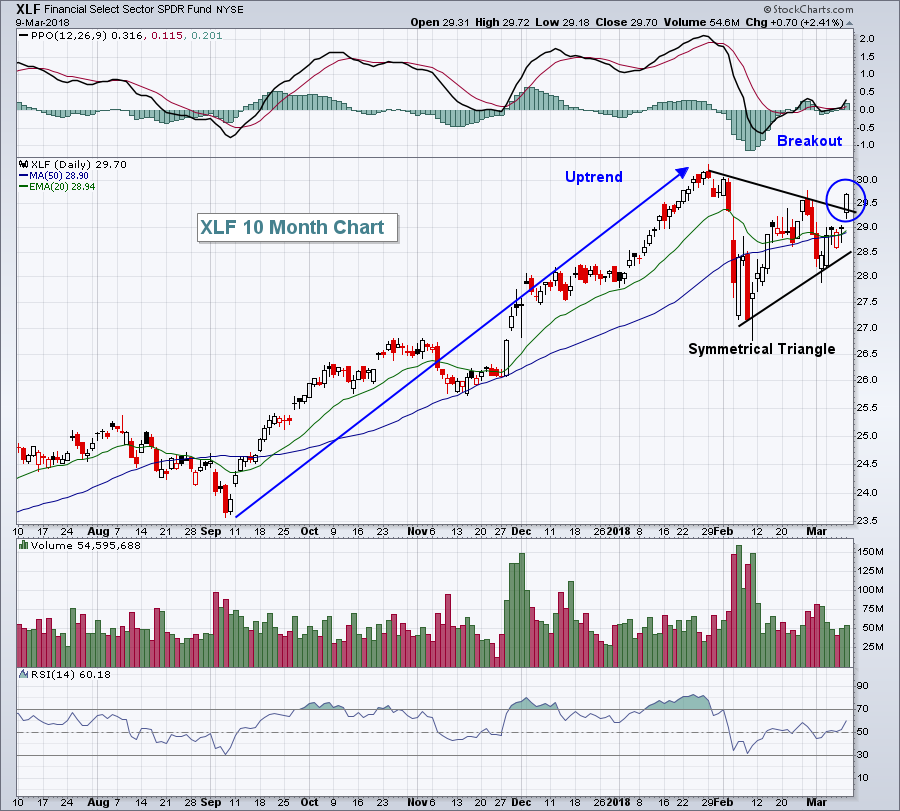
* XLF and XLY Trigger Triangle Breaks.
* A Stock Picker's Market.
Non-confirmations Continue to Nag...
The Nasdaq 100 brothers, Nasdaq Composite and Nasdaq 100, were the only two major...
READ MORE
MEMBERS ONLY
Tesla, Autos Gain Traction As NASDAQ Records 2nd Straight Record
by Tom Bowley,
Chief Market Strategist, EarningsBeats.com
Market Recap for Monday, March 12, 2018
While we saw bifurcated action on Monday, it was still mostly bullish action. For starters, the more aggressive NASDAQ (+0.36%) and Russell 2000 (+0.25%) finished in positive territory while the safer indices - Dow Jones (-0.62%) and S&P...
READ MORE
MEMBERS ONLY
DP Bulletin: OEX & Dow Get New Buy Signals
by Erin Swenlin,
Vice President, DecisionPoint.com
On Friday, the OEX managed to get both a new Short-Term Trend Model (STTM) BUY signal and a Short-Term Price Momentum Oscillator (PMO) BUY signal. At the time the Dow was the only Scoreboard to not have ST buy signals. Today that changed with a new STTM Buy signal for...
READ MORE
MEMBERS ONLY
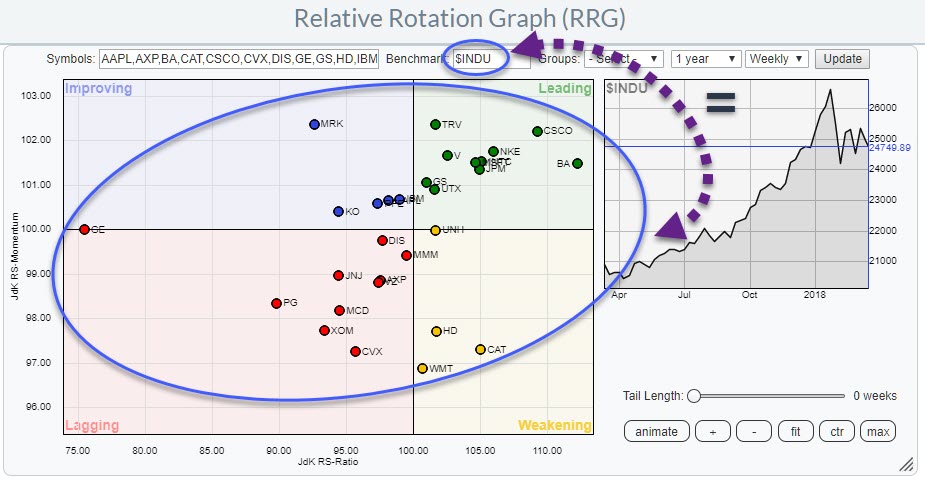
Scanning 30 Dow stocks in two minutes on a Relative Rotation Graph
by Julius de Kempenaer,
Senior Technical Analyst, StockCharts.com
In this blog, I will take another look at the 30 stocks that make up the DJ Industrials index.
A quick look learns that the real outsider in this index is GE which is positioned far to the left on the RRG, moving higher (almost vertical) on the JdK RS-Momentum...
READ MORE
MEMBERS ONLY

Momentum and Money Flow Take a Turn in LabCorp
by Arthur Hill,
Chief Technical Strategist, TrendInvestorPro.com
Laboratory Corporation of America Holdings (LH) is looking bullish as the Moving Average Convergence Divergence (MACD) turns up and Chaikin Money Flow pops.
On the price chart, the long-term trend is up because LH hit a new high in January, the 50-day EMA is above the 200-day EMA and price...
READ MORE
MEMBERS ONLY

Measuring the Weight of the Evidence with Breadth Indicators
by Arthur Hill,
Chief Technical Strategist, TrendInvestorPro.com
* Breadth Indicators Strengthen.
* Nasdaq 100 Leads AD Percent Rebound.
* $SPX High-Low% Signals End of Correction.
* Large-caps Lead %Above 200-day EMA.
* Broad Market Breadth Table.
* Sector Breadth Table.
* Links for Sector Breadth Charts.
Breadth Indicators Strengthen...
A couple of breadth indicators flipped from bearish to bullish with last week's...
READ MORE
MEMBERS ONLY
Huge Jobs Report Sends NASDAQ To All-Time Highs
by Tom Bowley,
Chief Market Strategist, EarningsBeats.com
Market Recap for Friday, March 9, 2018
The U.S. stock market was back to its old bull market tricks on Friday as the NASDAQ powered 133 points higher (+1.79%) to close at 7560.81 - its highest ever - and end its correction that began with the high...
READ MORE
MEMBERS ONLY

Building a Rules-Based Trend Following Model - 6
by Greg Morris,
Veteran Technical Analyst, Investor, and Author
It is time to start getting into the measures/indicators to be used in the model. Note: When I was presenting at the big wire houses, I used the term measures as seemed to be easier for advisors to understand. Now, dealing primarily with technical analysts, indicators seems more appropriate....
READ MORE
MEMBERS ONLY

Combining Wyckoff and Relative Strength to Find Big Trends

by Bruce Fraser,
Industry-leading "Wyckoffian"
In stock chart analysis the closest thing to X-Ray vision is Relative Strength. Often Relative Strength provides us with early price direction clues. Generally, when Relative Strength (RS) is in a rising trend and price is in a rising trend, this trend will persist. We define a trend as higher...
READ MORE