MEMBERS ONLY
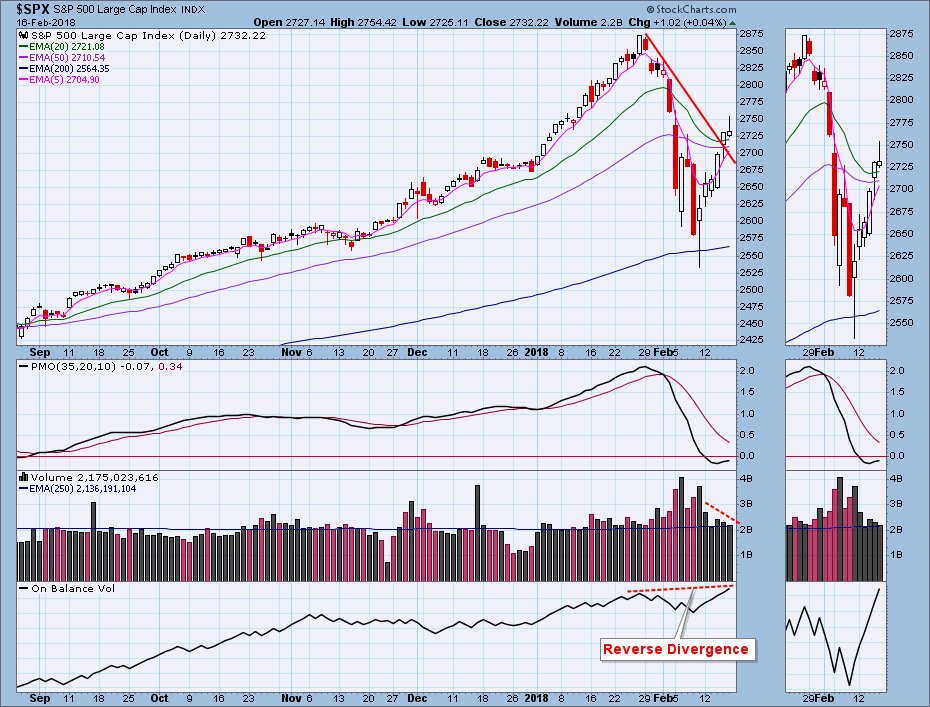
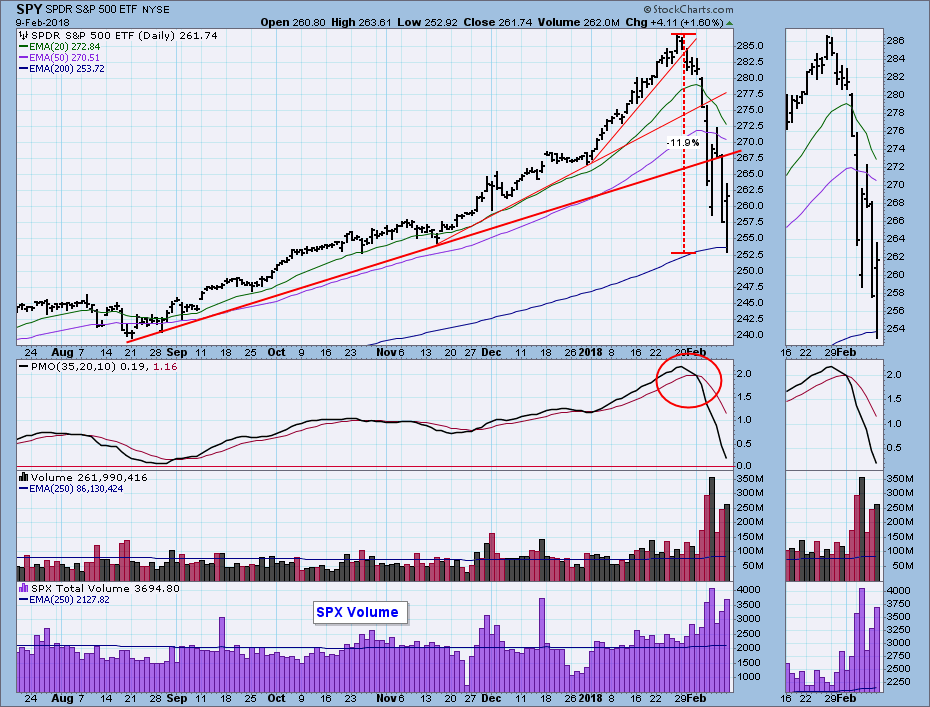
DP Weekly Wrap: Bear Market Rally Over?

by Carl Swenlin,
President and Founder, DecisionPoint.com
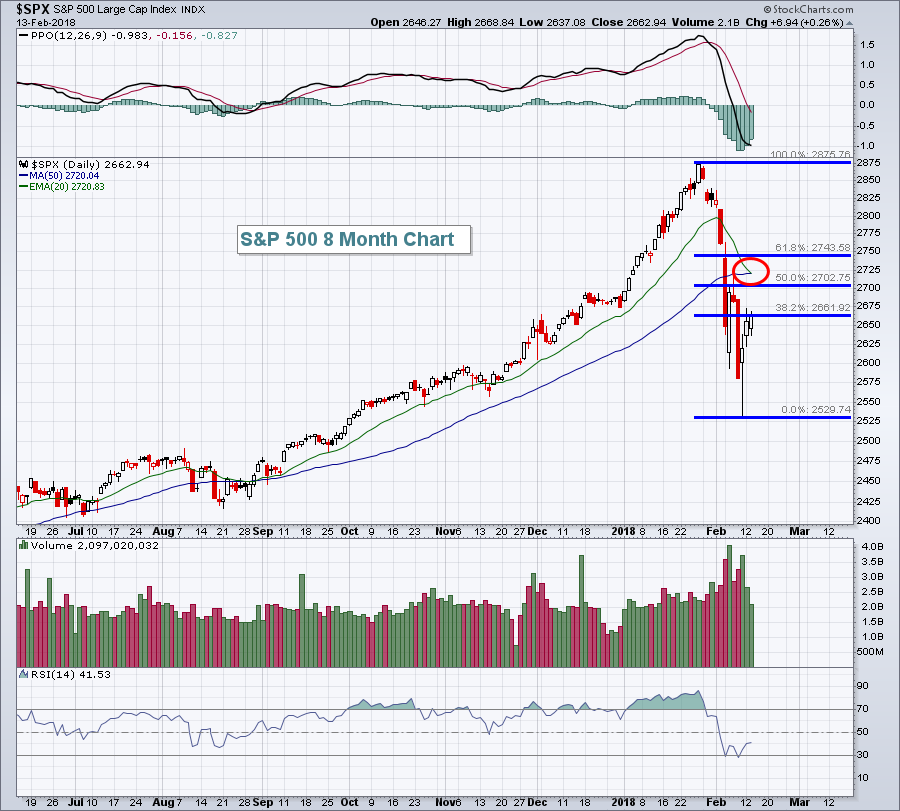
Last Friday the market executed a bullish intraday reversal, and this week it rallied five days straight; however, there were some problems. S&P 500 volume contracted into the rally, and Friday's candlestick was a bearish shooting star. I don't really use candlesticks much, but...
READ MORE
MEMBERS ONLY
Bull or Bear Market Rules?

by Erin Swenlin,
Vice President, DecisionPoint.com
Today on MarketWatchers LIVE, I did a workshop on bull and bear market rules. You'll hear many technicians discuss "bull market rules apply" or vice versa. The question is pertinent and timely right now. The jury is still out on whether we are about to enter...
READ MORE
MEMBERS ONLY

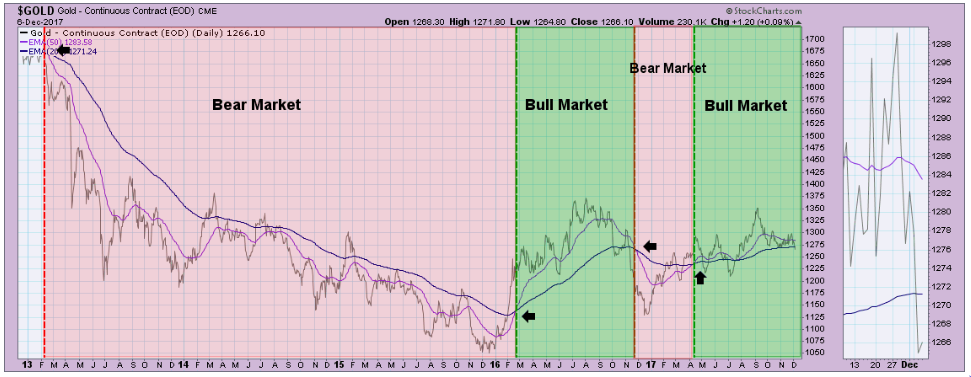
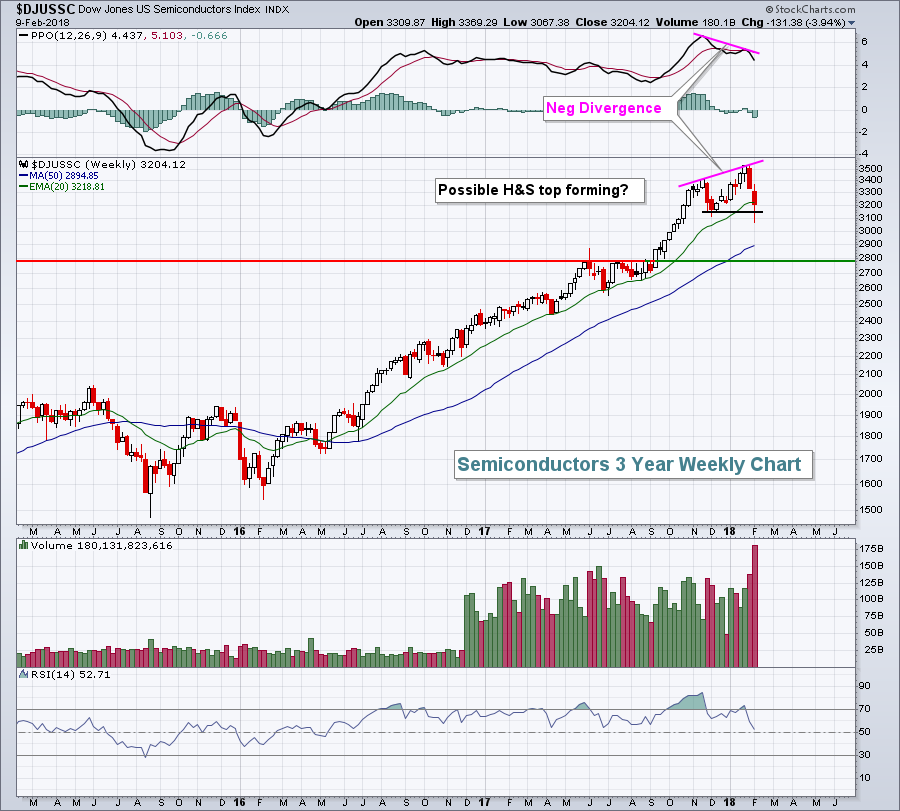
RECENT PULLBACK IN COMMODITIES IS LIKELY TIED TO STOCK CORRECTION -- COPPER AND OIL ARE STILL IN UPTRENDS -- AND GOLD MAY BE NEAR A BULLISH BREAKOUT -- GOLD MAY GET AN ADDITIONAL LIFT FROM THIS WEEK'S BULLISH BREAKOUT IN THE YEN TO A FIFTEEN MONTH HIGH

by John Murphy,
Chief Technical Analyst, StockCharts.com
COMMODITY PULLBACK IS TIED TO STOCKS... My January 27 message wrote about a bullish breakout in commodity prices to the highest level in two years. I took that as another sign that inflation pressures were starting to build. The weekly bars in Chart 1 show that bullish breakout taking place...
READ MORE
MEMBERS ONLY

Two Icons Reveal the Same Secret to Success

by Gatis Roze,
Author, "Tensile Trading"
Steve Jobs famously challenged everyone when he said, “We’re here to put a dent in the universe. Otherwise, why else be here?”
I was fortunate recently to spend a couple of days in Napa Valley at the DENT 2018 conference. There’s nothing like spending quality time with lots...
READ MORE
MEMBERS ONLY

Weekly Market Review & Outlook (with Video) - Rubber Band Rebound

by Arthur Hill,
Chief Technical Strategist, TrendInvestorPro.com
* Rubber Band Rebound.
* A Bearish Breadth Thrust.
* High-Low Percent Indicators Weaken.
* %Above Indicators Remain Bullish.
* Weight of the Evidence.
* SPX Clears 50-day as VIX Falls.
* Small-caps Take the Internal Lead.
* Scan Code for Top ROC.
* Tech-Related Industry Groups Lead.
* Notes from the Art's Charts ChartList.
Rubber Band Rebound...
READ MORE
MEMBERS ONLY
Grading The Current Rally - Is It Sustainable?

by Tom Bowley,
Chief Market Strategist, EarningsBeats.com
Market Recap for Thursday, February 15, 2018
Selling is inevitable during bull markets. After each leg higher, there's typically a period of selling/consolidation. The bulls were spoiled for several months, as the bull market advance continued nearly uninterrupted. There really hadn't been any notable selling...
READ MORE
MEMBERS ONLY

Painting the US equity landscape using Relative Rotation Graphs

by Julius de Kempenaer,
Senior Technical Analyst, StockCharts.com
Relative Rotation Graphs are a great tool to visualize sector rotation and that is probably where you will see them applied most. But they can be used for so many more (rotational) variations of different universes or similar universes in a different way.
In this post, I will show you...
READ MORE
MEMBERS ONLY

Time For Some Temporary Grief In The Equity Market?

by Martin Pring,
President, Pring Research
* Path of recoveries from recent declines have been mixed
* S&P is at short-term resistance
* Some reliable short-term indicators not quite there yet
* Yen breaks out from a large base
Path of recoveries from recent declines have been mixed
After five straight up days since the February 9 intraday...
READ MORE
MEMBERS ONLY

Oil Bounces off Breakout Zone - Plus XES, HAL and an S&P 500 Update
by Arthur Hill,
Chief Technical Strategist, TrendInvestorPro.com
* Indicators Improve as S&P 500 Follows Through.
* A Retest of the February Low?
* Monitoring the Pennant Breakout.
* Oil Bounces off Breakout Zone.
* Use Continuous Contract Long-Term.
* Oil & Gas Equip & Services SPDR Firms.
* Haliburton Returns to Breakout Zone.
Indicators Improve as S&P 500 Follows Through...
READ MORE
MEMBERS ONLY
Wall Street Shakes Off Inflation Worries, Retail Slump; Rallies For 4th Straight Session
by Tom Bowley,
Chief Market Strategist, EarningsBeats.com
Market Recap for Wednesday, February 14, 2018
Wall Street sure did look like it was heading for a very rough day at 8:30am EST on Wednesday. Very poor economic news hit traders with a 1-2 punch as the consumer price index jumped 0.5% instead of the 0.3%...
READ MORE
MEMBERS ONLY

DP Alert: Bullish Indicators - Gold Surges...For Now
by Erin Swenlin,
Vice President, DecisionPoint.com
The DecisionPoint Scoreboards didn't show any improvement from last week as the neutral and sell signals remained in the short term. PMO SELL signals are not yet on the weekly charts for these indexes, but they are lining up. If we see a pullback on the recent rally,...
READ MORE
MEMBERS ONLY

STOCKS RECOVER FROM HIGHER INFLATION REPORT -- NASDAQ 100 IS FIRST INDEX TO REACH 50-DAY LINE -- BANK ETF GAINS MORE GROUND ON RISING YIELDS -- WHILE UTILITIES FALL -- JUMP IN GOLD PUTS IT CLOSER TO MAJOR UPSIDE BREAKOUT -- VIX DROPS TO 20
by John Murphy,
Chief Technical Analyst, StockCharts.com
MAJOR STOCK INDEXES BOUNCE BACK FROM EARLY SELLING ... January's CPI report came in higher than expected and caused stocks to open lower. The headline reading of 2.1% and core reading (excluding food and energy) of 1.8% were higher than economists were expecting. After opening lower, stocks...
READ MORE
MEMBERS ONLY

A Short-term Disconnect between VIX and SPY - Watch the Pennant
by Arthur Hill,
Chief Technical Strategist, TrendInvestorPro.com
There is another disconnect working between the VIX and SPY. The S&P 500 SPDR (SPY) opened weak with a dip below 265, but the S&P 500 Volatility Index ($VIX) also declined. This is an interesting dynamic because the VIX usually moves opposite of SPY. I am...
READ MORE
MEMBERS ONLY
This Might Very Well Be The Best Investment Over The Next 6-12 Months
by Tom Bowley,
Chief Market Strategist, EarningsBeats.com
Market Recap for Tuesday, February 13, 2018
The U.S. stock market settled down on Tuesday, trading in a much narrower range, and finished with gains across its major indices for the third consecutive day. While it was good to see the market stabilize after such panicked selling, there remains...
READ MORE
MEMBERS ONLY
Indicators Turning Up But is Correction Over?
by Erin Swenlin,
Vice President, DecisionPoint.com
The question that continues to arise this month is, "Is it over?". This correction was deeper than many expected or was about as deep as expected but it occurred so quickly. I'm finally getting some good news on my intermediate-term indicators, but not enough for me...
READ MORE
MEMBERS ONLY

REGIONAL BANK SPDR EXCEEDS 50-DAY AVERAGE -- LEADERS INCLUDE M&T BANK, BB&T CORP, AND REGIONS FINANCIAL -- JPM IS ANOTHER BANK LEADER -- TRANSPORTS BOUNCE OFF 200-DAY AVERAGE -- WEAK DOLLAR BOOSTS METALS -- STOCK REBOUND STILL HAS FURTHER TO GO
by John Murphy,
Chief Technical Analyst, StockCharts.com
REGIONAL BANK SPDR CLEARS 50-DAY AVERAGE... One of the simplest ways to determine which stock groups, or individual stocks, are leading the market higher is to look for the ones that are clearing their 50-day moving averages first (or stayed above them). Yesterday's message showed the Consumer Discretionary...
READ MORE
MEMBERS ONLY

Expansion in New Lows Points to Extended Correction
by Arthur Hill,
Chief Technical Strategist, TrendInvestorPro.com
As with Charles Dow, I work under the assumption that the trend is in force until proven otherwise. And, in accordance with Dow Theory, neither the length nor the duration can be forecast. We can, however, identify trend changes and act accordingly.
The stock market is in a delicate spot...
READ MORE
MEMBERS ONLY
Apple Rebounds, Leads Technology Higher As Wall Street Gains For Second Straight Day
by Tom Bowley,
Chief Market Strategist, EarningsBeats.com
Market Recap for Monday, February 12, 2018
Wall Street saw more gains on Monday, continuing the strength we saw late during the Friday session. Most of the strength, however, came during the morning session as the benchmark S&P 500 hit 2660, rising 130 points or approximately 5%, off...
READ MORE
MEMBERS ONLY

STOCKS ARE BUILDING ON FRIDAY'S UPSIDE REVERSAL FROM 200-DAY AVERAGE -- THE NEXT TEST WILL COME AT 50-DAY AVERAGES -- SMALL AND MIDSIZE STOCK INDEXES ALSO BOUNCE OFF 200-DAY LINES
by John Murphy,
Chief Technical Analyst, StockCharts.com
MARKETS MOVE FURTHER AWAY FROM 200-DAY LINE... Stocks continue to build on the upside reversal that took place on Friday from 200-day moving averages. The daily bars in Chart 1 show the S&P 500 gaining enough ground today to climb back over its 100-day line (green line). The...
READ MORE
MEMBERS ONLY
CME Group Embraces Volatility and Bucks Selling Pressure
by Arthur Hill,
Chief Technical Strategist, TrendInvestorPro.com
The CME Group (CME), which has a number of volatility-based futures products, runs a variety of futures and options exchanges including the CME, CBOT, NYMEX and COMEX.
While the S&P 500 fell 8.82% over the last two weeks, CME Group actually gained ground and advanced 1.09%...
READ MORE
MEMBERS ONLY
U.S. Equities Recover, Stocks To Consider On A Rebound
by Tom Bowley,
Chief Market Strategist, EarningsBeats.com
Market Recap for Friday, February 9, 2018
For the first time in 18 months, the Dow Jones, S&P 500 and NASDAQ all closed out a week beneath their rising 20 week EMAs. After not seeing a meaningful pullback (more than 3%) for well over a year, our major...
READ MORE
MEMBERS ONLY
Thoughts on the Current Market

by Greg Morris,
Veteran Technical Analyst, Investor, and Author
I rarely, if ever, discuss the current market or offer any market analysis. StockCharts.com has many expert technical analysts that already do a bang up job on this. However, since I am writing a series on Building a Rules-Based Trend Following Model, I thought I would tell you how...
READ MORE
MEMBERS ONLY
Bonds Get Clipped

by Bruce Fraser,
Industry-leading "Wyckoffian"
As stocks have been getting roiled over the last two weeks, bonds have been somewhat overlooked. Bond prices began dropping in December 2017, and possibly contributed to the weakness in stock prices weeks later. It has been about a year since we have looked at treasury bonds. What are they...
READ MORE
MEMBERS ONLY
US Stock Traders Get Out Their Hammers
by Martin Pring,
President, Pring Research
* Bottoms are being “hammered” out
* VIX is quietening down
* Net new highs offer green shoots
* NASDAQ Chart is turning
Bottoms are being “hammered” out
It has certainly been a wild ride this week, but Friday saw several major indexes trace out a Japanese candlestick pattern known as a “hammer”. This...
READ MORE
MEMBERS ONLY
DP Weekly Wrap: Think Bear Market
by Carl Swenlin,
President and Founder, DecisionPoint.com
Last week I asserted that the character of the market had changed from super bullish to normal bullish, by which I meant that we should start to see more normal bull market corrections. On Monday I quickly revised that opinion and told Erin that I thought we may have entered...
READ MORE
MEMBERS ONLY

AN OVERSOLD S&P 500 IS TRYING TO STABILIZE AT ITS 200-DAY MOVING AVERAGE -- THE VIX INDEX IS PULLING BACK FROM RESISTANCE ABOVE THE 40 LEVEL FOR THE SECOND TIME THIS WEEK
by John Murphy,
Chief Technical Analyst, StockCharts.com
S&P 500 IS TESTING ITS 200-DAY AVERAGE ... The downside correction that started a week ago pushed stock prices lower again today. But they're trying to stabilize in afternoon trading. Chart 1 shows the S&P 500 trying to find support at its 200-day moving average....
READ MORE
MEMBERS ONLY

Weekly Market Review & Outlook (with Video) - The Main Driver for Stock Prices
by Arthur Hill,
Chief Technical Strategist, TrendInvestorPro.com
* The Main Driver for Stocks.
* Rate-of-Change Reaches an Extreme.
* Two Relatively Clean Bottoms.
* A Messy Bottom in 2011.
* Watching the 200-day First.
* Notes from the Art's Charts ChartList.
The Main Driver for Stock Prices
Today's report will focus on the S&P 500 because the...
READ MORE
MEMBERS ONLY
A High VIX Means Irrational Market Swings
by Tom Bowley,
Chief Market Strategist, EarningsBeats.com
Market Recap for Thursday, February 8, 2018
For now, forget about the strong earnings season that we just witnessed. Also, forget about bond yields rising, which I view as a very bullish development generally-speaking as it allows money to rotate from the more defensive bond market to the more aggressive...
READ MORE
MEMBERS ONLY
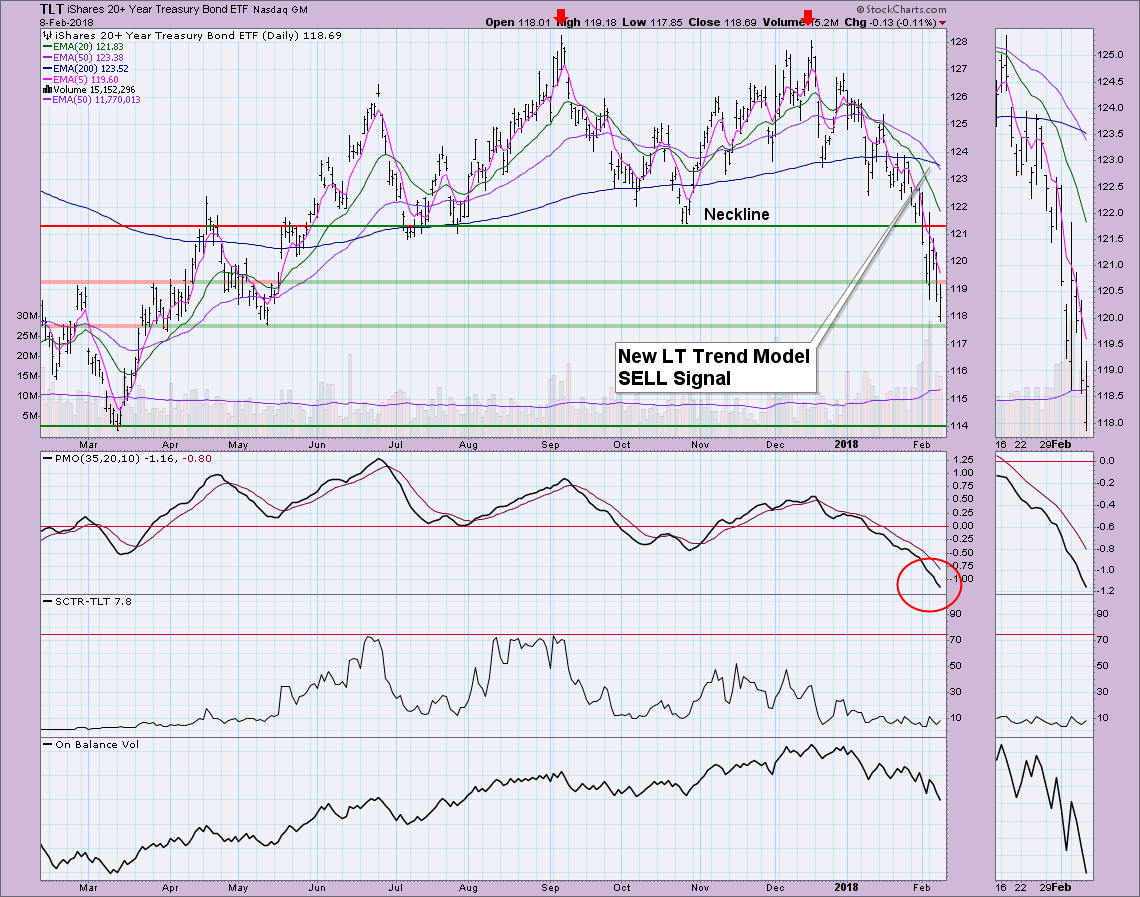
DP Bulletin: TLT New Long-Term Trend Model SELL Signal - ST Indicators Extremely Oversold
by Erin Swenlin,
Vice President, DecisionPoint.com
Two charts you should look at now. I mentioned yesterday that TLT was going to see a Long-Term Trend Model SELL signal today and it did. Additionally, ST indicators which had turned up have turned back down and have reached down into very oversold extremes.
While the PMO may appear...
READ MORE
MEMBERS ONLY

STOCK INDEXES ARE RETESTING INTRA-DAY SUPPORT LEVELS FORMED ON TUESDAY -- THE REBOUND IN THE VIX IS MUCH WEAKER THAN ON TUESDAY
by John Murphy,
Chief Technical Analyst, StockCharts.com
MAJOR STOCK INDEXES ARE RETESTING TUESDAY'S INTRA-DAY LOWS... Stocks are falling sharply again today and are in the process of retesting intra-day support levels formed on Tuesday. That's an important test. The 10-minute bars in Chart 1 shows the Dow Industrials testing lows formed Tuesday between...
READ MORE
MEMBERS ONLY
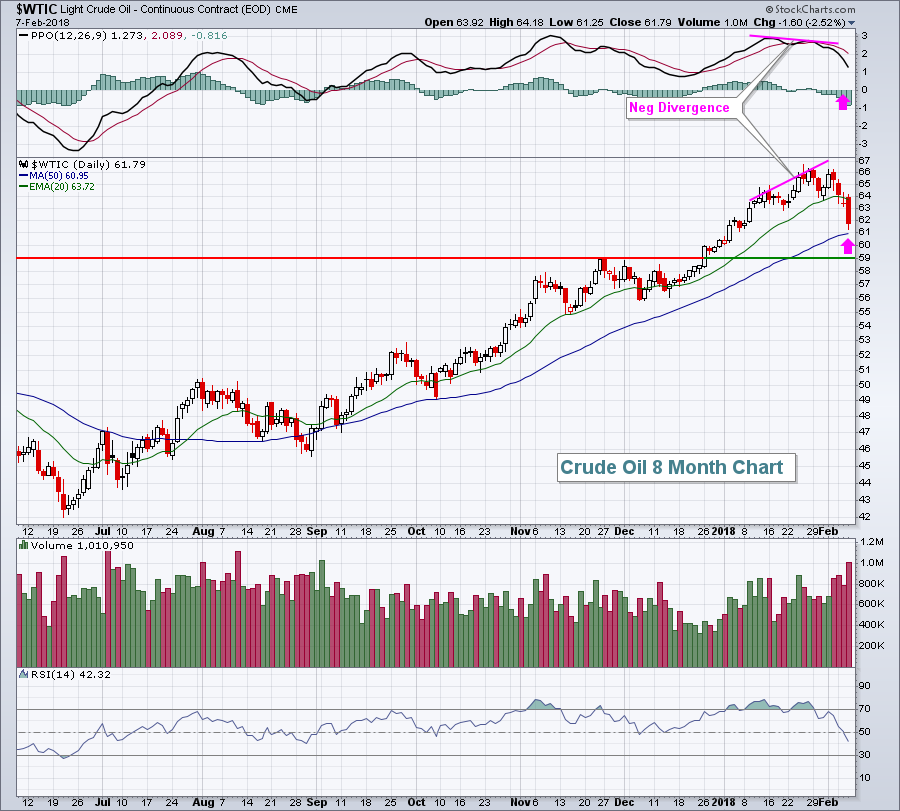
Copper Prices Remain In Strong Uptrend And That's Bullish For The S&P 500
by Tom Bowley,
Chief Market Strategist, EarningsBeats.com
Market Recap for Wednesday, February 7, 2018
With the exception of a fractional gain in the small cap Russell 2000, late day selling resulted in losses on each of our major indices. The Dow Jones spent much of the day in positive territory and sported a 270 point gain with...
READ MORE
MEMBERS ONLY

Not Many Hiding Places - Oil Turns and XLE Triggers Breadth Signals.
by Arthur Hill,
Chief Technical Strategist, TrendInvestorPro.com
* Nowhere to Hide.
* Majority of Stocks Remain Weak.
* VIX Remains at Lofty Levels.
* Oil Starts to Correct.
* XES Extends Correction and Breaks Wedge Line.
* XLE Triggers Bearish Breadth Signals.
* Charting Breadth Indicators.
February marked a sudden and dramatic shift in the financial markets. As the PerfChart below shows, stocks, oil,...
READ MORE
MEMBERS ONLY
DP Alert: New PMO BUY Signal on Dollar - TLT Narrowly Misses Long-Term SELL Signal
by Erin Swenlin,
Vice President, DecisionPoint.com
No one can deny that this correction has been difficult and it has certainly left investors uneasy. However, the VIX is calming down somewhat and the Swenlin Trading Oscillators have bottomed. I don't think the market is completely out of the woods from an intermediate-term indicator perspective. UUP...
READ MORE
MEMBERS ONLY

BOND YIELDS CLIMB BACK NEAR RECENT HIGH -- A BOUNCING DOLLAR IS PUSHING COMMODITIES LOWER -- THE RUSSELL 2000 SMALL CAP INDEX IS BOUNCING OFF ITS 200-DAY MOVING AVERAGE -- THE S&P 500 SLIPS INTO THE RED NEAR THE CLOSE IN HEAVIER TRADING
by John Murphy,
Chief Technical Analyst, StockCharts.com
10-YEAR TREASURY YIELD NEARS ANOTHER FOUR-YEAR HIGH ... A plunging stock market earlier in the week caused some safe-haven bond buying which caused bond yields to weaken. Chart 1, however, shows the 10-Year Treasury yield climbing 7 basis points today and very close to another four-year high. The recent upside breakout...
READ MORE
MEMBERS ONLY

Intel Holds Support with Three Day Reversal
by Arthur Hill,
Chief Technical Strategist, TrendInvestorPro.com
Intel (INTC) was hit hard the first three days of February, but the stock managed to hold support with a high volume reversal over the last three days.
First and foremost, the long-term trend is up because Intel recorded a 52-week high in late January and the 50-day EMA is...
READ MORE
MEMBERS ONLY
I'll Step Out On That Limb, The Bottom Is In
by Tom Bowley,
Chief Market Strategist, EarningsBeats.com
Market Recap for Tuesday, February 6, 2018
Volatility is the name of the game right now and big swings - both up and down - should be expected in the near-term. Yesterday was the bulls' turn as our major indices rallied back, led by the Dow Jones' 567...
READ MORE
MEMBERS ONLY

Evidence of A Bottom Looking Stronger
by Martin Pring,
President, Pring Research
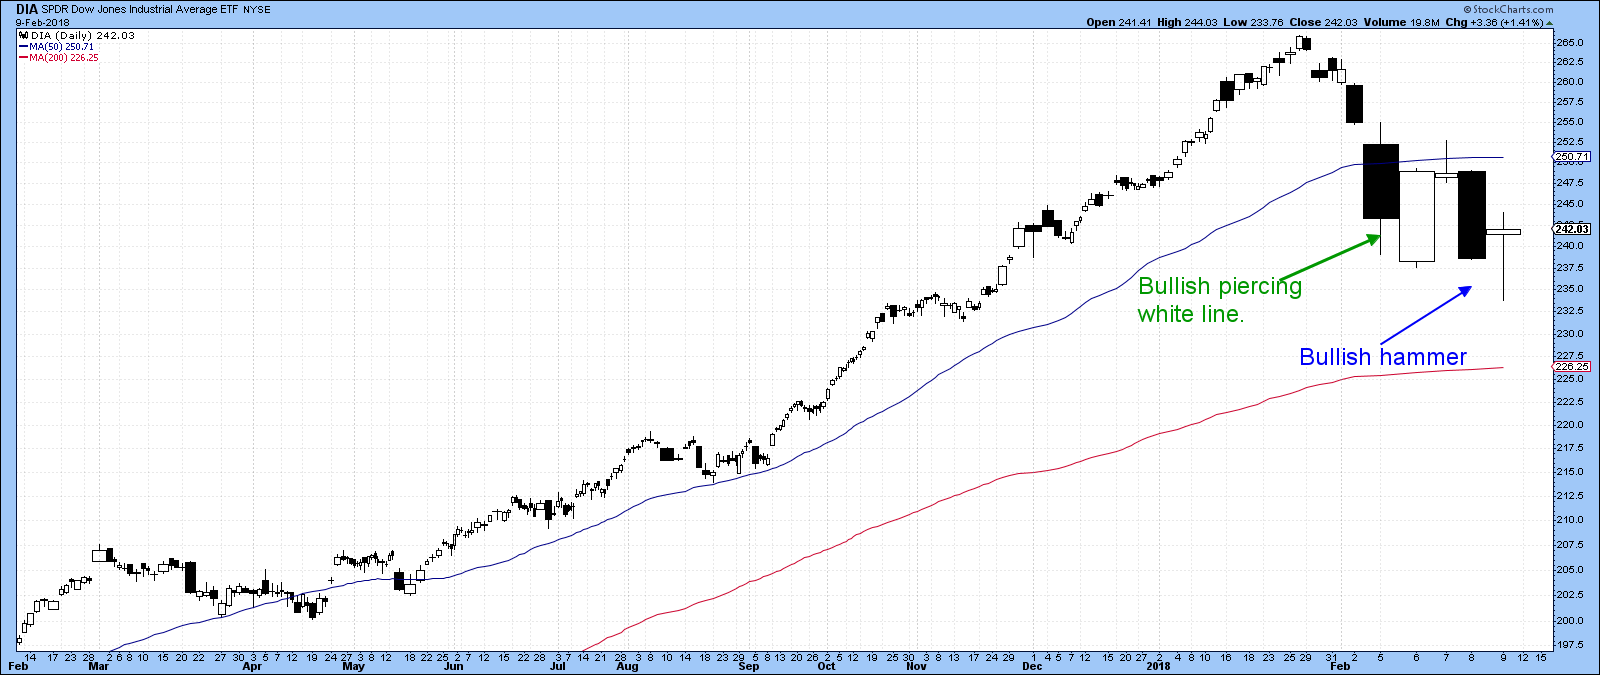
* Bullish piercing white line
* Bullish volume
* VIX signaling volatility retreating again
Bullish piercing white line
Tuesday’s market action suggests that the selling squall is over, at least for the time being. That’s because a couple of indexes experienced a bullish candlestick pattern known as a piercing white line....
READ MORE
MEMBERS ONLY

STOCKS ACHIEVE UPSIDE REVERSAL -- S&P 500 BOUNCES OFF TRENDLINE SUPPORT AND 100-DAY AVERAGE -- THE VIX REVERSES LOWER AFTER FAILING TO STAY OVER 40 LEVEL -- APPLE AND DOWDUPONT BOUNCE SHARPLY OFF 200-DAY AVERAGES
by John Murphy,
Chief Technical Analyst, StockCharts.com
S&P 500 REBOUNDS OFF CHART SUPPORT... After opening sharply lower, stocks achieved an upside reversal on heavier volume than yesterday. And stocks bounced off a couple of important support levels. Yesterday's message showed a rising trendline extending back to late 2016 near the 2600 level. The...
READ MORE
MEMBERS ONLY

What To Look For Next
by Martin Pring,
President, Pring Research
* Primary trend indicators are still bullish
* Short-term indicators still overbought
* Very short-term indicators already at extremes
* Bonds bottoming short-term?
I have been saying for some time that the market’s primary trend is a bullish one and that we should not get hung up with short-term corrections. That theory is...
READ MORE
MEMBERS ONLY
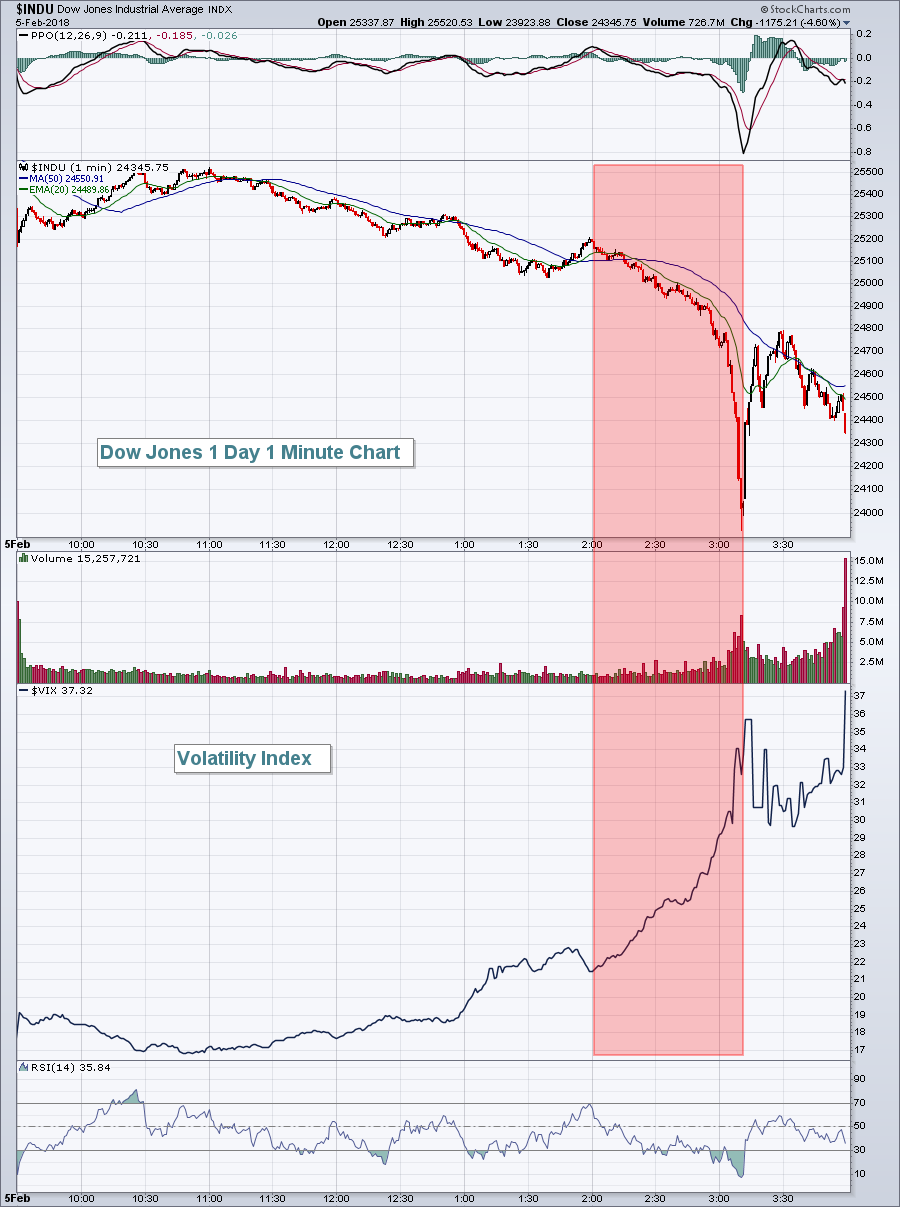
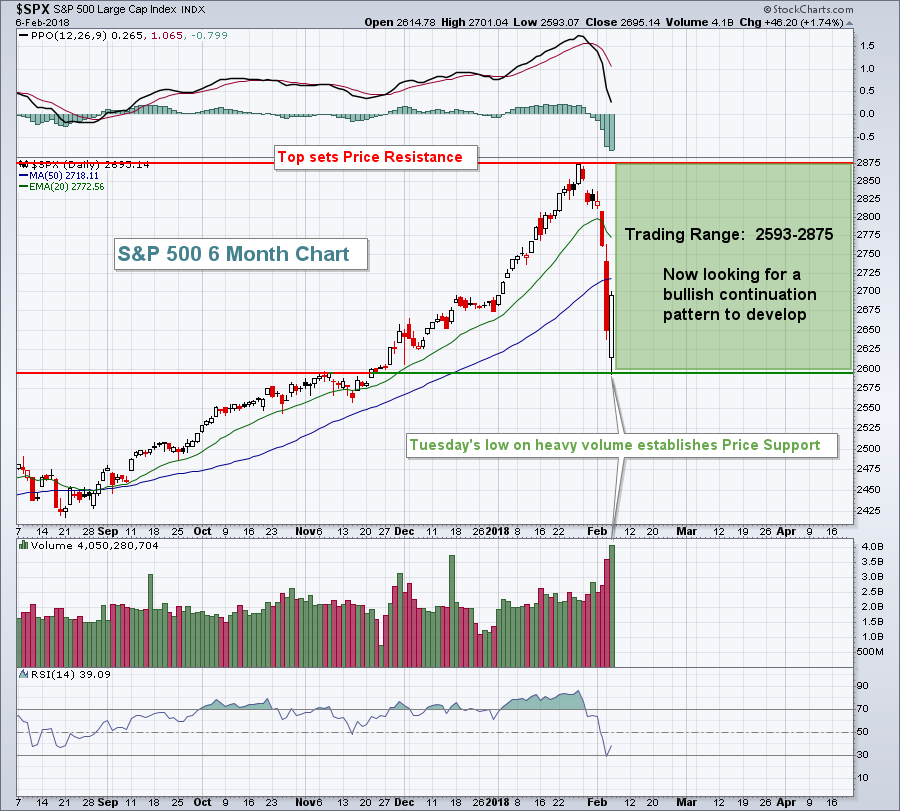
Look To VIX To Call Market Bottom
by Tom Bowley,
Chief Market Strategist, EarningsBeats.com
Market Recap for Monday, February 5, 2018
What a day and especially what a final hour! It was very reminiscent of selling episodes in 2008 where our major indices were losing a percent every few minutes. From a bullish perspective, there's little defense from panicked selling other than...
READ MORE