MEMBERS ONLY
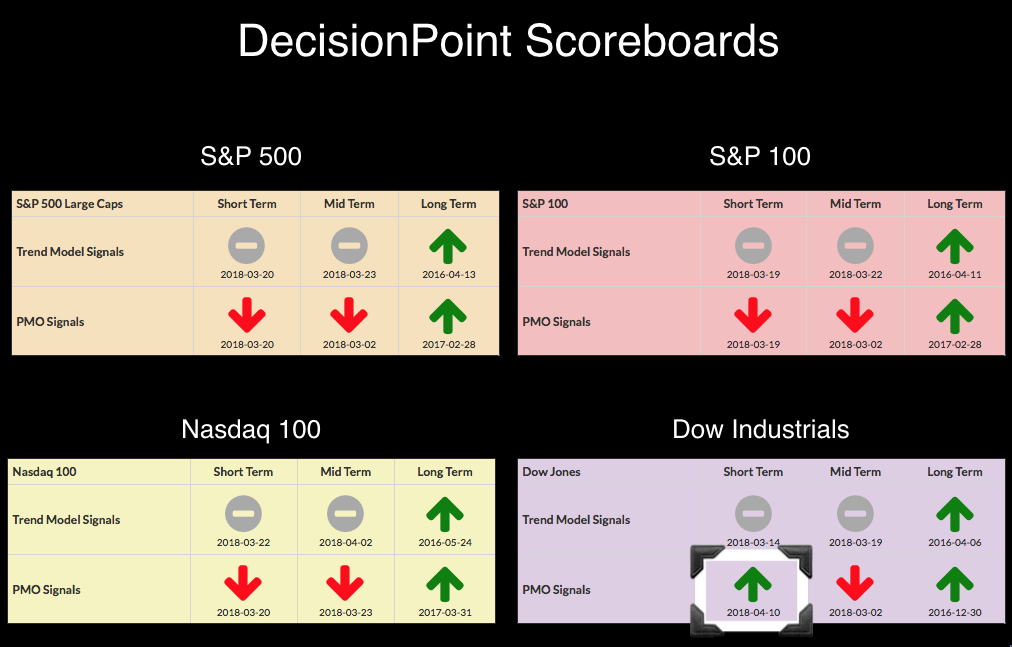
DP Bulletin: Dow is First to Regain Short-Term PMO BUY Signal

by Erin Swenlin,
Vice President, DecisionPoint.com
The Dow is the first to shed it's previous Price Momentum Oscillator (PMO) SELL signal. The SELL signal had been in place since 2/2/18. Found it interesting that the earliest PMO SELL signal on the DP Scoreboards managed to move to a BUY signal before all...
READ MORE
MEMBERS ONLY
Here's A Beaten Down Industry Group Where I'd Look For A 6-7% Rebound

by Tom Bowley,
Chief Market Strategist, EarningsBeats.com
Market Recap for Monday, April 9, 2018
Once again, Monday was the tale of two markets. The first half of the day was quite bullish, but it was all for naught as sellers stampeded the bulls in the afternoon session. Our major indices finished with across-the-board gains so if you...
READ MORE
MEMBERS ONLY
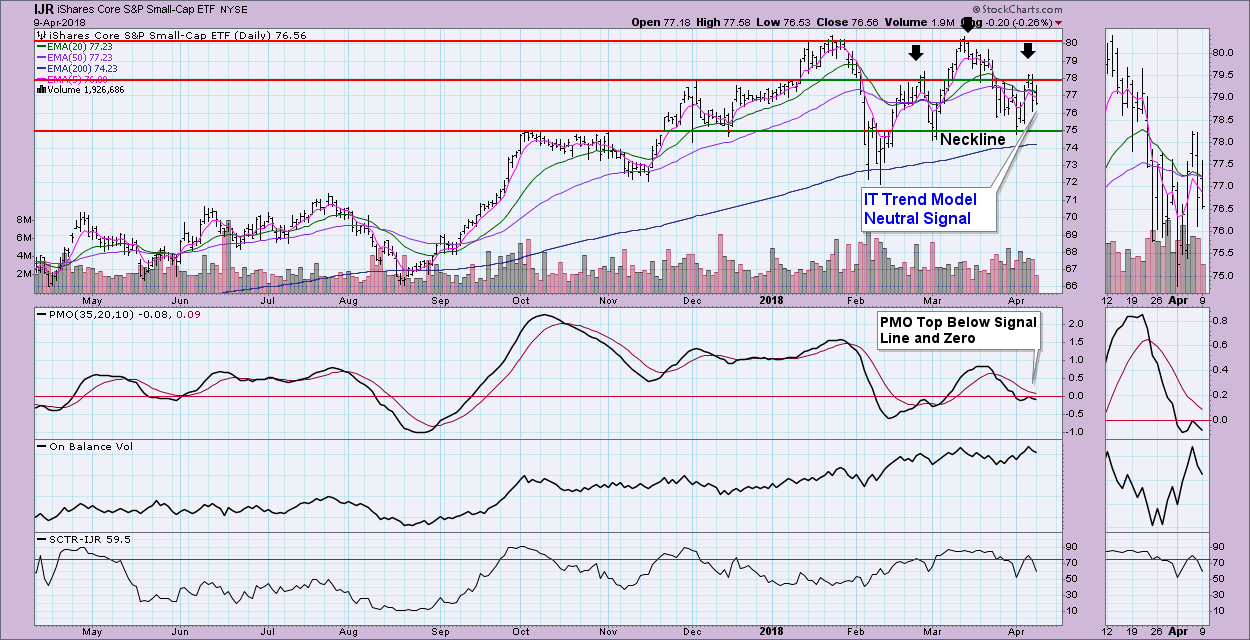
Small-Cap ETFs In Trouble - Possible Head and Shoulders Formations
by Erin Swenlin,
Vice President, DecisionPoint.com
After the market close, my technical alert activated on IJR, the S&P 600 ETF with a new Intermediate-Term Trend Model Neutral signal. I noted that this same signal has already been hit on IWM, the Russell 2000 ETF. While I believe we are in a consolidation or shake...
READ MORE
MEMBERS ONLY

Frontier Markets are Outperforming US Market

by Arthur Hill,
Chief Technical Strategist, TrendInvestorPro.com
The Frontier Markets ETF (FM) has been outperforming the S&P 500 SPDR (SPY) since summer and held up much better than the US market in March-April. FM recently broke out of a consolidation and it looks like the bigger uptrend is continuing.
The chart below shows FM with...
READ MORE
MEMBERS ONLY
Despite Friday's Selloff, My Most Reliable Signal Remains Bullish
by Tom Bowley,
Chief Market Strategist, EarningsBeats.com
Market Recap for Friday, April 6, 2018
All nine sectors fell on Friday as the Dow Jones tumbled 572 points amid more threats of China tariffs by the White House. China has promised further retaliation if the U.S. remains adamant about imposing tariffs on China imports. This rhetoric back...
READ MORE
MEMBERS ONLY
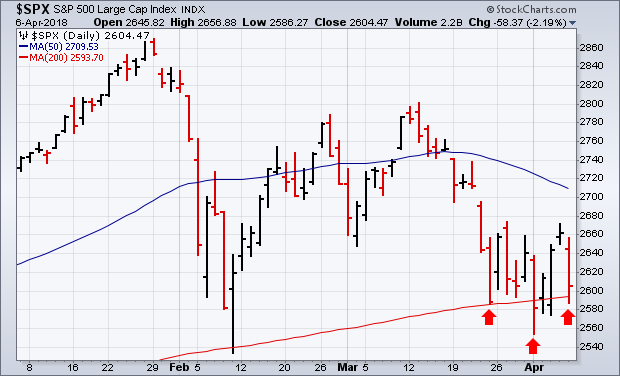
S&P 500. Zooming In.

by Bruce Fraser,
Industry-leading "Wyckoffian"
Wyckoff Method tools can be used in multiple time frames. We can often gain clarity by evaluating larger or smaller chunks of time. We recently studied the daily bars of the S&P 500 as it approached important Support. So far, this Support has been respected. Let’s review...
READ MORE
MEMBERS ONLY
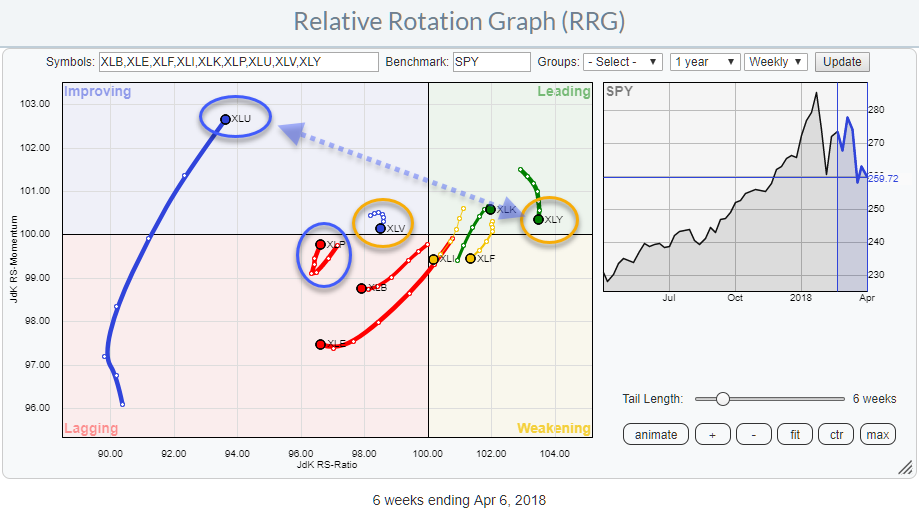
Relative Rotation Graph shows near term strength for Utilities and Staples

by Julius de Kempenaer,
Senior Technical Analyst, StockCharts.com
The Relative Rotation Graph for US sectors is showing us a few interesting rotational patterns for the week ending 4/6.
Studying the RRG above, there are two sector pairs which rotations I want to investigate a bit further.
The first one is Consumer Discretionary vs Utilities because they are...
READ MORE
MEMBERS ONLY

Identifying The Tapestry Of A Market Top

by Martin Pring,
President, Pring Research
* The importance of identifying the direction of the primary trend
* The Shiller P/E
* The four-way test
The importance of identifying the primary trend
Sometimes it’s a good idea to step back from the everyday trading of daily charts and short-term activity and look at the big picture. If...
READ MORE
MEMBERS ONLY
Third Tariff Threat Sinks Market

by John Murphy,
Chief Technical Analyst, StockCharts.com
Editor's Note: This article was originally published in John Murphy's Market Message on Saturday, April 7th at 7:55am ET
Just when it looked like the stock market was about to recover from the first two rounds of tariff threats, stocks were hit with a third...
READ MORE
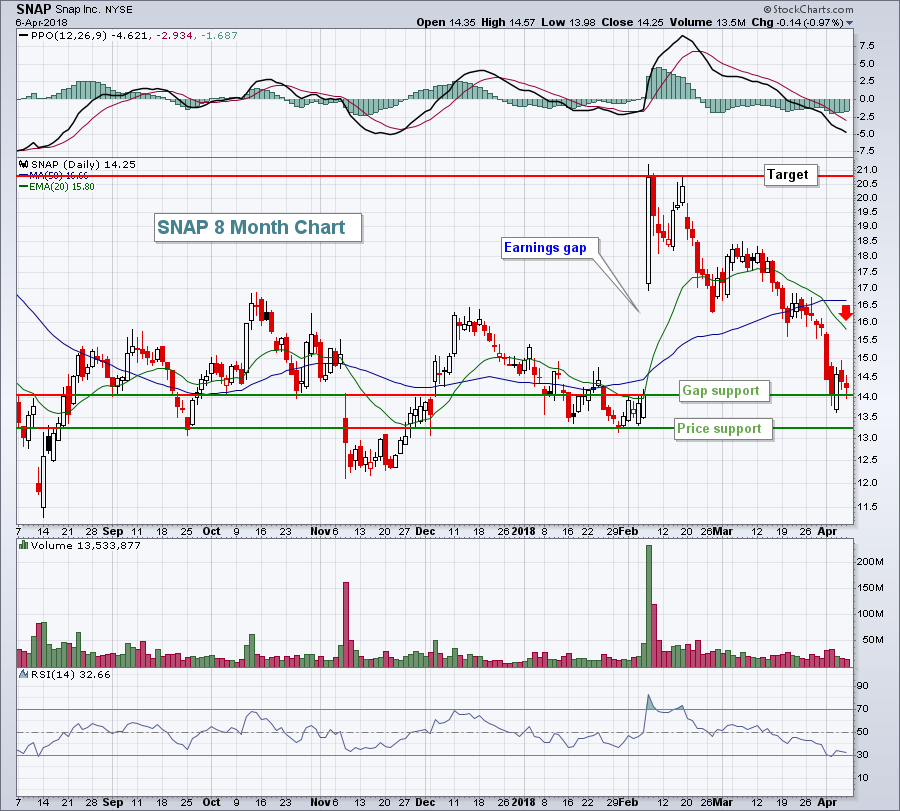
MEMBERS ONLY
Making Money on Earnings Reports

by John Hopkins,
President and Co-founder, EarningsBeats.com
Earnings season is about to get underway with thousands of companies scheduled to report their Q1 numbers. It's an exciting time each quarter when companies are rewarded or punished depending on their results.
It's always interesting to watch how traders react to a specific earnings report...
READ MORE
MEMBERS ONLY
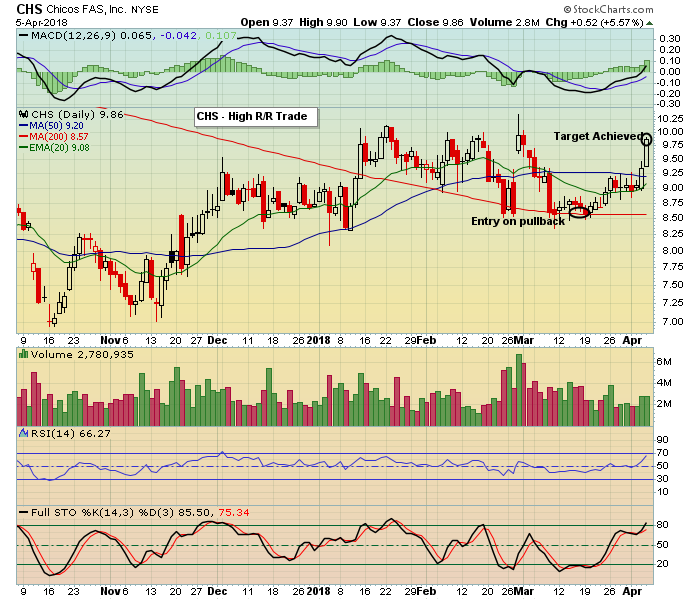
Identifying Solid Reward To Risk Trades For A Big Pre-Earnings Advance
by Tom Bowley,
Chief Market Strategist, EarningsBeats.com
The start of every quarter represents a big opportunity to me and the reason is simple. Historically, the odds favor a bullish move into earnings season. Before we consider which individual stocks might be poised for a solid advance, let's take a look at history and the Volatility...
READ MORE
MEMBERS ONLY

MARKETS GET TRUMPED FOR THE THIRD TIME -- WEEK'S STOCK GAINS ARE WIPED OUT ON FRIDAY AS TARIFF THREATS INTENSIFY -- ANOTHER TEST OF UNDERLYING CHART SUPPORT NOW APPEARS LIKELY
by John Murphy,
Chief Technical Analyst, StockCharts.com
THIRD TARIFF THREAT SINKS MARKET... Just when it looked like the stock market was about to recover from the first two rounds of tariff threats, stocks were hit with a third and bigger $100 billion tariff threat after the close on Thursday. As a result, stock market indexes fell more...
READ MORE
MEMBERS ONLY

The 800-pound Gorilla Continues to Struggle
by Arthur Hill,
Chief Technical Strategist, TrendInvestorPro.com
The percentage of stocks above the 50-day EMA is a breadth indicator that measures internal performance. Chartists can compare this indicator across indexes to identify the leaders and laggards. The Nasdaq 100 is the weakest of the major indexes and weighing on the broader market.
The chart below shows %Above...
READ MORE
MEMBERS ONLY
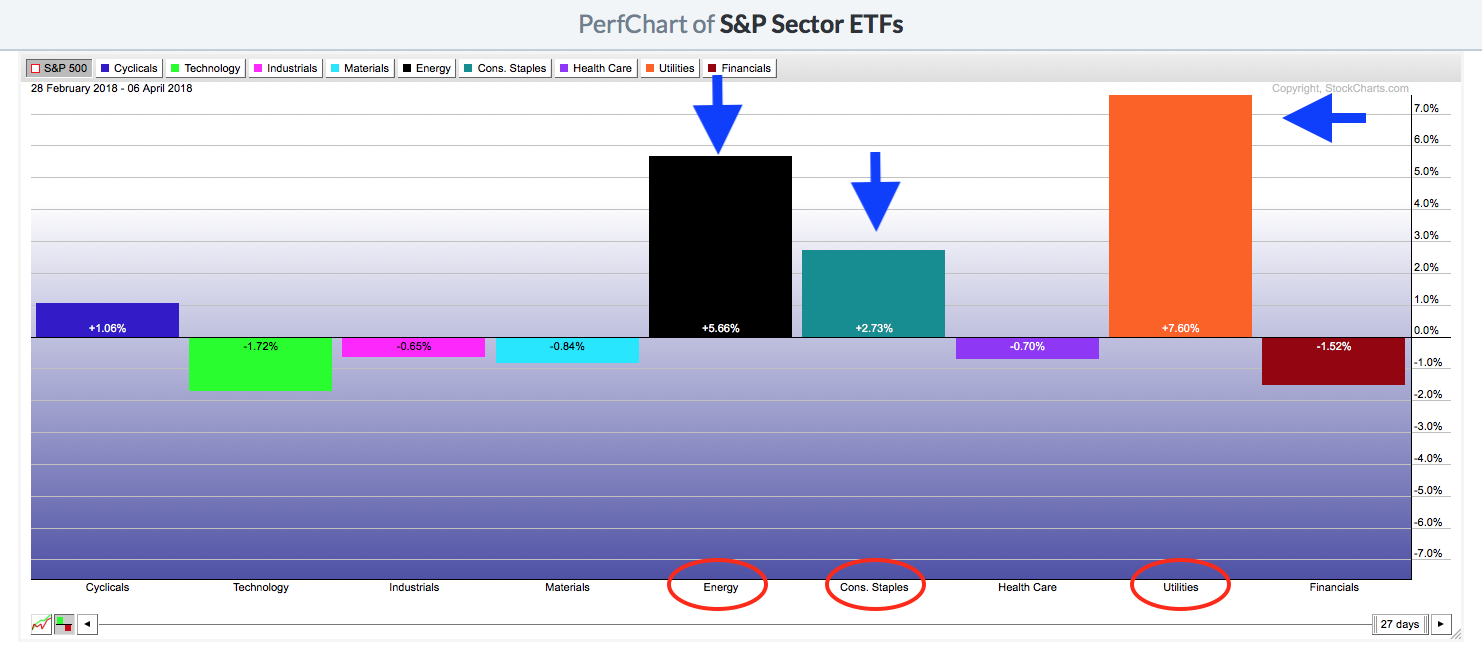
Defensive Sectors Performing - Utilities Only IT Trend Model BUY Signal
by Erin Swenlin,
Vice President, DecisionPoint.com
If you've been reading the DecisionPoint Blog lately or watching the MarketWatchers LIVE show on StockCharts TV, you know that I have been expressing concern over the sector rotation over the past few weeks and month. Over the past month, the worst performer is the Technology sector, followed...
READ MORE
MEMBERS ONLY
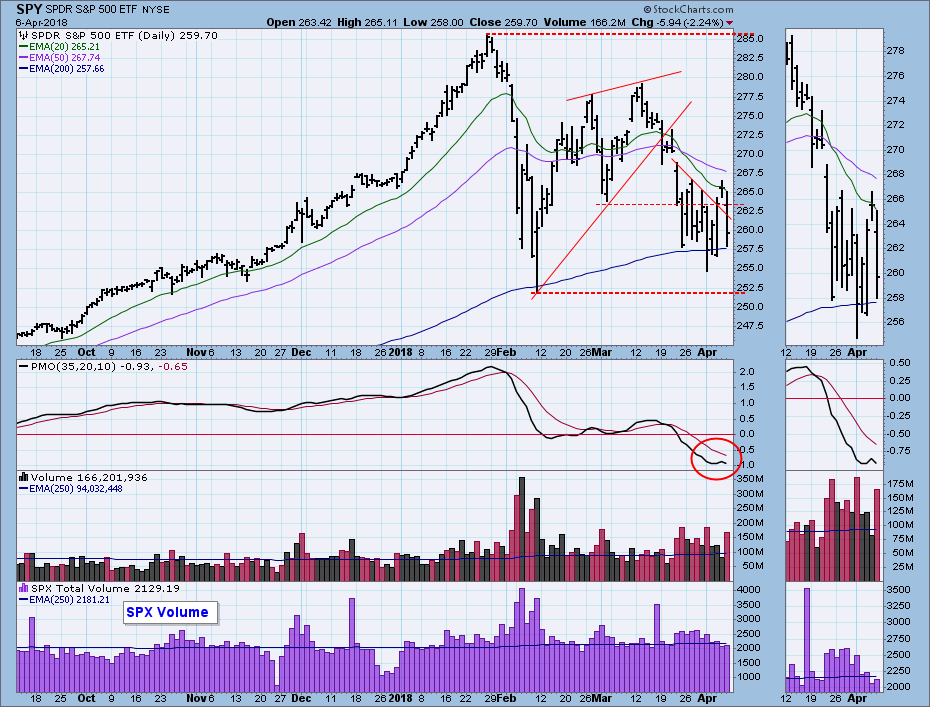
DP Weekly Wrap: Choppy Week Closes Down

by Carl Swenlin,
President and Founder, DecisionPoint.com
On the SPY chart last week I thought I saw a reverse flag formation, although it was not as tightly defined as I would like. This week the market thrashed around pretty badly, and although the flag didn't become more visible, there is still a ragged cluster of...
READ MORE
MEMBERS ONLY

Weekly Market Review & Outlook (with Video) - Two Down and One to Go
by Arthur Hill,
Chief Technical Strategist, TrendInvestorPro.com
* Two Down, One To Go.
* QQQ: Bruised, but not Quite Broken.
* Small-caps Continue to Show Relative Strength.
* Small-cap Consumer Discretionary and Industrials Lead.
* Housing and Retail Lead CD.
* Tech-related ETFs Remain Subdued.
* Watching the Channel in Oil.
* Notes from the Art's Charts ChartList.
Trends depend on timeframes and...
READ MORE
MEMBERS ONLY
I Cannot Own Commodities And Here's Why
by Tom Bowley,
Chief Market Strategist, EarningsBeats.com
Market Recap for Thursday, April 5, 2018
The latest recovery attempt continued into Thursday of this week, but weak futures this morning will provide yet one more obstacle for the bulls to overcome. I'll talk more about that in the Pre-Market Action section below.
In the meantime, eight...
READ MORE
MEMBERS ONLY
Indicators - ST Overbought with Negative Divergences Sprinkled on Top
by Erin Swenlin,
Vice President, DecisionPoint.com
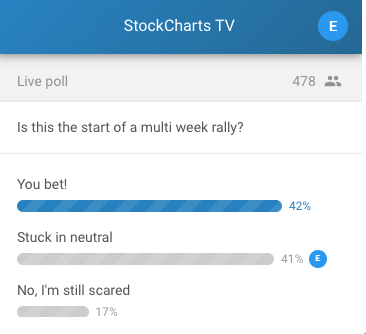
It was heady to feel the bullish exuberance pulsing around the MarketWatchers LIVE show, but now that the day is over and the indicators are ready for review. I was seriously disappointed not to see the supporting evidence I wanted so I too could enjoy some bullish exuberance. Our poll...
READ MORE
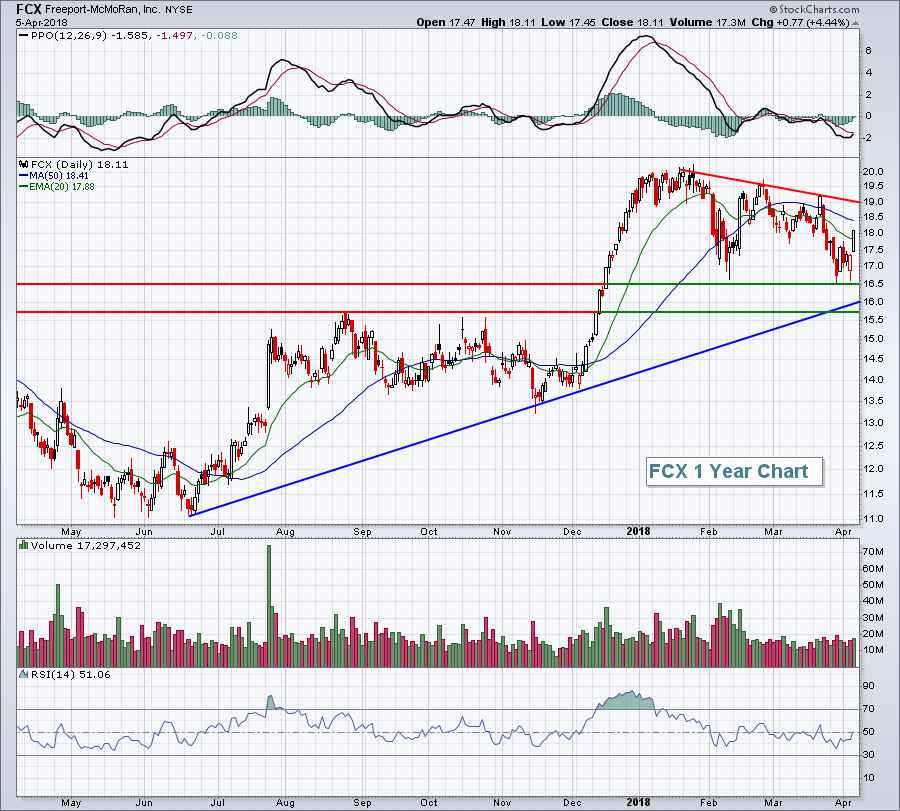
MEMBERS ONLY

REBOUND IN BOEING PUTS THE DOW IN THE LEAD FOR THE DAY -- THE DOW CLEARS INITIAL RESISTANCE BARRIER -- ENERGY AND MATERIAL SPDRS REGAIN 200-DAY AVERAGES -- FREEPORT MCMORAN AND MARATHON OIL HAVE A STRONG DAY -- S&P 500 NEARS TEST OF OVERHEAD RESISTANCE
by John Murphy,
Chief Technical Analyst, StockCharts.com
BOEING BOUNCES OFF 100-DAY AVERAGE ... The Dow Industrials led today's follow-through rally in stocks. Today's bounce in Boeing is a big reason why. The daily bars in Chart 1 show the aerospace giant gaining 2.74% today after bouncing off its 100-day moving average (green line)...
READ MORE
MEMBERS ONLY
Consumer Discretionary Leads And Remains On A Very Bullish Track
by Tom Bowley,
Chief Market Strategist, EarningsBeats.com
Market Recap for Wednesday, April 4, 2018
Welcome back consumer stocks! One day certainly doesn't make a fresh new trend, but it's been awhile since consumer stocks led a rally. Consumer discretionary (XLY, +1.84%) and consumer staples (XLP, +1.56%) were atop the sector leaderboard...
READ MORE
MEMBERS ONLY

DP Alert: Bounce Back for Cyclicals and Technology Eases Bear Market Fears
by Erin Swenlin,
Vice President, DecisionPoint.com
I was concerned earlier this week when we lost the IT Trend Model BUY signals in the aggressive technology and cyclicals sectors. However, both of these sectors have surged over the past two days which does allay fears of a bear market setting up. You'll see below the...
READ MORE
MEMBERS ONLY

STOCKS SURGE 3% AFTER A WEAK OPEN -- AND 200-DAY AVERAGES HOLD ONCE AGAIN -- SMALL CAPS ARE HOLDING UP BETTER THAN LARGE CAPS -- HOMEBUILDERS AND RETAILERS MADE CYCLICALS THE DAY'S STRONGEST SECTOR
by John Murphy,
Chief Technical Analyst, StockCharts.com
STOCKS SCORE BIG UPSIDE REVERSAL FROM 200-DAY AVERAGES ... The stock market staged an impressive upside turnaround today. After opening 500 points lower this morning, the Dow Industrials ended the day 230 points (0.96%) higher. That's a gain of more than 700 points from its opening price. Stock...
READ MORE
MEMBERS ONLY

Bottoms Up Part II
by Martin Pring,
President, Pring Research
* Positive breadth characteristics
* VIX is less fearful
* Short-term oscillators starting to get extremely oversold
* How about trend?
Last week I suggested that the market may be in the process of forming a double bottom. This week we take that possibility one step forward. Whenever the non-financial cable networks run a...
READ MORE
MEMBERS ONLY
A Volatility War Has Been Declared
by Tom Bowley,
Chief Market Strategist, EarningsBeats.com
Special Note
I typically post a blog article every day that the U.S. stock market is open. If you'd like to receive my blog articles as soon as they're published, you can subscribe (for FREE) by scrolling to the bottom of this article, typing your...
READ MORE
MEMBERS ONLY
Market Round Up April 2018
by Martin Pring,
President, Pring Research
Here is a link to the April edition of Market Round Up for 2018.
Martin-Pring-Market-Roundup-April-2018 from StockCharts.com on Vimeo.
Good luck and good charting,
Martin J. Pring
The views expressed in this article are those of the author and do not necessarily reflect the position or opinion of Pring...
READ MORE
MEMBERS ONLY
General Comments on Trend Following

by Greg Morris,
Veteran Technical Analyst, Investor, and Author
Since there are many new readers, I thought an overview on trend following might be appropriate. As I have stated often, I use a market analysis methodology called trend following. Sometimes it should be called trend continuation. Why? My trend analysis works on the thoroughly researched concept that once a...
READ MORE
MEMBERS ONLY
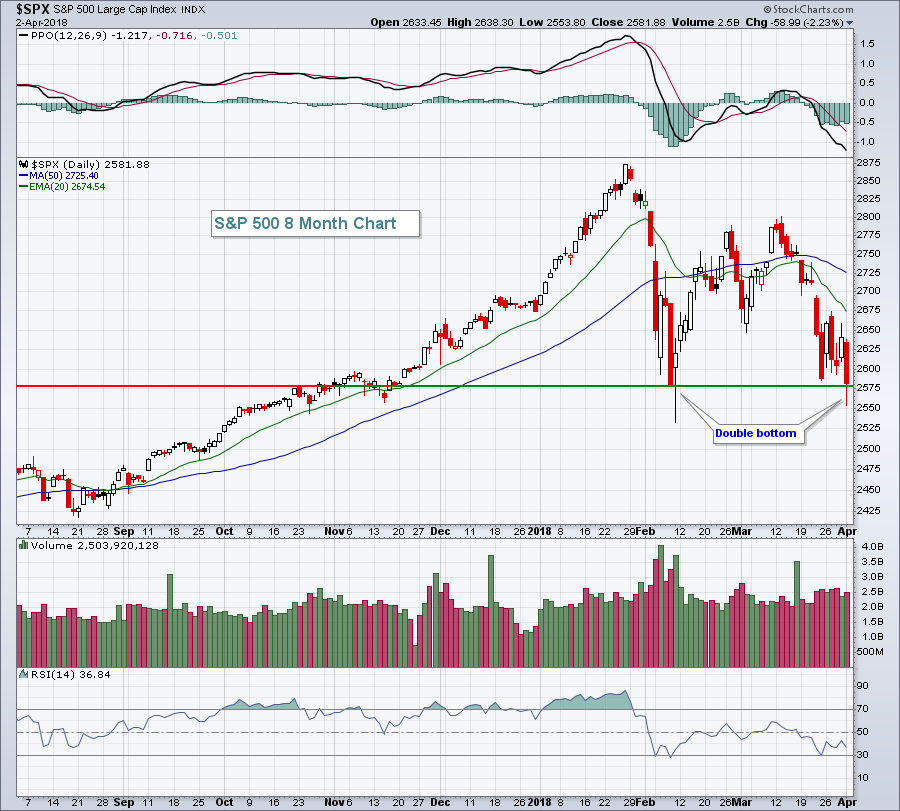
U.S. Stocks Slide As S&P 500 Prints Double Bottom
by Tom Bowley,
Chief Market Strategist, EarningsBeats.com
Market Recap for Monday, April 2, 2018
It was a big down day on Wall Street with eight of nine sectors down 2% or more. Only the defensive utilities (XLU, -0.77%) were able to minimize its losses, with the more aggressive consumer discretionary (XLY, -2.82%) and technology (XLK,...
READ MORE
MEMBERS ONLY
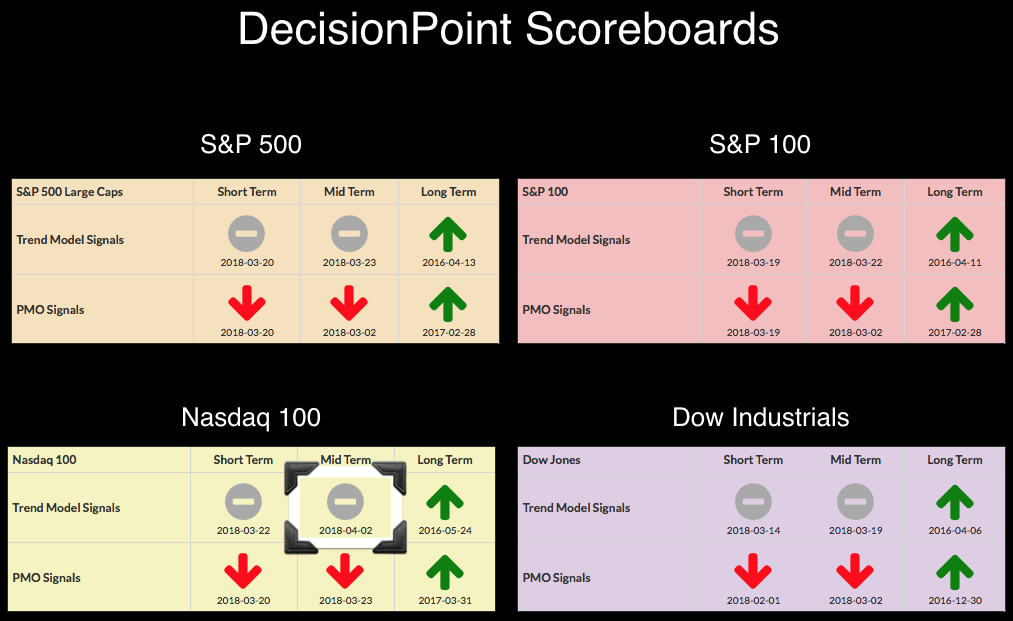
Intermediate-Term Trend Model NEUTRAL Triggered on NDX - No ITTM BUY Signals on SPDRs
by Erin Swenlin,
Vice President, DecisionPoint.com
Today the NDX succumbed to peer pressure and dropped its Intermediate-Term Trend Model BUY signal. The Scoreboards below are clear: Long term has a bullish bias, but serious damage has been done in the short and intermediate terms.
The IT Trend Model signals are based on 20/50-EMA crossovers in...
READ MORE
MEMBERS ONLY

STOCKS START THE SECOND QUARTER UNDER HEAVY SELLING -- 200-DAY MOVING AVERAGES ARE BEING THREATENED -- ALL MARKET SECTORS END IN THE RED -- CONSUMER DISCRETIONARY AND TECHNOLOGY STOCKS ARE AMONG BIGGEST LOSERS
by John Murphy,
Chief Technical Analyst, StockCharts.com
MAJOR STOCK INDEXES RETEST UNDERLYING SUPPORT LEVELS ... Stocks started the second quarter under heavy selling pressure. Some major stock indexes saw losses in excess of 2%. Today's selling is resulting in retests of important underlying support levels. Chart 1 shows the Dow Industrials touching its 200-day average but...
READ MORE
MEMBERS ONLY

DSW Takes the Lead with a New High
by Arthur Hill,
Chief Technical Strategist, TrendInvestorPro.com
The S&P 500 is well below its January high and trading near its February low. DSW, in contrast, hit a 52-week high last week and is clearly leading the market.
The chart shows DSW with a choppy advance from mid August to mid November and then a choppy...
READ MORE
MEMBERS ONLY

The Range Narrows on the S&P 500 - Plus 3 ETFs, Energy and 5 Stocks
by Arthur Hill,
Chief Technical Strategist, TrendInvestorPro.com
* A Narrowing Range for the S&P 500.
* A Bearish Pennant or Higher Low?
* Not Always the End of the World.
* Three Industry Group ETFs to Watch (ITA, ITB, IAI).
* Energy ETFs Continue Consolidation.
* Stocks to Watch (APC, HAL, MSFT, INTC, ATVI).
A Narrowing Range for the S&...
READ MORE
MEMBERS ONLY
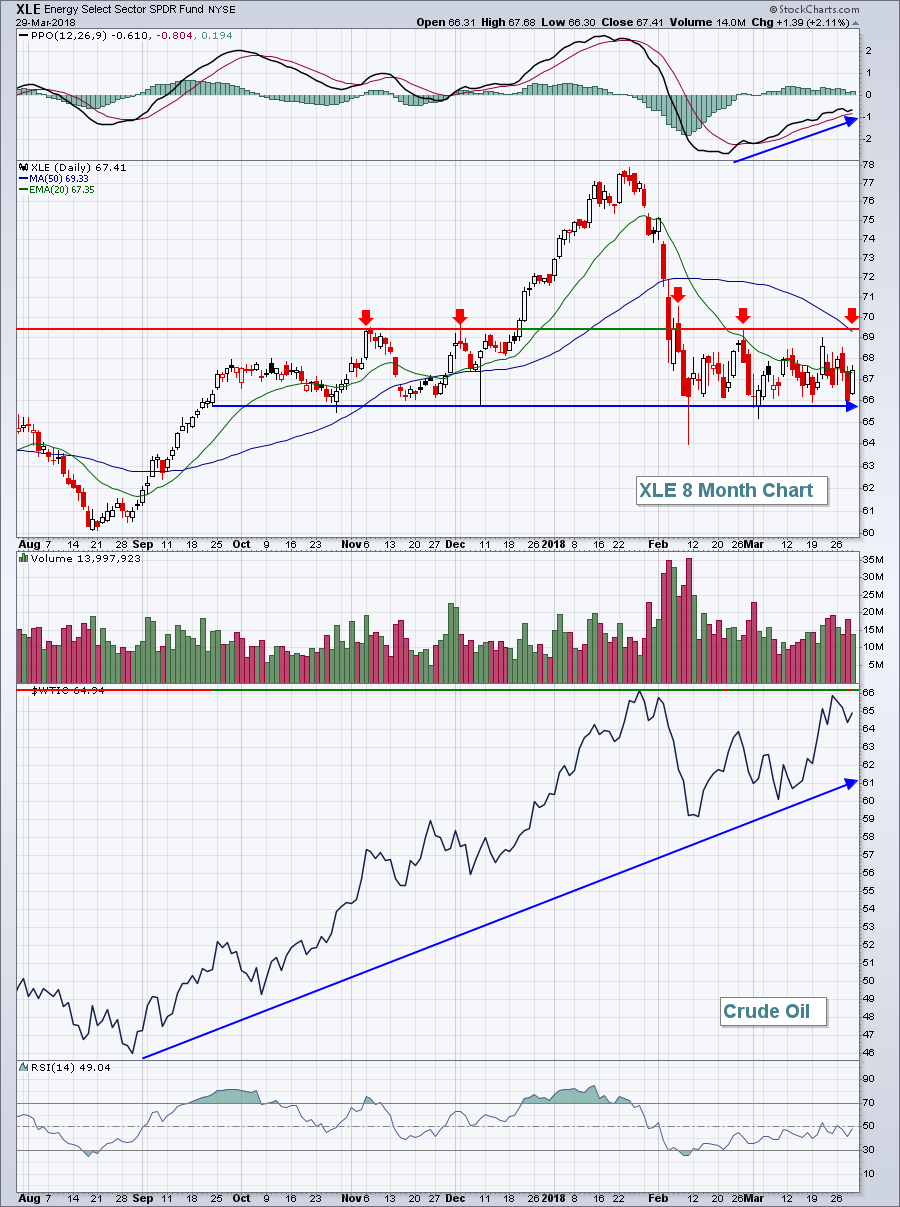
Energy Bounces Off Of Rock Solid Support......Again
by Tom Bowley,
Chief Market Strategist, EarningsBeats.com
Market Recap for Thursday, March 29, 2018
The energy ETF (XLE, +2.11%) surged off of key price support at 66.00 and there's reason to believe that this rally could last a bit longer. Crude oil prices ($WTIC) outperformed the XLE during the month of March and...
READ MORE
MEMBERS ONLY

Detect Rotation with PnF Charts
by Bruce Fraser,
Industry-leading "Wyckoffian"
The winds are shifting in the financial markets. Often Point and Figure charts offer a perspective that other chart types might obscure. Point and Figure chart construction is minimalistic. It keeps the important price swings and discards the rest. PnF charting lends itself to techniques for estimating price objectives from...
READ MORE
MEMBERS ONLY
Putting things into perspective for the FB face-plant
by Julius de Kempenaer,
Senior Technical Analyst, StockCharts.com
Facebook has been making headlines recently. Not only in the newspapers and online news services but also in some of the blogs at Stockcharts.com.
With hindsight everything is easy and we can find many “signals” that “would have” given us early warning signals that we “should” have seen and...
READ MORE
MEMBERS ONLY

THE FIRST QUARTER WASN'T THAT BAD FOR STOCKS -- THE VANGUARD TOTAL STOCK MARKET ETF LOST LESS THAN 1% -- SOCIAL MEDIA ETF IS BOUNCING OFF CHART SUPPORT -- SO IS AN ETF OF BANK STOCKS -- GLOBAL X COPPER MINERS ETF BOUNCES OFF ITS 200-DAY AVERAGE
by John Murphy,
Chief Technical Analyst, StockCharts.com
VANGUARD TOTAL STOCK MARKET ETF LOST LESS THAN 1%... Despite all the volatility during the first quarter, the first three months of 2018 weren't really that bad. The Dow Industrials were the biggest losers with a quarterly drop of -2.5%. The broader S&P 500 Index...
READ MORE
MEMBERS ONLY

Why ETFs Are Best-of-Breed for Only 50% of Your Asset Classes

by Gatis Roze,
Author, "Tensile Trading"
Investors have once again been misled by the media, bamboozled by Blackrock, duped and frisked by the financial community. Exchange traded funds (ETFs) are not the panacea for every asset class as they all want you to believe they are.
In my own portfolio, approximately 45% of my asset classes...
READ MORE
MEMBERS ONLY

Weekly Market Review & Outlook - Green Shoots Appearing
by Arthur Hill,
Chief Technical Strategist, TrendInvestorPro.com
* To Bounce or Not To Bounce.
* %Above 200-day EMA at Inflection Point.
* Fewer New Lows in March.
* Seasonality is Quite Bullish in April.
* A Big Triangle for the S&P 500.
* Playing the Swings within the Triangle.
* QQQ is Not Broken.
* Small-caps are Showing Relative Strength.
* Gold Falls back...
READ MORE
MEMBERS ONLY
DP Weekly/Monthly Wrap: Is That a Reverse Flag?
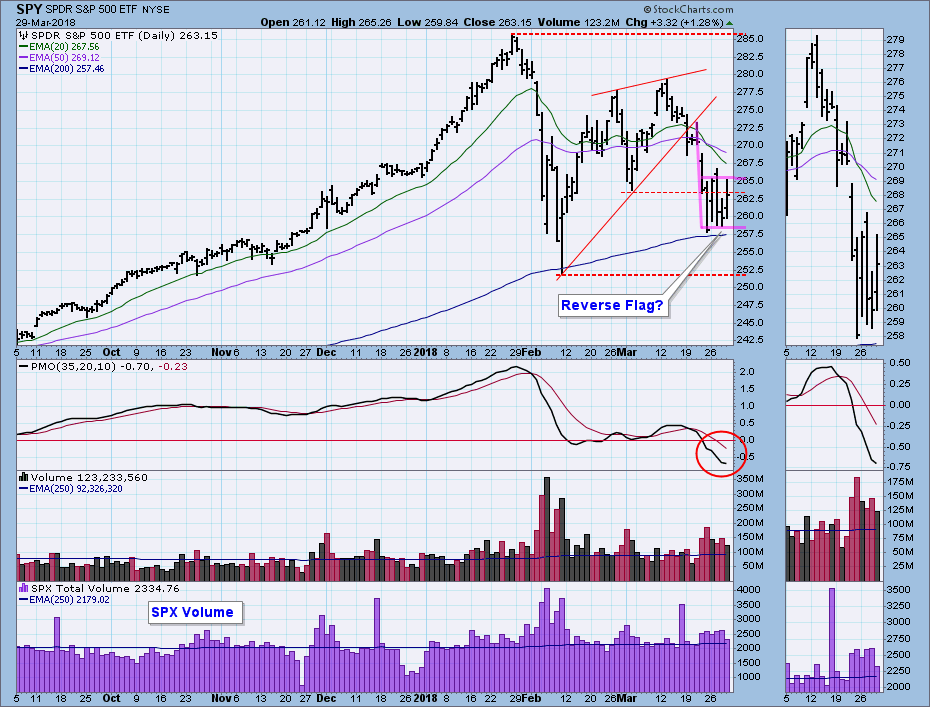
by Carl Swenlin,
President and Founder, DecisionPoint.com
Last week the market broke down from a rising wedge pattern and dove into a scary decline. This week was choppy and wild, but price stayed within a somewhat ragged range that looks to me like a bearish reverse flag formation. Price remained above the 200EMA, and every day volume...
READ MORE
MEMBERS ONLY

Bottoms Up?
by Martin Pring,
President, Pring Research
* Is the market forming a double bottom?
* Short-term indicators suggest the bottoming process is nearly complete
Sometimes a technical event or characteristic becomes very popular very quickly as a lot of people write and blog about them. Usually, the expectations based on those forecasts are not met. For example, every...
READ MORE
MEMBERS ONLY

SystemTrader - Putting the Put-Call Ratio Through the Wringer
by Arthur Hill,
Chief Technical Strategist, TrendInvestorPro.com
* Introduction and Overview.
* A Historical Look at the Ratio.
* Put Volume Surges to Multi-year Levels.
* The Eye-Ball Signals.
* Putting Together a System.
* Running the Numbers.
* Conclusions.
...The Put-Call Ratio is getting a lot of attention lately so I took a stab at building a trading system around this indicator.
Sentiment...
READ MORE