MEMBERS ONLY
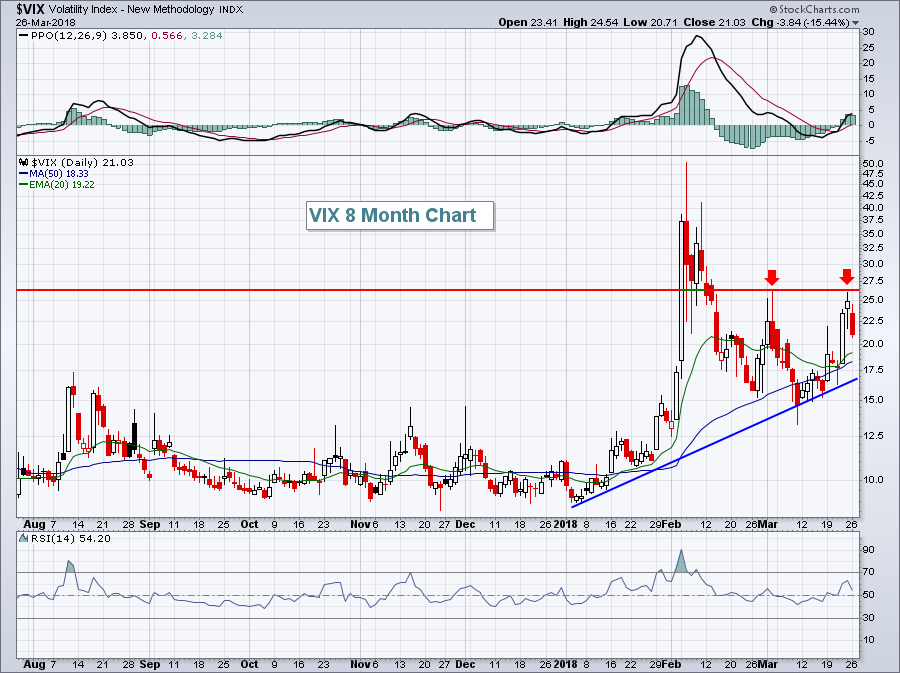
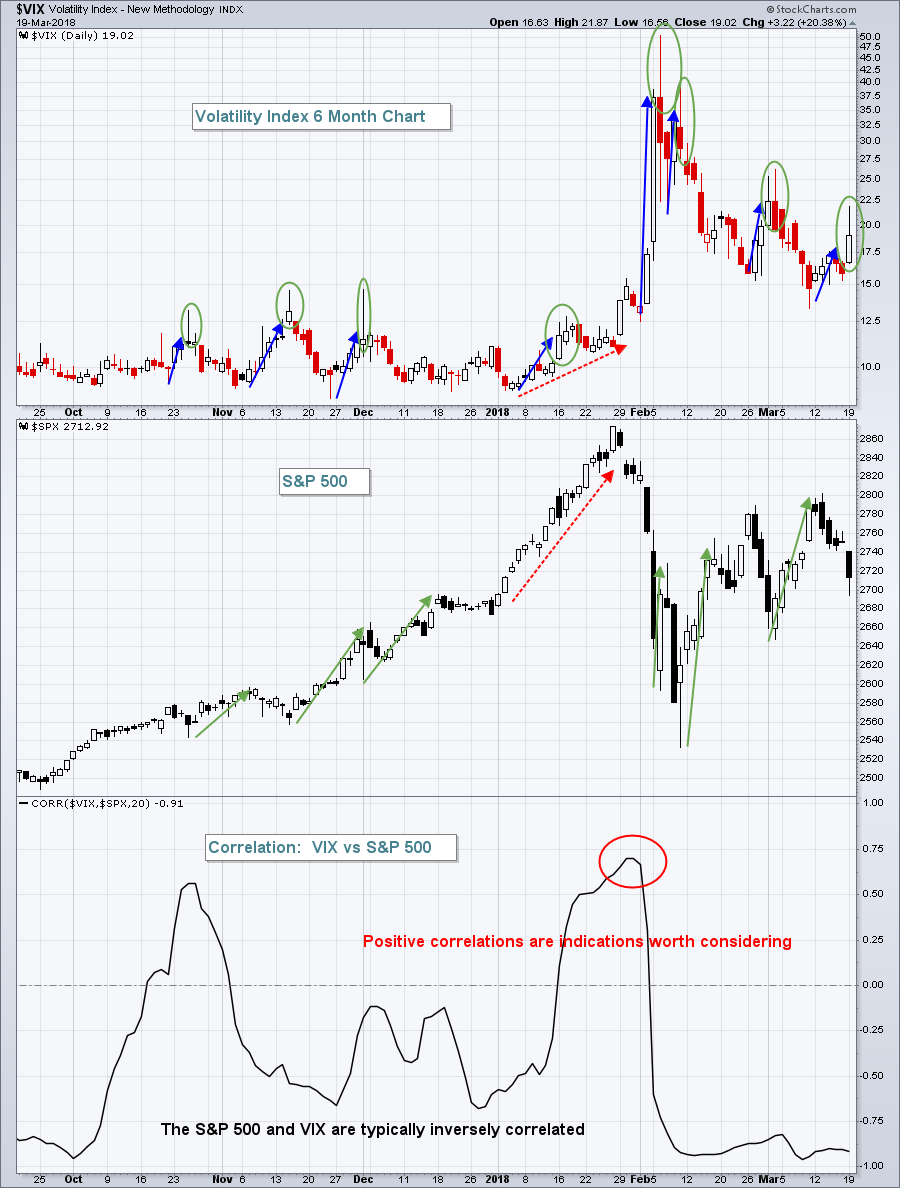
Wednesday's Reversal In NASDAQ 100 Volatility Gauge Could Signal End Of Selling

by Tom Bowley,
Chief Market Strategist, EarningsBeats.com
Market Recap for Wednesday, March 28, 2018
The U.S. stock market settled down on Wednesday and that could be very good news for the bulls. High volatility ($VIX) has stunned equity traders the past two months after a 15 month period of little volatility. But on Wednesday, the VIX...
READ MORE
MEMBERS ONLY
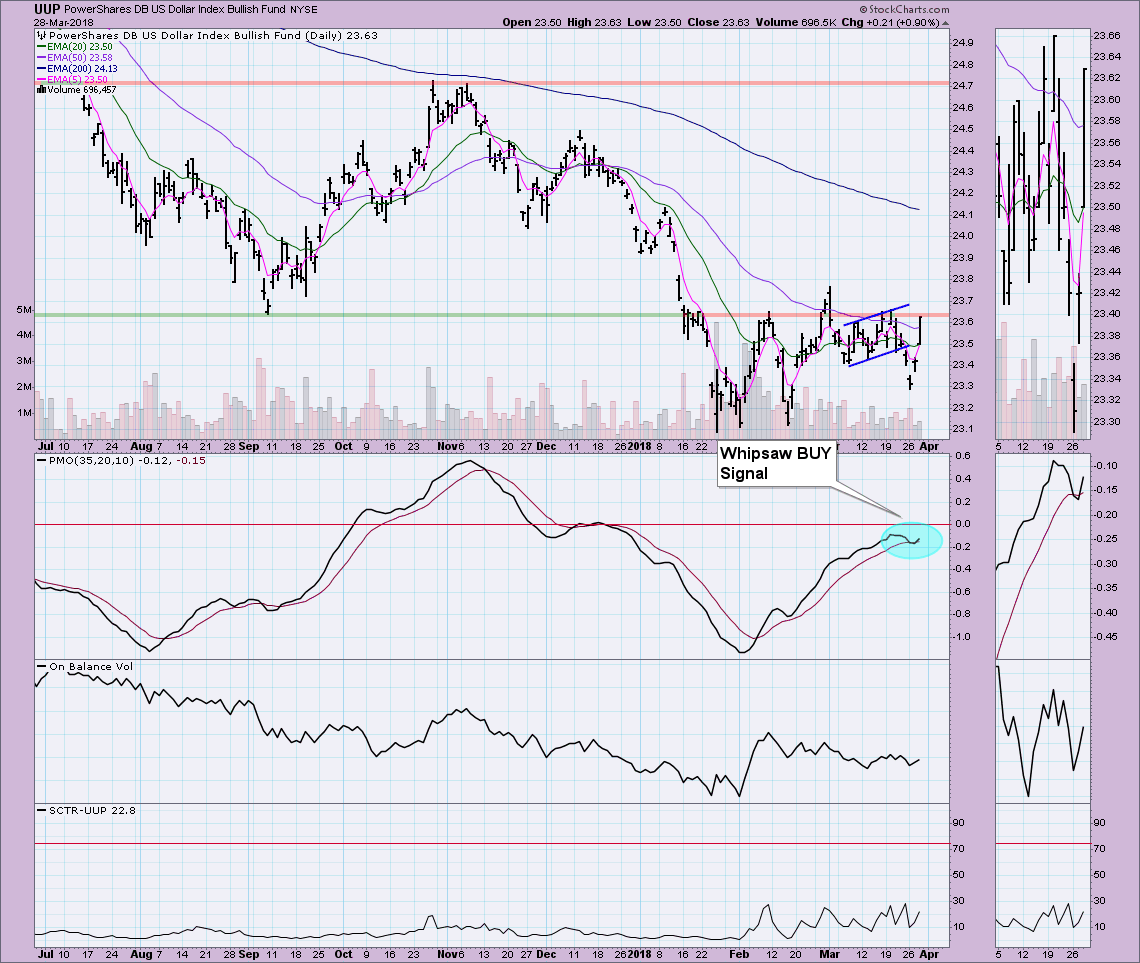
New ST PMO BUY Signal for UUP - Sector Rotation On Defense

by Erin Swenlin,
Vice President, DecisionPoint.com
The Dollar has been poised for a breakout for some time. The PMO has been rising nicely, but UUP has been banging its head on overhead resistance with not much success. Looking at the big picture, relative strength has been shuffling toward defensive sectors like Consumer Staples and Utilities which...
READ MORE
MEMBERS ONLY

MAJOR US STOCK INDEXES ARE TRYING TO STABILIZE NEAR 200-DAY AVERAGES AND FEBRUARY LOW -- TECHNOLOGY STOCKS ARE WEIGHING ON THE MARKET -- ESPECIALLY FAANG STOCKS -- BUT FACEBOOK LOOKS OVERSOLD WHILE ALPHABET IS TESTING CHART SUPPORT

by John Murphy,
Chief Technical Analyst, StockCharts.com
DOW AND THE S&P 500 ARE RETESTING 200-DAY LINES ... The Dow and the S&P 500 are still in the process of retesting underlying support levels near their 200-day averages and February lows. Chart 1 shows the Dow Industrials retesting its February intra-day low at 23,400...
READ MORE
MEMBERS ONLY

Pfizer Bounces within Uptrend

by Arthur Hill,
Chief Technical Strategist, TrendInvestorPro.com
The pickings are slim as the market corrects and may charts turn ugly. I am noticing some strength in big pharma with Merck (MRK) up in March and Pfizer (PFE) holding above the early February low (so far).
The chart shows PFE with a zigzag uptrend since June. The stock...
READ MORE
MEMBERS ONLY
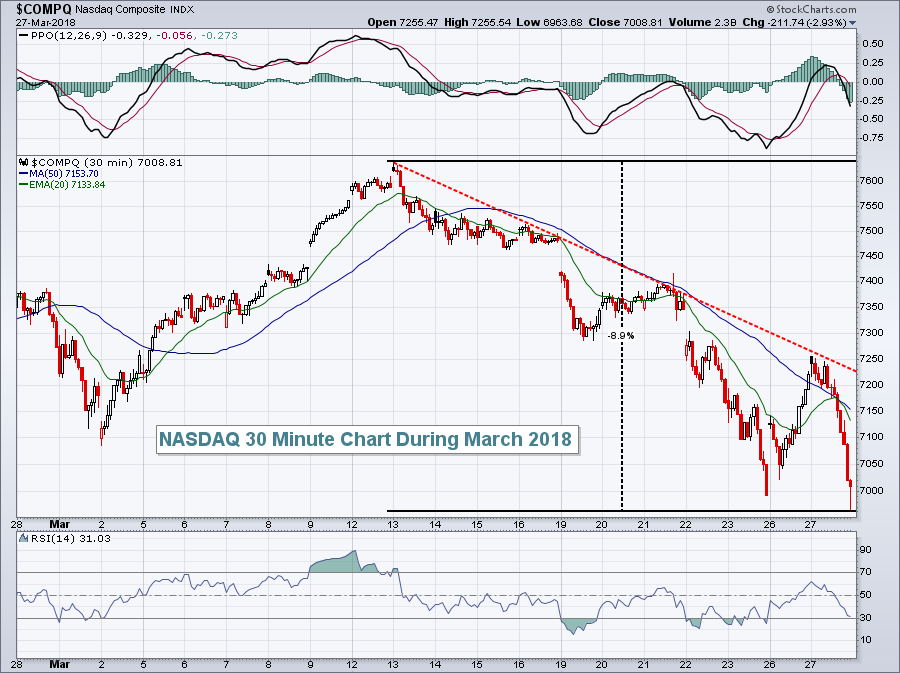
FAANG Stocks Slammed, NASDAQ Plummets
by Tom Bowley,
Chief Market Strategist, EarningsBeats.com
Market Recap for Tuesday, March 27, 2018
I've discussed since early February the difficulty in trading a market with an elevated Volatility Index ($VIX). While returns can be awesome when you make great calls, the opposite is true when your timing is less than perfect. Here's...
READ MORE
MEMBERS ONLY
Technology And Financials Bounce Back Strongly, U.S. Equities Surge
by Tom Bowley,
Chief Market Strategist, EarningsBeats.com
Market Recap for Monday, March 26, 2018
It was an impressive rally on Wall Street on Monday. All nine sectors advanced at least 1%. The four aggressive sectors - technology (XLK, +3.80%), financials (XLF, +3.24%), consumer discretionary (XLY, +2.95%) and industrials (XLI, +2.42%) - were the...
READ MORE
MEMBERS ONLY
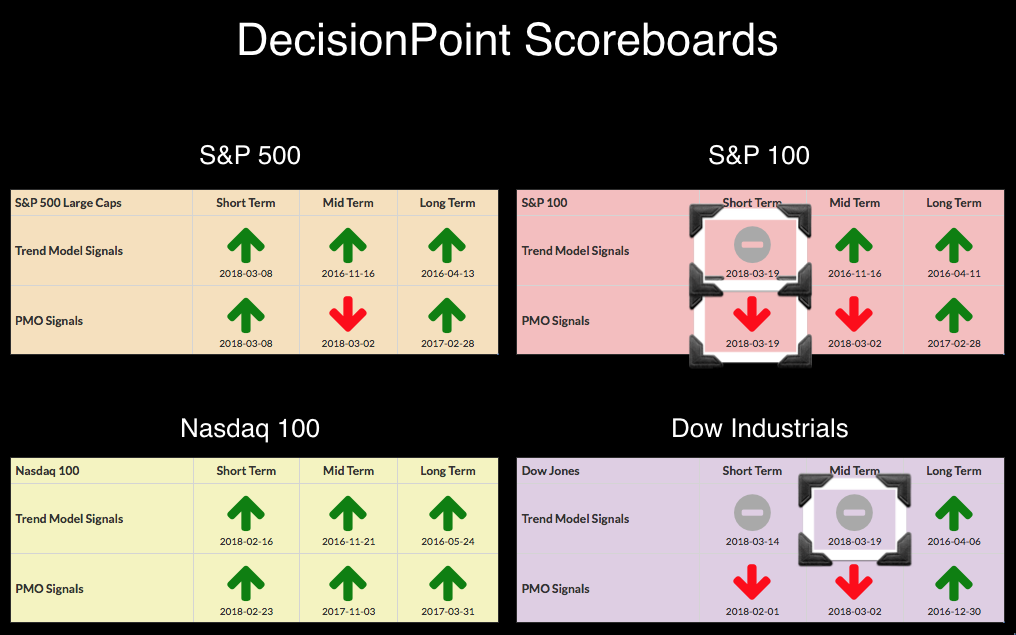
SPX and XLF Trigger IT Trend Model Neutral on Friday and NDX Loses IT PMO BUY Signal
by Erin Swenlin,
Vice President, DecisionPoint.com
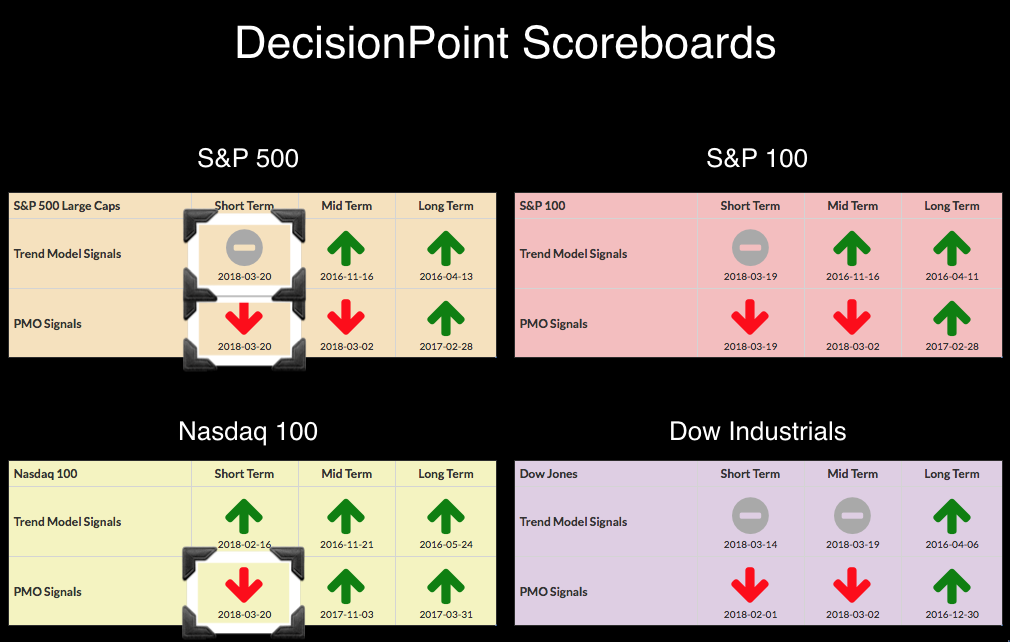
After day with the SPX up 2.72% and the NDX up 3.78%, it may seem strange to be talking about the loss of BUY signals on the DecisionPoint Scoreboards. My answer is that one day does not a bull market make. However, I'm not on board...
READ MORE
MEMBERS ONLY

S&P 500 Notebook

by Bruce Fraser,
Industry-leading "Wyckoffian"
I make lots of notes on my charts. As conditions unfold I have a sense for what my thinking was and whether adjustments need to be made in tactics. In the ‘good old days’ stock charts were plotted by hand and notes were jotted onto charts; now we have wonderful...
READ MORE
MEMBERS ONLY

An RSI Failure Swing in Ross Stores
by Arthur Hill,
Chief Technical Strategist, TrendInvestorPro.com
The S&P 500 was shaken with a plunge below its 200-day SMA on Friday and this gives chartists a reference point to compare with other charts.
Personally, I do not think moving averages represent support or resistance levels. Moving averages provide price points that chartists can use to...
READ MORE
MEMBERS ONLY

SystemTrader - Would you have the Nerve? - Revisiting Mean-Reversion and Adding Leverage
by Arthur Hill,
Chief Technical Strategist, TrendInvestorPro.com
* Universe, Market Regime and Ground Rules.
* Know Your Indicators.
* Sample Signals for IJR and QQQ.
* Testing the Big Four.
* Plotting Equity and Drawdowns.
* Testing Four Leveraged ETFs.
* Conclusions and Caveat Emptor!
Introduction and Overview...
Stocks fell sharply the last two weeks and RSI became oversold for most major index ETFs....
READ MORE
MEMBERS ONLY
Very Weak Financials Drive Dow Jones To Lowest Close in 2018
by Tom Bowley,
Chief Market Strategist, EarningsBeats.com
Market Recap for Friday, March 23, 2018
All of our major indices tumbled on Friday, but none are struggling quite the same as the Dow Jones, which fell another 425 points on Friday to close at its lowest level since November 2017. There are likely three reasons for this relative...
READ MORE
MEMBERS ONLY

Aftcasting

by Greg Morris,
Veteran Technical Analyst, Investor, and Author
Wall Street is loaded with experts who make forecasts on the future market direction and market level many times a day. If you see a rather serious technical analyst on television, you can count on the talking head interviewer to ask him/her where the market is going. They must...
READ MORE
MEMBERS ONLY

THE ALL COUNTRY WORLD INDEX IS HEADED FOR A TEST OF FEBRUARY SUPPORT -- SO IS THE S&P 500 WHICH IS ALSO TESTING A TRENDLINE EXTENDING BACK TO THE START OF 2016 -- FINANCIALS AND TECHNOLOGY ARE THE BIGGEST SECTOR LOSERS
by John Murphy,
Chief Technical Analyst, StockCharts.com
WORLD STOCK INDEX HEADED FOR A TEST OF ITS FEBRUARY LOW AND ITS 200-DAY AVERAGE... Stocks around the world had a terrible week. Foreign stocks fell along with the U.S. That's not unusual since global stocks become tightly correlated on the way down. Selling in Chinese stocks...
READ MORE
MEMBERS ONLY

Interest Rates. How High?
by Bruce Fraser,
Industry-leading "Wyckoffian"
The Federal Reserve Bank (Fed) has indicated their intention to raise interest rates during 2018 and 2019. In fact, US Treasury interest rates have been rising for quite some time. We have been following the movement of bond prices with a Wyckoffian eye during this downtrend of prices (click here...
READ MORE
MEMBERS ONLY

Breadth: Weighing Active Bullish Signals Against New Bearish Signals
by Arthur Hill,
Chief Technical Strategist, TrendInvestorPro.com
* Another Bearish Breadth Thrust.
* High-Low Percent Indicators Remain Bullish.
* %Above 200-day Indicators Dip below 50%.
* Index Table Remains Bullish.
* Sector Breadth Highlights.
* Bottom Line: Still a Bull Market.
Breadth Overview ...
The following breadth assessment is based on three breadth indicators. First, the 10-day EMA of AD Percent is used to...
READ MORE
MEMBERS ONLY
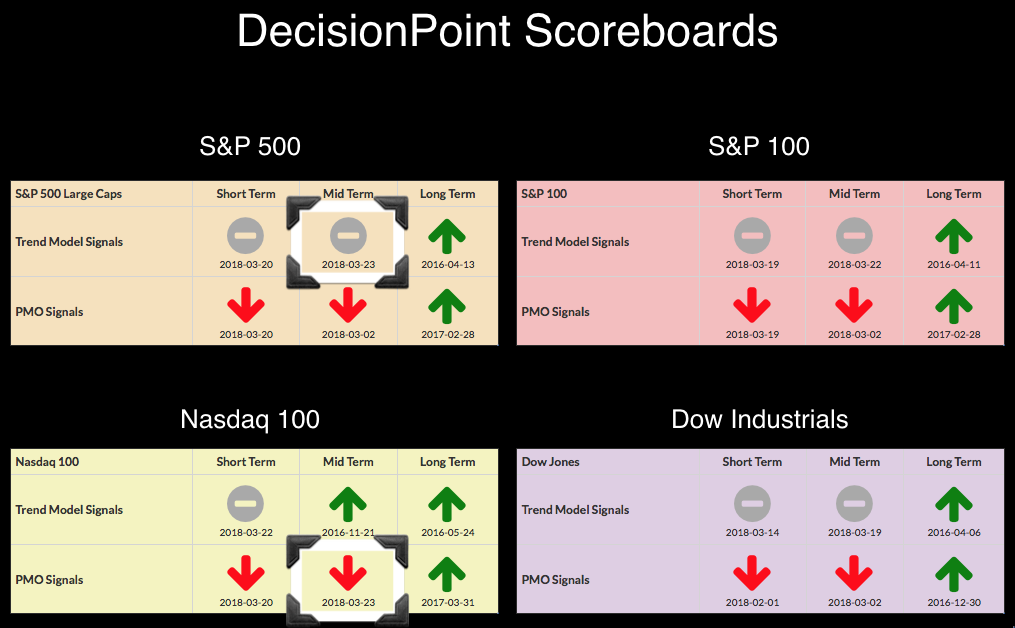
DP Weekly Wrap: Sixteen-Month BUY Signal Ends

by Carl Swenlin,
President and Founder, DecisionPoint.com
This week the rising wedge we had identified resolved downward, as expected. Once that happened, we needed to provide a context that could help determine an initial downside target, so we focused on the double top confirmation line, drawn across the low between the tops. That line was violated on...
READ MORE
MEMBERS ONLY

Weekly Market Review & Outlook (with Video) - As the Roller Coaster Turns
by Arthur Hill,
Chief Technical Strategist, TrendInvestorPro.com
* The 2018 Roller Coaster Continues.
* High-Low Line Turns Down for XLY.
* SPY Leads the Wedge Break Downs.
* XLF, XLV, XLY and XLB Break Wedge Lines.
* When Oversold is Not Such an Opportunity.
* XLI Breaks Triangle Support.
* Breakaway Gaps for XLK.
* Gold Bounces off Support Zone.
* Oil Holds Breakout.
* Notes from...
READ MORE
MEMBERS ONLY
Trade War Fears Send U.S. Stocks Reeling
by Tom Bowley,
Chief Market Strategist, EarningsBeats.com
Market Recap for Thursday, March 22, 2018
Let me start today's article by saying that the stock market loathes uncertainty. Traders love boring small gains day after day with subtle, anticipated pullbacks to key moving averages or short-term price support levels. You can always tell when the stock...
READ MORE
MEMBERS ONLY

NYSE Composite Draws Closer To Its 200-day And 12-month Moving Averages

by Martin Pring,
President, Pring Research
* Breadth is more of a positive than a negative factor
* Global breadth is also positive
* Dow Diffusion Indicator close to a buy signal
* Consumer cyclicals versus technology
Since early February, the US equity market, in the form of the NYSE Composite, has been in a trading range. This is flagged...
READ MORE
MEMBERS ONLY
Climactic Indicators Suggest Dead Cat Bounce Ahead - NDX and OEX Neutral Signals
by Erin Swenlin,
Vice President, DecisionPoint.com
Two more BUY signals were lost on the DecisionPoint Scoreboards. We haven't seen the Intermediate-Term Trend Model Neutral signals on the Scoreboards in over a year. This consistent deterioration is worrisome and combined with bearish chart patterns and indicators, I'd have to say the correction is...
READ MORE
MEMBERS ONLY

DOW AND S&P 500 BREAK TRENDLINE SUPPORT -- NASDAQ 100 FALLS BELOW 50-DAY AVERAGE -- INTERNET SOCIAL MEDIA STOCKS CONTINUE TO LEAD TECHNOLOGY SECTOR LOWER -- TENCENT HOLDINGS REFLECTS HEAVY SELLING IN CHINESE STOCKS
by John Murphy,
Chief Technical Analyst, StockCharts.com
U.S. STOCK INDEXES BREAK SUPPORT LINES ... Major U.S. stock indexes are under heavy selling today and are breaking some important support lines. Chart 1 shows the Dow Industrials falling below a trendline extending back to early February. That signals a possible drop back to its February intra-day low...
READ MORE
MEMBERS ONLY
Fed Raises Quarter Point, Energy Soars
by Tom Bowley,
Chief Market Strategist, EarningsBeats.com
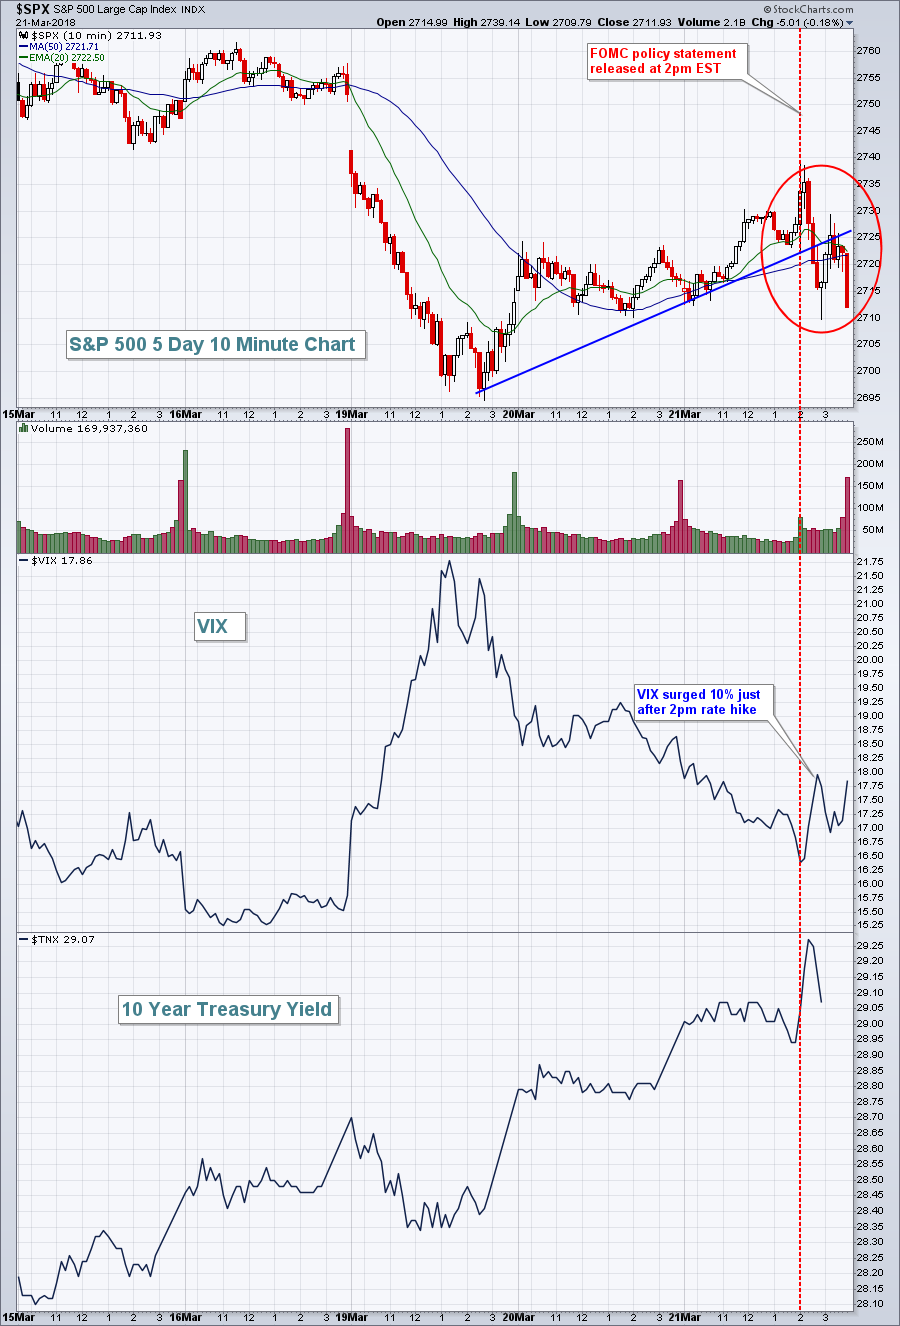
Market Recap for Wednesday, March 21, 2018
It was a volatile session on Wednesday, particularly after 2pm EST when the FOMC policy statement was released. In Fed Chairman Jerome Powell's first meeting as Fed Chief, the Fed raised the benchmark funds rate a quarter point from 1.50%...
READ MORE
MEMBERS ONLY

QQQ Traps Traders on the Island as SPY Extends Wedge Break
by Arthur Hill,
Chief Technical Strategist, TrendInvestorPro.com
* QQQ Holds Gap for Three Days.
* SPY Holds Wedge Break.
* Charting the Fab Five.
* MMM and Honeywell Join Dow Triangulation.
QQQ Traps Traders on the Island ...
QQQ formed an island reversal with Monday's gap down and held this gap for three days. Chartists sometimes apply time filters to...
READ MORE
MEMBERS ONLY

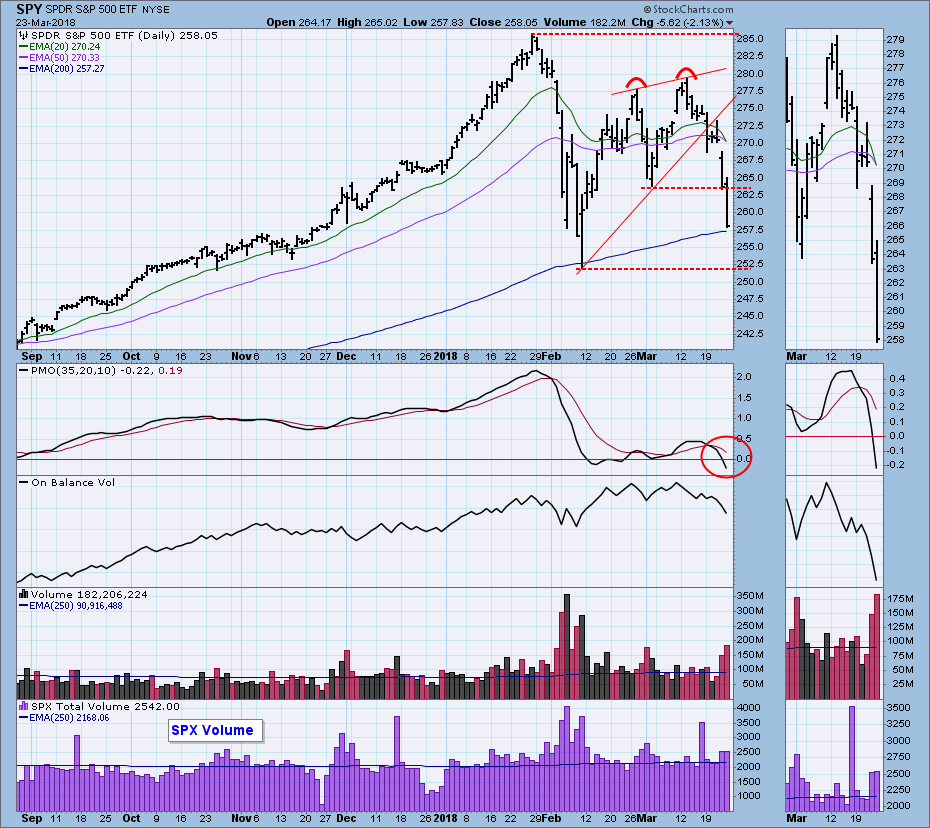
DP Alert: Bearish Double-Top on SPY - USO Breaks Out Big
by Erin Swenlin,
Vice President, DecisionPoint.com
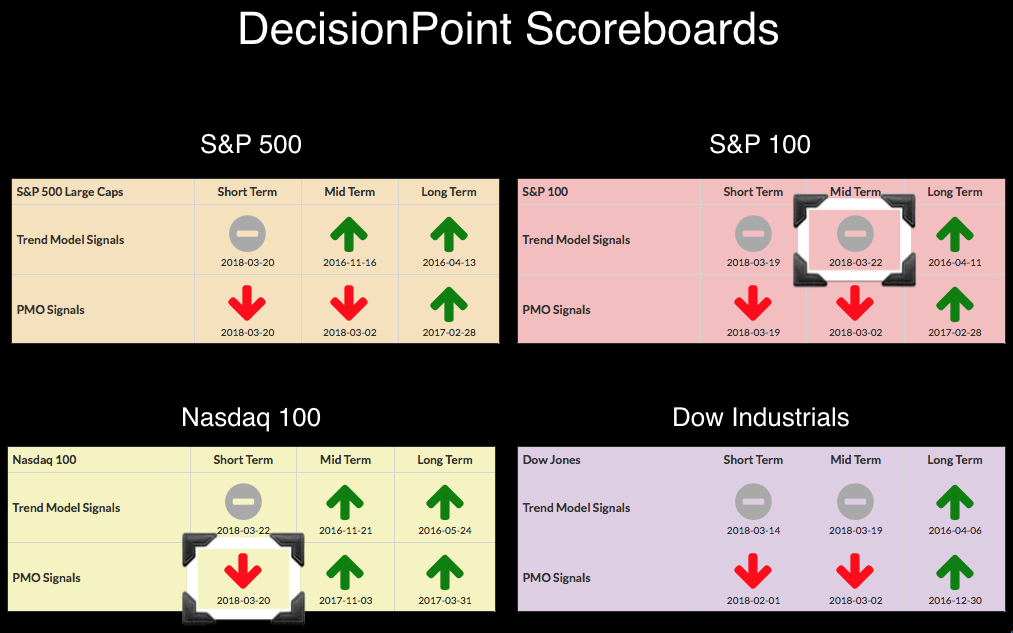
Below you'll find the latest DP Scoreboards. I've included a Sector Scoreboard that Carl and I will keep updated for analysis of sector rotation. The NDX is the only Scoreboard index holding its own. I don't think the NDX is out of the woods...
READ MORE
MEMBERS ONLY

Gold: Is this Another Head Fake or the Beginning of a Move?
by Arthur Hill,
Chief Technical Strategist, TrendInvestorPro.com
* Gold and the Dollar Hit Inflection Points.
* Dollar Bumps Into Short-term Resistance.
* Gold Miners Underperform Gold.
* GDX Tests Low End of Range.
Gold Channels Harden...
For the third time in six weeks, the Gold SPDR (GLD) is surging above the 125 level and making a bid to reverse within a...
READ MORE
MEMBERS ONLY

CRUDE OIL IS NEARING ANOTHER THREE-YEAR HIGH AND BOOSTING ENERGY SHARES -- ENERGY SPDR IS BOUNCING OFF MAJOR TRENDLINE SUPPORT AND 200-DAY AVERAGE -- OIL SERVICE ETF IS EVEN STRONGER -- ENERGY LEADERS ARE TRANSOCEAN, NATIONAL OILWELL, AND HESS
by John Murphy,
Chief Technical Analyst, StockCharts.com
PRICE OF OIL NEARS THREE-YEAR HIGH... WTIC Light Crude is trading more than 2% higher today near $65. The weekly bars in Chart 1 (plotted through yesterday) show Light Crude Oil also nearing another three-year high. Brent crude is in a similar situation. Chart 2 shows the United States Oil...
READ MORE
MEMBERS ONLY

Small-caps Catch a Little March Madness
by Arthur Hill,
Chief Technical Strategist, TrendInvestorPro.com
The S&P SmallCap iShares (IJR) held up better than the S&P 500 SPDR (SPY) during last week's decline and small-caps are outperforming large-caps in 2018.
The chart shows IJR moving above its late February high with a surge above the blue zone in mid-March....
READ MORE
MEMBERS ONLY
I'm Betting On The Gambling Stocks This Spring
by Tom Bowley,
Chief Market Strategist, EarningsBeats.com
Market Recap for Tuesday, March 20, 2018
There weren't huge gains on Tuesday, but given how poorly Monday went, I'd say yesterday was a very solid day. On Monday, we saw the Volatility Index ($VIX) spike more than 20% back above 19 as fear ramped up....
READ MORE
MEMBERS ONLY
NDX Catches the Bearish Contagion - SPX Loses Both Short-Term BUY Signals
by Erin Swenlin,
Vice President, DecisionPoint.com
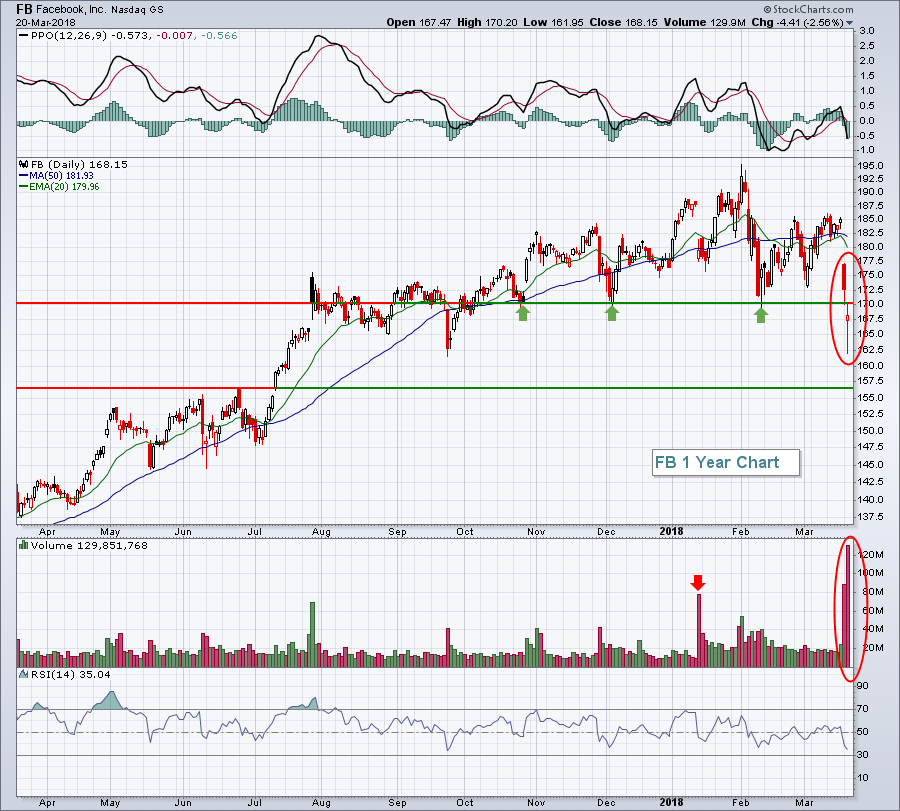
Just like dominos, the BUY signals on the DP Scoreboards are toppling and we're finally seeing some deterioration on the NDX. With Facebook (FB) and other technology stocks taking it on the chin the past few days, the NDX is finally succumbing to the downside pressure. A look...
READ MORE
MEMBERS ONLY

NEGATIVE DIVERGENCE LEADS TO TECH SELLING -- FACEBOOK FALLS TO SIX-MONTH LOW AND LEADS INTERNET GROUP LOWER -- TECH SECTOR MAY BE VULNERABLE TO MORE PROFIT-TAKING -- DOW INDUSTRIALS AND S&P 500 ARE TESTING POTENTIAL TRENDLINE SUPPORT
by John Murphy,
Chief Technical Analyst, StockCharts.com
OVER-EXTENDED TECHNOLOGY SPDR TURNS LOWER... Last Wednesday's message showed the technology sector looking over-extended and vulnerable to profit-taking. So this week's tech selling wasn't too much of a surprise. The daily bars in Chart 1 shows the Technology SPDR (XLK) falling yesterday in heavy...
READ MORE
MEMBERS ONLY
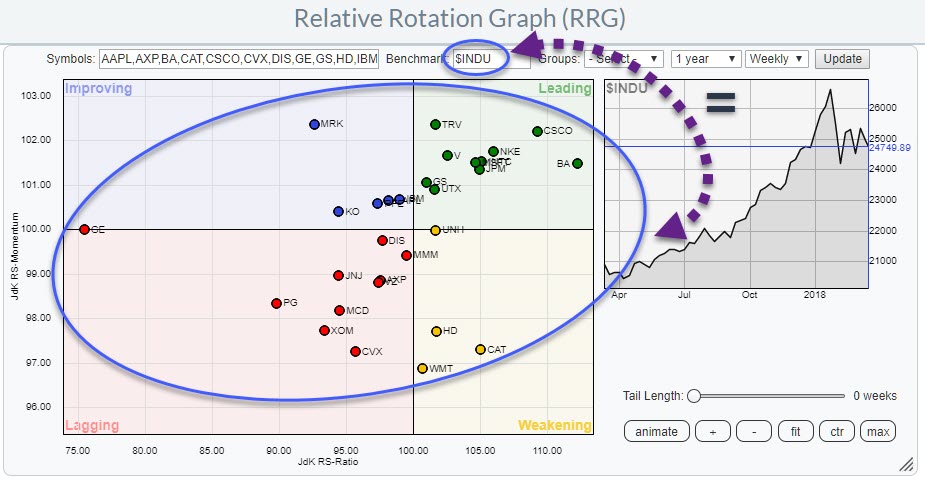
A view on Asset Class rotation and the difference between open and closed universes.

by Julius de Kempenaer,
Senior Technical Analyst, StockCharts.com
Last week I was the guest of Tom and Erin in their Market Watchers Live show on stockcharts.tv.
In that show, I talked about the difference between open and closed universes and what it means for a Relative Rotation Graph and following that discussion we had a look at...
READ MORE
MEMBERS ONLY

SPY Erases the Gap - ITA Bucks the Trend - Focus on Defense Stocks
by Arthur Hill,
Chief Technical Strategist, TrendInvestorPro.com
* Broad Selling in Technology.
* SPY Erases the Gap.
* New Floors and Ceilings.
* Defense Stocks Buck the Selling.
* Six Stocks with Bullish Continuation Patterns.
* Oil Consolidates within an Uptrend.
* Oil and XES Still Positively Correlated.
* XES Battles Retracement Zone.
Broad Selling in Technology ...
The technology sector led the way lower as...
READ MORE
MEMBERS ONLY
Facebook Shares Crater Amid Controversy; Leads Another Big Selloff
by Tom Bowley,
Chief Market Strategist, EarningsBeats.com
Market Recap for Monday, March 19, 2018
Ok, let's start with the obvious. It was an ugly day for U.S. equities. The Dow Jones, S&P 500, NASDAQ and Russell 2000 fell 1.35%, 1.42%, 1.84% and 0.98%, respectively. The Volatility Index ($VIX)...
READ MORE
MEMBERS ONLY
Dow Troubles: New IT Trend Model Neutral Signal - OEX Triggers ST Bearish Signals - Indicators Bearish
by Erin Swenlin,
Vice President, DecisionPoint.com
You'll note three BUY signals were lost today on the Dow and the OEX. The Industrials have been struggling. The Dow was unable to trigger a PMO BUY signal when the other three indexes had managed them with ease. The picture is getting worse for the Dow and...
READ MORE
MEMBERS ONLY

Investors Cut the Cord on Disney
by Arthur Hill,
Chief Technical Strategist, TrendInvestorPro.com
Dow component Disney (DIS) is feeling the heat today with a triangle break and move below the 200-day moving average.
Disney has been one of the weaker stocks in the Dow Industrials over the last few years. The stock peaked way back in August 2015 and formed lower highs the...
READ MORE
MEMBERS ONLY
Building a Rules-Based Trend Following Model - 7
by Greg Morris,
Veteran Technical Analyst, Investor, and Author
This article is a follow up of the previous one in this series - Building a Rules-Based Trend Following Model - 6. Table A is an example of the detailed research behind each of the various indicators used in the weight of the evidence. This example uses over 30 years...
READ MORE
MEMBERS ONLY
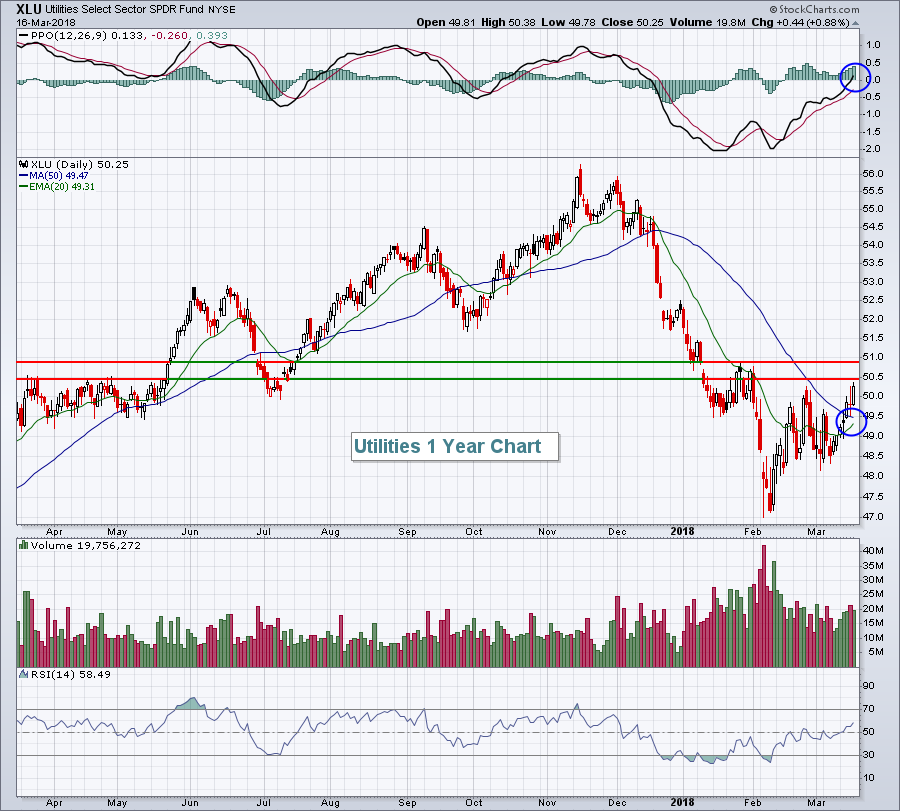
Energy And Utilities Fuel Dow Jones Rise
by Tom Bowley,
Chief Market Strategist, EarningsBeats.com
Market Recap for Friday, March 16, 2018
There was an industry-wide rally in energy stocks (XLE, +0.89%) on Friday and utilities (XLU, +0.88%) also performed well. The latter looks much better technically, however, as it has broken above its 50 day SMA. There's still much work...
READ MORE
MEMBERS ONLY
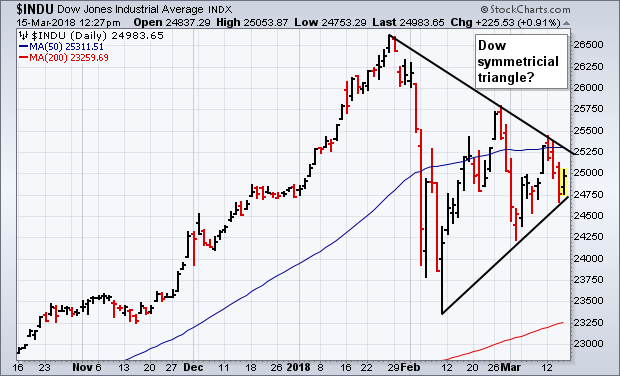
Dow Industrials May Be Forming a Triangle of Their Own
by John Murphy,
Chief Technical Analyst, StockCharts.com
Editor's Note: This article was originally published in John Murphy's Market Message on Thursday, March 15th at 12:34pm ET
The two converging trendlines in the chart below show the Dow Industrials forming a potential "symmetrical triangle" (which has one trendline falling and the...
READ MORE
MEMBERS ONLY
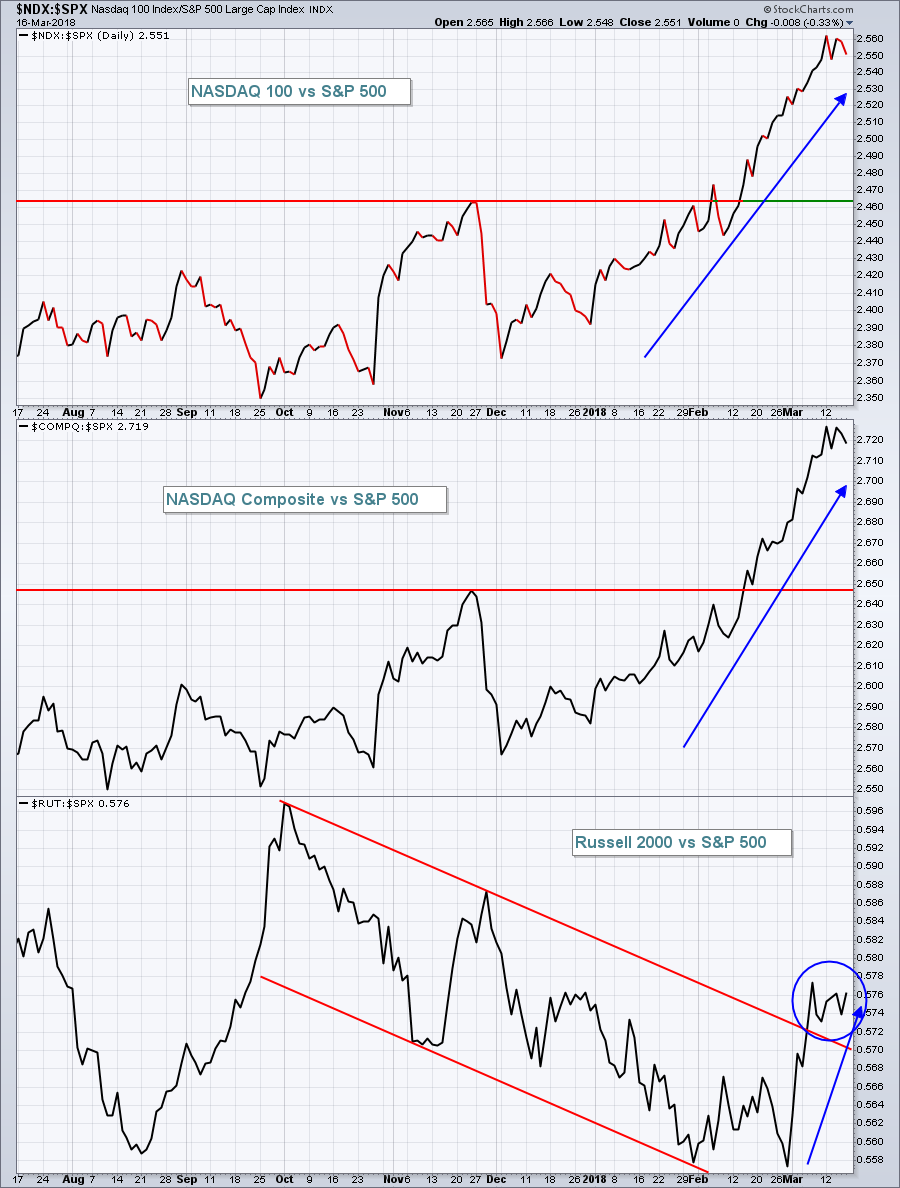
Here Are Two Seasonal Winners In The NASDAQ 100 For April And May
by Tom Bowley,
Chief Market Strategist, EarningsBeats.com
The NASDAQ Composite and NASDAQ 100 became the first two key indices to break to fresh all-time highs and their 2018 relative strength can be underscored by this chart:
The NASDAQ 100 is seeing money rotate its way in 2018 so it's prudent to focus on this index...
READ MORE
MEMBERS ONLY

Dow Industrials Coils Up as Breakout Nears
by Arthur Hill,
Chief Technical Strategist, TrendInvestorPro.com
The Dow Industrials is in the midst of a narrowing consolidation and chartists should watch the March range for the next directional clue.
The 2018 range extends from the January high (26,617) to the February low (23,360), which is 3257 points or around 13% of the current close....
READ MORE