MEMBERS ONLY
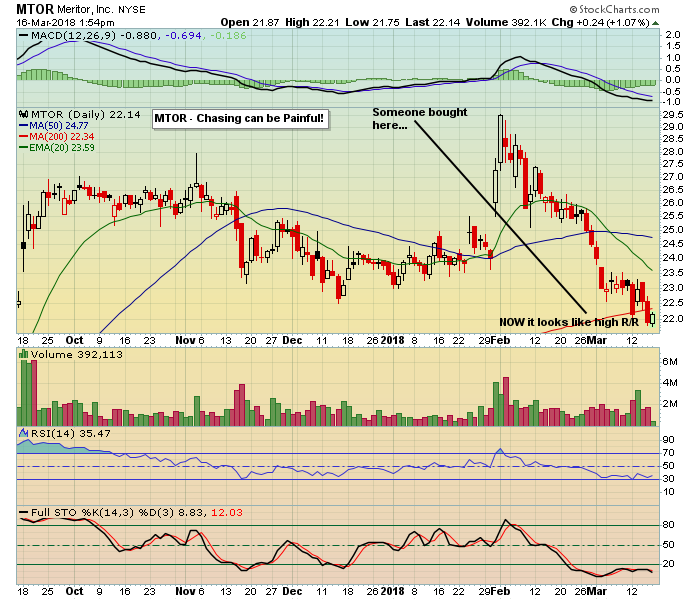
No Need to Rush into a Trade

by John Hopkins,
President and Co-founder, EarningsBeats.com
If there's one thing I've learned over my many years trading in the market, it's to avoid chasing a stock, especially if it's overbought. This might seem like an obvious strategy but many traders are drawn to those stocks that are ascending...
READ MORE
MEMBERS ONLY
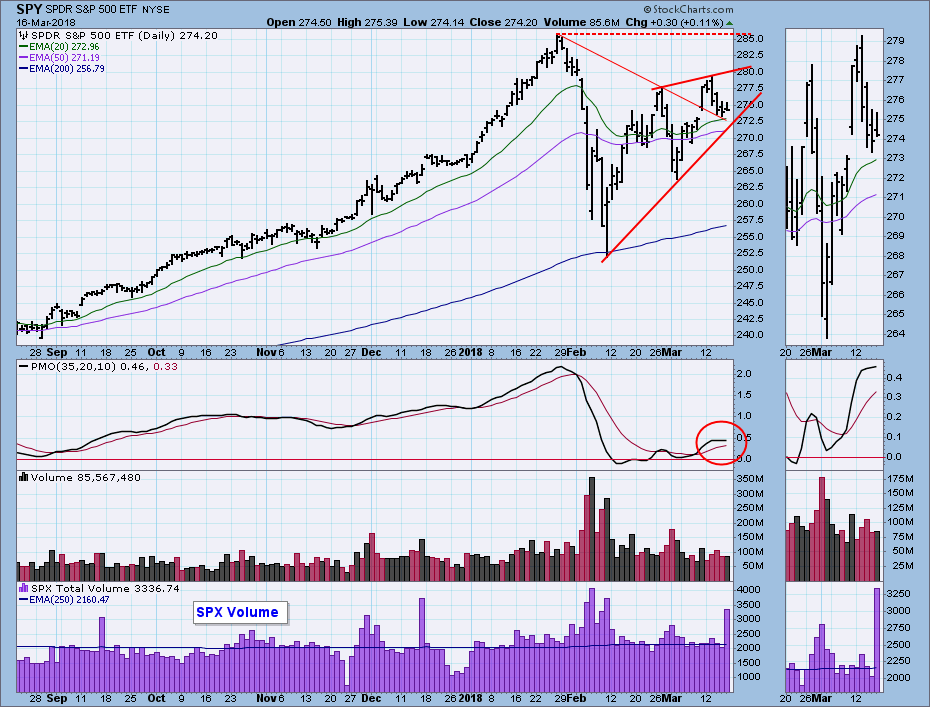
DP Weekly Wrap: Bearish Rising Wedge Appears

by Carl Swenlin,
President and Founder, DecisionPoint.com
First, the super high S&P 500 volume today was because of options expiration, so don't read anything else into it.
Last Friday's encouraging breakout is looking like a short-term bull trap , as the market pulled back to the declining tops line support this week....
READ MORE
MEMBERS ONLY
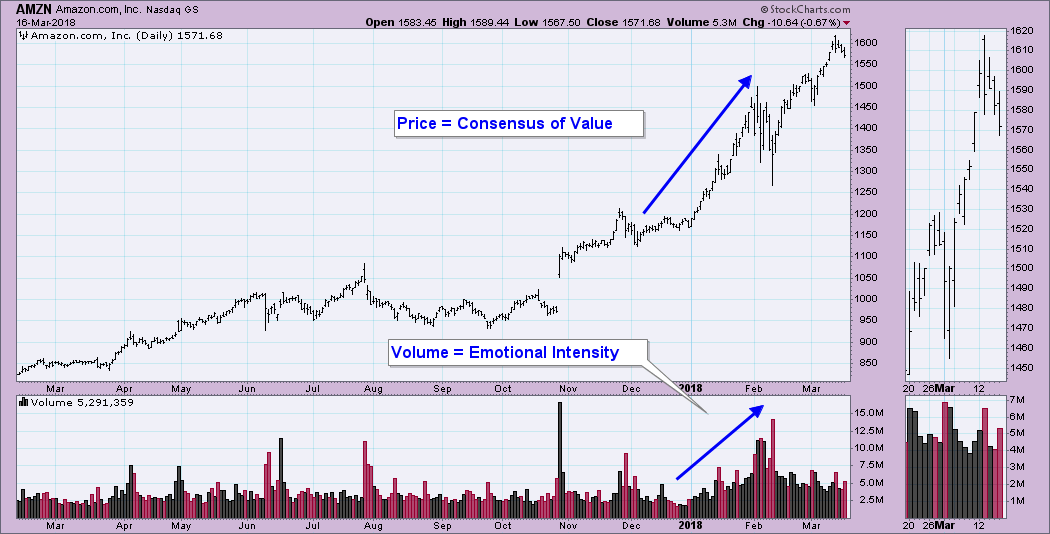
Why Is Volume Important?

by Erin Swenlin,
Vice President, DecisionPoint.com
On Friday's MarketWatchers LIVE program, I did a workshop on volume. Highly recommend you check it out on the StockCharts YouTube Channel or it is available under the webinars tab until Monday's show begins. We talk about volume all the time, but why is understanding and...
READ MORE
MEMBERS ONLY
Bitcoin Is A Mania But Is It Over?

by Martin Pring,
President, Pring Research
* Longer-term perspective
* Short-term Charts
* Dollar trying to break to the upside
Longer-term perspective
At its December 18 peak of $18,723, the Bitcoin Index ($NYXBT) outstripped all other bull markets in recorded history. By this yardstick alone this phenomenon qualifies as a mania. So far, the post high, low water...
READ MORE
MEMBERS ONLY

Two Years of Action Practice Exercises: An Introduction and Index

by Gatis Roze,
Author, "Tensile Trading"
I’ve been teaching investment courses across North America for over 18 years now – in seminars, at conferences, to professional organizations and, most recently, through our own investment education company, Stock Market Mastery. By last count, I’ve had over 5,000 students.
When it comes to different investor types,...
READ MORE
MEMBERS ONLY

Weekly Market Review & Outlook (with Video) - Monitoring the Sector High-Low Lines

by Arthur Hill,
Chief Technical Strategist, TrendInvestorPro.com
* Pop and Drop for Two Key Sectors.
* SPY Approaches First Test.
* High-Low Percent Pops and Drops.
* Sector High-Low Lines Still Rising.
* Big Sectors Remain Mixed.
* Gold Corrects within Correction.
* Treasury Bonds Get Oversold Bounce.
* Funding the Growing Deficit.
* Notes from the Art's Charts ChartList.
The S&P...
READ MORE
MEMBERS ONLY
Several Technical Signs Pointing To A Surge In The US Dollar

by Tom Bowley,
Chief Market Strategist, EarningsBeats.com
Market Recap for Thursday, March 15, 2018
It was just another day of bifurcated action on Wall Street. But this time it featured a strengthening Dow Jones. The Dow gained 0.47%, while the S&P 500, NASDAQ and Russell 2000 fell 0.08%, 0.20% and 0.49%...
READ MORE
MEMBERS ONLY

THE DOW TRANSPORTS ARE ALSO STRUGGLING AT 50-DAY AVERAGE -- BUT MAY BE FORMING ASCENDING TRIANGLE -- THE DOW INDUSTRIALS MAY BE FORMING BULLISH TRIANGLE OF ITS OWN -- THAT WOULD FIT INTO ELLIOTT WAVE FOUR CONSOLIDATION PATTERN

by John Murphy,
Chief Technical Analyst, StockCharts.com
DOW TRANSPORT UPTREND IS ALSO STALLED AT 50-DAY AVERAGE... Yesterday's message showed the Dow Industrials falling below their 50-day average. Today's message shows the Dow Transports doing the same. The daily bars in Chart 1 show the Dow Jones Transportation Average backing off from a test...
READ MORE
MEMBERS ONLY
The Dollar's January Bottom Is Spooking Stocks In This Major Index
by Tom Bowley,
Chief Market Strategist, EarningsBeats.com
Market Recap for Wednesday, March 14, 2018
The U.S. stock market continued its bifurcated ways on Wednesday. While all of our major indices declined, it was not across-the-board selling. The Dow Jones (-1.00%) saw the brunt of the selling, while the NASDAQ Composite (-0.19%) outperformed by a...
READ MORE
MEMBERS ONLY
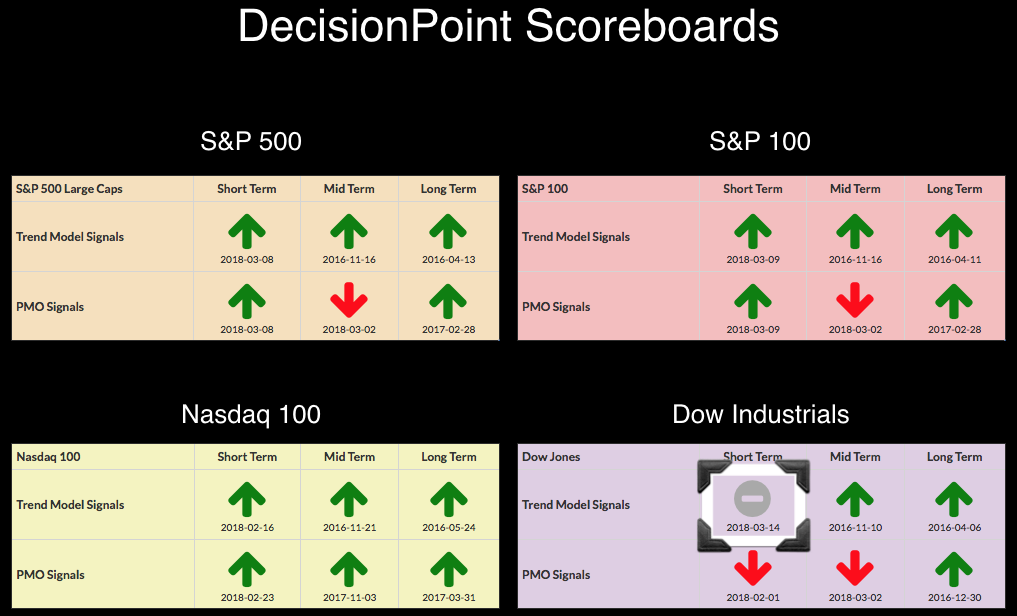
Dow's Weakness and DP Indicators Suggest Gloomy Short Term
by Erin Swenlin,
Vice President, DecisionPoint.com
It was only yesterday that I added a new BUY signal to the Dow's Scoreboard and today, it's already gone. The Short-Term Trend Model (STTM) is based on 5/20-EMA crossovers. The Dow's 5-EMA crossed below the 20-EMA while it was above the 50-EMA--that...
READ MORE
MEMBERS ONLY

Centene Moves to Recapture 50-day SMA
by Arthur Hill,
Chief Technical Strategist, TrendInvestorPro.com
Centene (CNC), which is part of the healthcare sector, sports a steady uptrend over the past year and recently surged towards its 50-day SMA.
First and foremost, the long-term trend is clearly up because the stock recorded a 52-week high in January, the 50-day SMA is above the 200-day SMA...
READ MORE
MEMBERS ONLY

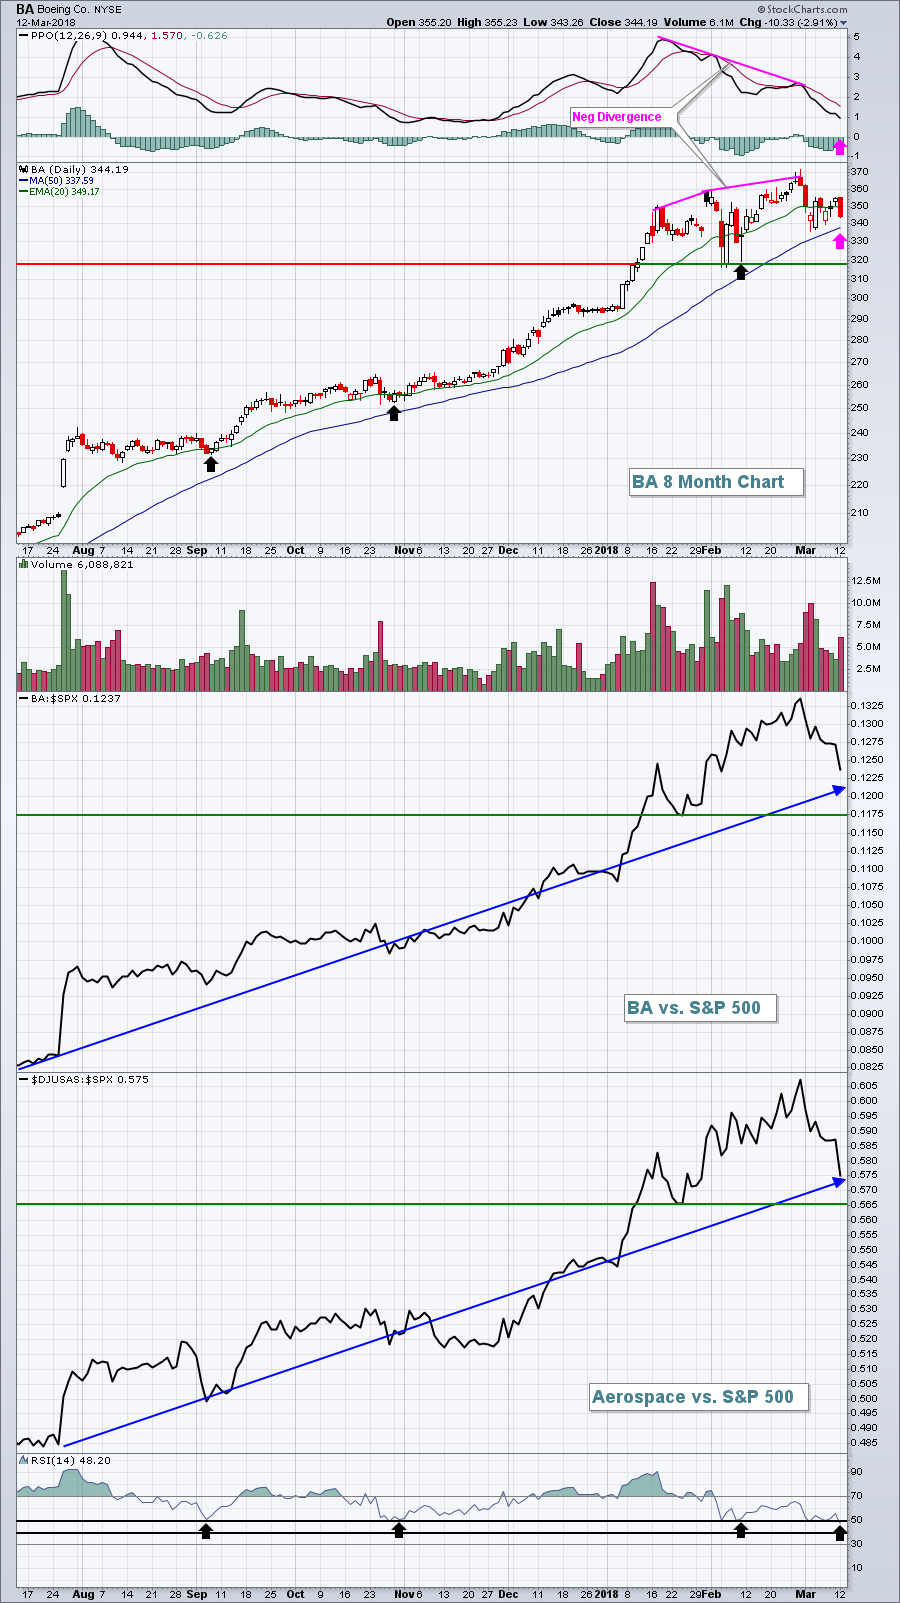
STOCK UPTREND WEAKENS -- INDUSTRIAL SPDR RUNS INTO RESISTANCE AT 50-DAY LINE -- BOEING LEADS AEROSPACE LOWER -- ALUMINUM AND CHEMICALS PULL MATERIALS SPDR LOWER -- DOW INDUSTRIALS FALL BELOW 50-DAY LINE AS S&P 500 STALLS AT FEBRUARY HIGH
by John Murphy,
Chief Technical Analyst, StockCharts.com
BOEING LEADS INDUSTRIAL SPDR BELOW ITS 50-DAY LINE... The stock rally is starting to lose some upside momentum. That's partially because some market sectors are running into resistance at their 50-day moving average. The daily bars in Chart 1 show the Industrial Sector SPDR (XLI) slipping back below...
READ MORE
MEMBERS ONLY
Internet, Technology Stocks Lead Southbound Train
by Tom Bowley,
Chief Market Strategist, EarningsBeats.com
Market Recap for Tuesday, March 13, 2018
It appears to be a case of "too much of a good thing". Technology stocks (XLK, -1.15%) retreated off of a 60 minute negative divergence and that reverberated throughout most parts of the NASDAQ (-1.02%), which led our major...
READ MORE
MEMBERS ONLY

Non-confirmations Persist, but Bulls have the Edge in this Stock Pickers Market
by Arthur Hill,
Chief Technical Strategist, TrendInvestorPro.com
* Non-confirmations Continue to Nag.
* Setting the Benchmark Highs.
* RSP Sector Weights are Quite Different.
* EW Consumer Discretionary and Industrials Lag.
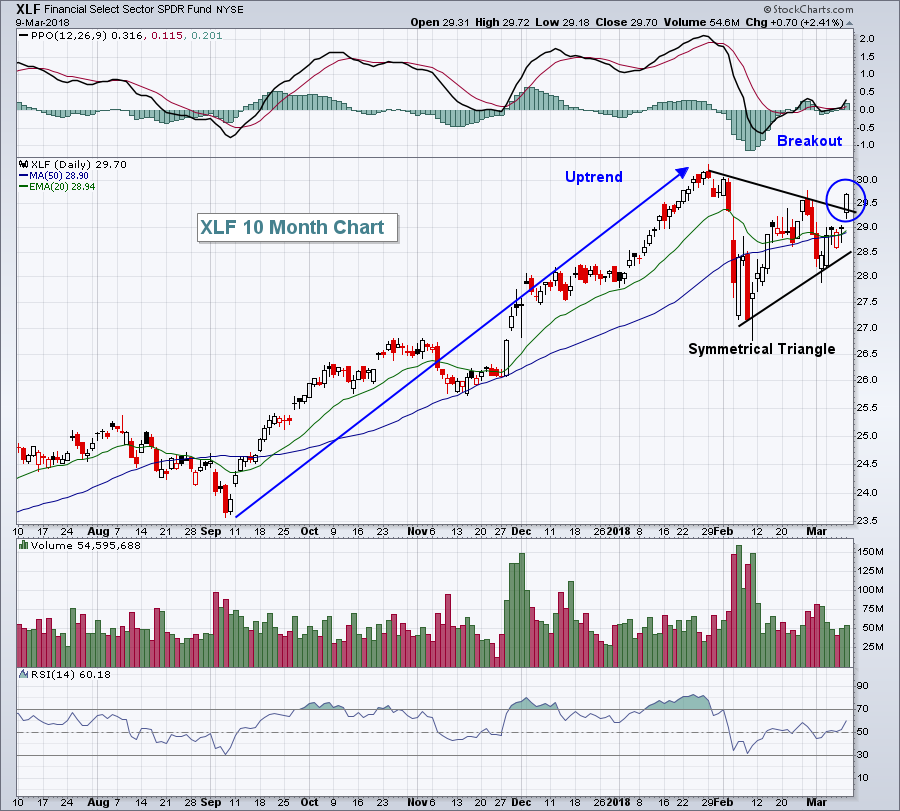
* XLF and XLY Trigger Triangle Breaks.
* A Stock Picker's Market.
Non-confirmations Continue to Nag...
The Nasdaq 100 brothers, Nasdaq Composite and Nasdaq 100, were the only two major...
READ MORE
MEMBERS ONLY
Tesla, Autos Gain Traction As NASDAQ Records 2nd Straight Record
by Tom Bowley,
Chief Market Strategist, EarningsBeats.com
Market Recap for Monday, March 12, 2018
While we saw bifurcated action on Monday, it was still mostly bullish action. For starters, the more aggressive NASDAQ (+0.36%) and Russell 2000 (+0.25%) finished in positive territory while the safer indices - Dow Jones (-0.62%) and S&P...
READ MORE
MEMBERS ONLY
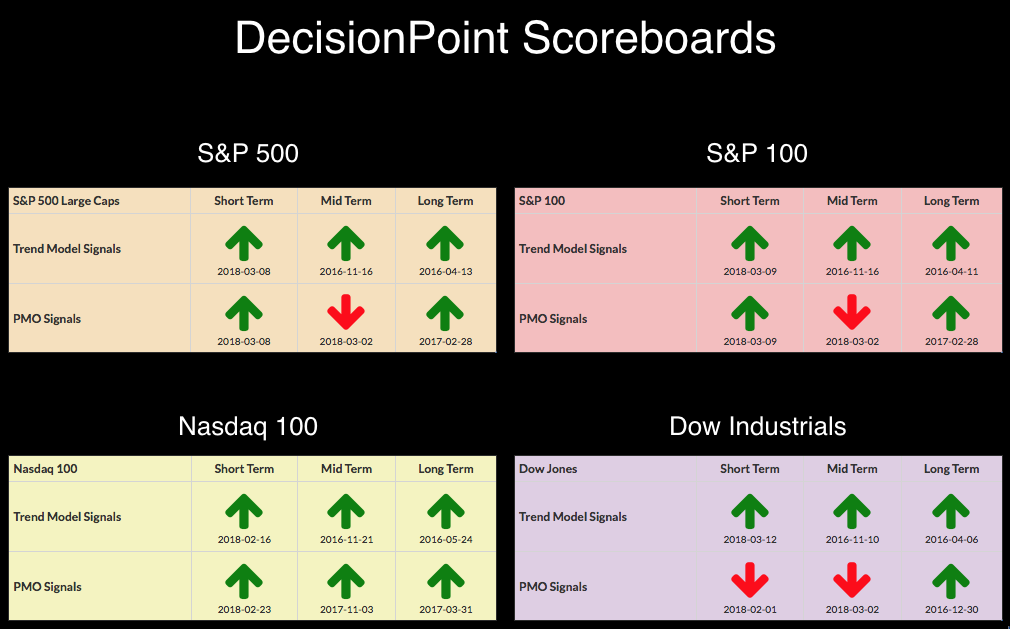
DP Bulletin: OEX & Dow Get New Buy Signals
by Erin Swenlin,
Vice President, DecisionPoint.com
On Friday, the OEX managed to get both a new Short-Term Trend Model (STTM) BUY signal and a Short-Term Price Momentum Oscillator (PMO) BUY signal. At the time the Dow was the only Scoreboard to not have ST buy signals. Today that changed with a new STTM Buy signal for...
READ MORE
MEMBERS ONLY
Scanning 30 Dow stocks in two minutes on a Relative Rotation Graph

by Julius de Kempenaer,
Senior Technical Analyst, StockCharts.com
In this blog, I will take another look at the 30 stocks that make up the DJ Industrials index.
A quick look learns that the real outsider in this index is GE which is positioned far to the left on the RRG, moving higher (almost vertical) on the JdK RS-Momentum...
READ MORE
MEMBERS ONLY

Momentum and Money Flow Take a Turn in LabCorp
by Arthur Hill,
Chief Technical Strategist, TrendInvestorPro.com
Laboratory Corporation of America Holdings (LH) is looking bullish as the Moving Average Convergence Divergence (MACD) turns up and Chaikin Money Flow pops.
On the price chart, the long-term trend is up because LH hit a new high in January, the 50-day EMA is above the 200-day EMA and price...
READ MORE
MEMBERS ONLY

Measuring the Weight of the Evidence with Breadth Indicators
by Arthur Hill,
Chief Technical Strategist, TrendInvestorPro.com
* Breadth Indicators Strengthen.
* Nasdaq 100 Leads AD Percent Rebound.
* $SPX High-Low% Signals End of Correction.
* Large-caps Lead %Above 200-day EMA.
* Broad Market Breadth Table.
* Sector Breadth Table.
* Links for Sector Breadth Charts.
Breadth Indicators Strengthen...
A couple of breadth indicators flipped from bearish to bullish with last week's...
READ MORE
MEMBERS ONLY
Huge Jobs Report Sends NASDAQ To All-Time Highs
by Tom Bowley,
Chief Market Strategist, EarningsBeats.com
Market Recap for Friday, March 9, 2018
The U.S. stock market was back to its old bull market tricks on Friday as the NASDAQ powered 133 points higher (+1.79%) to close at 7560.81 - its highest ever - and end its correction that began with the high...
READ MORE
MEMBERS ONLY

Building a Rules-Based Trend Following Model - 6

by Greg Morris,
Veteran Technical Analyst, Investor, and Author
It is time to start getting into the measures/indicators to be used in the model. Note: When I was presenting at the big wire houses, I used the term measures as seemed to be easier for advisors to understand. Now, dealing primarily with technical analysts, indicators seems more appropriate....
READ MORE
MEMBERS ONLY

Combining Wyckoff and Relative Strength to Find Big Trends

by Bruce Fraser,
Industry-leading "Wyckoffian"
In stock chart analysis the closest thing to X-Ray vision is Relative Strength. Often Relative Strength provides us with early price direction clues. Generally, when Relative Strength (RS) is in a rising trend and price is in a rising trend, this trend will persist. We define a trend as higher...
READ MORE
MEMBERS ONLY
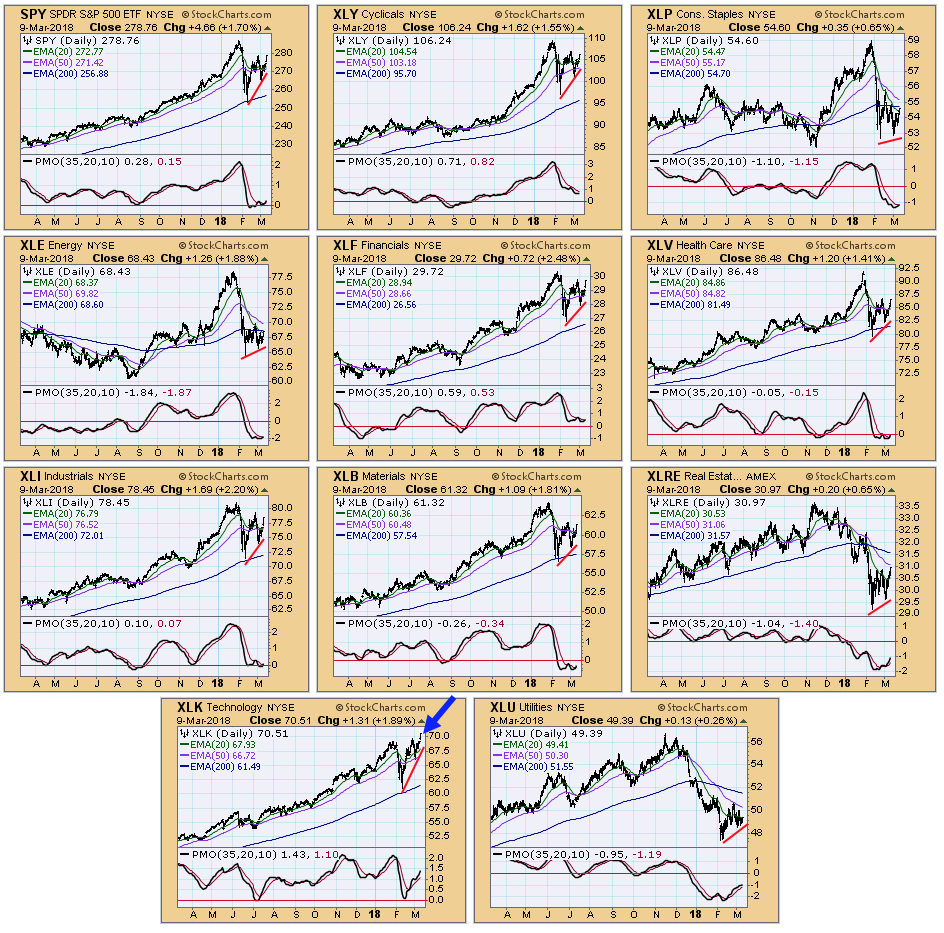
DP Weekly Wrap: Double Bottoms Abound
by Carl Swenlin,
President and Founder, DecisionPoint.com
Friday was an exceptionally positive day, as prices advanced on good news regarding North Korea and jobs. Here are charts of the S&P 500 (SPY) and the 10 major sectors. The recurring theme we see is the double bottom. One exception is Utilities (XLU), which hasn't...
READ MORE
MEMBERS ONLY

STOCKS RALLY ON STRONG JOBS REPORT WITH SMALLER WAGE GAIN -- S&P 500 CLEARS 50-DAY AVERAGE -- NASDAQ 100 HITS NEW RECORD -- SEMICONDUCTOR ISHARES ARE LEADING THE QQQ INTO RECORD TERRITORY -- LAM RESEARCH AND INTEL HIT NEW RECORDS
by John Murphy,
Chief Technical Analyst, StockCharts.com
STRONG EMPLOYMENT REPORT BOOSTS STOCKS... A blockbuster employment report this morning is giving a big boost to stocks which were already in rally mode going into the report on easing tariff concerns from yesterday afternoon. U.S. employers added 313,000 jobs in February which was way above estimates and...
READ MORE
MEMBERS ONLY

Weekly Market Review & Outlook (with Video) - Market Likes a Teenage VIX
by Arthur Hill,
Chief Technical Strategist, TrendInvestorPro.com
* VIX is a Teenager Again.
* $NDX and $SML AD Lines Lead.
* New Highs Still Dragging.
* Small-caps, Large-caps, Tails and Dogs.
* Six Leading Sectors (and Four Laggards).
* A Pop and Drop for Gold.
* Oil Forms Lower High.
* The Incredibly Shrinking Stock Market.
* Notes from the Art's Charts ChartList.
VIX...
READ MORE
MEMBERS ONLY
Defensive Stocks Lead Thursday's Rally; Warning Sign?
by Tom Bowley,
Chief Market Strategist, EarningsBeats.com
Market Recap for Thursday, March 8, 2018
It's never a great signal to see the stock market rally and the three defensive sectors - consumer staples (XLP, +0.91%), utilities (XLU, +0.74%) and healthcare (XLV, +0.67%) - sit atop the sector leaderboard. But we also shouldn&...
READ MORE
MEMBERS ONLY
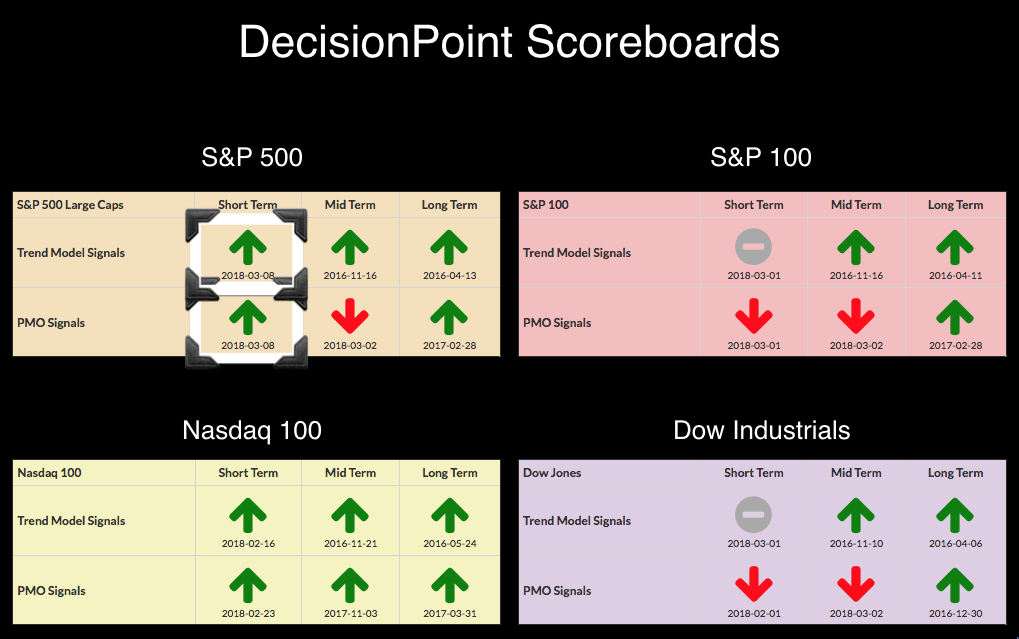
SPX Scoreboard Adds Buy Signals - Is Correction Over?
by Erin Swenlin,
Vice President, DecisionPoint.com
Let's get that title question answered right now...No, I don't think the correction is over. Yes, today we got both a ST Price Momentum Oscillator (PMO) BUY signal and an ST Trend Model BUY signal. The chart still has problems.
We had Tushar Chande on...
READ MORE
MEMBERS ONLY

What Will It Take To Trigger A Bull Market In The Dollar?
by Martin Pring,
President, Pring Research
* The indicated main trend is currently bearish
* What a more broadly-based Dollar index is saying
* Swiss Franc completes a small top
* Copper and the Dollar
The indicated main trend is currently bearish
The Dollar Index peaked in November 2016 and has so far bottomed in January of this year. If...
READ MORE
MEMBERS ONLY

LATE STOCK BUYING SHOWS POSITIVE REACTION TO TARIFF SPEECH -- S&P 500 CLOSES AT 50-DAY AVERAGE -- FIVE-MINUTE PRICE BARS SHOW STRONG BUYING IN FINAL MINUTES -- THE VIX NEARS TWO-WEEK LOW -- THE NASDAQ MARKET IS HEADED FOR ANOTHER TEST OF 2018 HIGHS
by John Murphy,
Chief Technical Analyst, StockCharts.com
S&P 500 CLOSES JUST SHY OF ITS 50-DAY AVERAGE... Late buying today pushed stocks higher and on rising volume. The daily bars in Chart 1 show the S&P 500 rising 12 points today (0.46%) to end at 2738 which is one point shy of its...
READ MORE
MEMBERS ONLY
Railroads Hold One Of The Bull Market Keys
by Tom Bowley,
Chief Market Strategist, EarningsBeats.com
Market Recap for Wednesday, March 7, 2018
It was a day of bifurcation, but it was good bifurcation - if that makes any sense. When the stock market jury is split as we saw on Wednesday, I prefer that our aggressive market areas perform well and defensive areas lag. Well,...
READ MORE
MEMBERS ONLY

Finding Strong Stocks and Avoiding Weak Ones - Steel, Brokers, Defense and More
by Arthur Hill,
Chief Technical Strategist, TrendInvestorPro.com
* Separating the Leaders from the Laggards.
* Flying Flags for Commercial Metals and Nucor.
* Broker-Dealer iShares Leads with New High.
* Morgan Stanley and the 3 Discount Brokers.
* Defense and Aerospace ETF Fully Recovers.
* General Dynamics and Lockheed Martin.
* Verisign, Bristol-Meyers and Fastenal.
Finding the Strongest Stocks....
When dealing with stocks, we...
READ MORE
MEMBERS ONLY

DP Alert: Mixed Messages Warrant Caution
by Erin Swenlin,
Vice President, DecisionPoint.com
It's days like today that I find it frustrating to write (probably why this is posted late). It's not really writers' block, but the many mixed messages or lack of messages I'm getting on the charts right now. I could probably make a...
READ MORE
MEMBERS ONLY

SMALLER STOCKS ARE LEADING THE MARKET HIGHER -- S&P SMALL AND MIDCAP INDEXES NEAR UPSIDE BREAKOUTS -- THE S&P 500 SHOULD FOLLOW THEM HIGHER -- NASDAQ STRENGTH IS ALSO A POSITIVE SIGN
by John Murphy,
Chief Technical Analyst, StockCharts.com
SMALL AND MIDCAP STOCKS INDEXES CLEAR 50-DAY AVERAGES... Last Wednesday's message pointed out that smaller stocks were leading large caps lower. Small and midcap indexes had fallen below their 50-day average which increased odds that the S&P 500 would do the same, which it did. Today,...
READ MORE
MEMBERS ONLY

Revenge of the Small Caps
by Arthur Hill,
Chief Technical Strategist, TrendInvestorPro.com
The S&P 500 SPDR (SPY) is pretty much unchanged over the last five trading days and the respective sector SPDRs are mixed. The story is a bit different for small-caps because the S&P SmallCap iShares (IJR) is up over 3% the last five days and the...
READ MORE
MEMBERS ONLY

SystemTrader - The Turn of the Month Strategy
by Arthur Hill,
Chief Technical Strategist, TrendInvestorPro.com
* Turn of the Month Strategy.
* Testing the Last and First Days of the Month.
* Turn of the Month Results.
* Plotting the Equity Curve.
* Charting Recent Results.
* Conclusions and Takeaways.
The turn of the month shows a strong bullish bias, regardless of the broad market trend.
Today we will examine stock...
READ MORE
MEMBERS ONLY
Retail Regaining Strength And In The Middle Of Its Seasonal Sweet Spot
by Tom Bowley,
Chief Market Strategist, EarningsBeats.com
Market Recap for Tuesday, March 6, 2018
Materials (XLB, +1.10%) and consumer discretionary (XLY, +0.69%) led a modest stock market rally here in the U.S. on Tuesday. The small cap Russell 2000 gained more than 1% to once again outperform its larger cap counterparts. The NASDAQ also...
READ MORE
MEMBERS ONLY
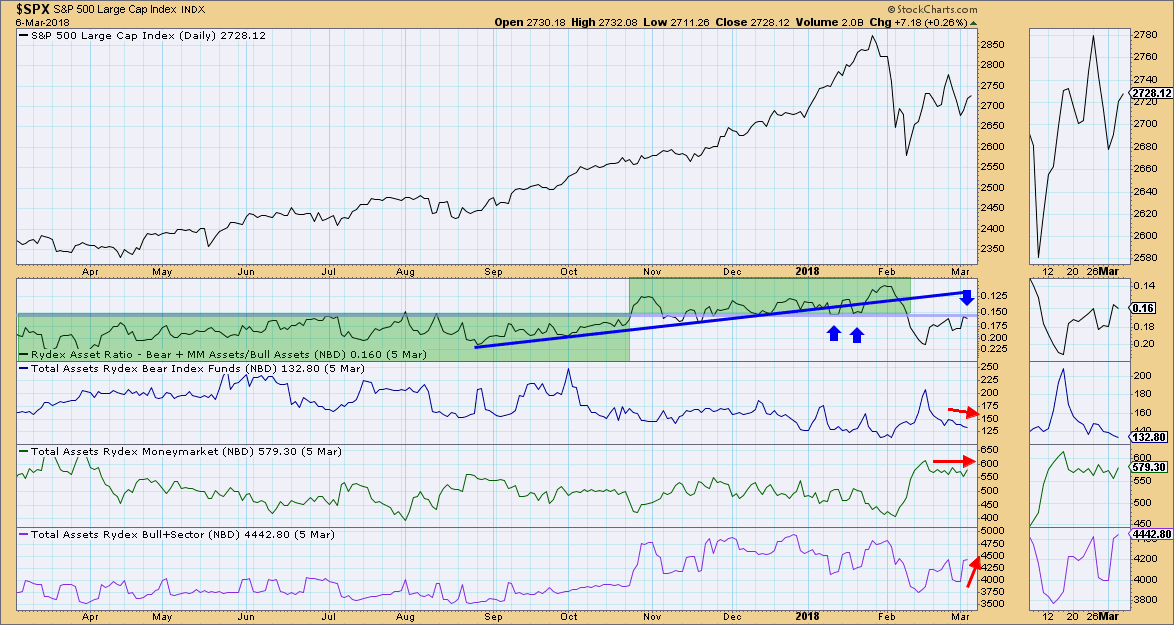
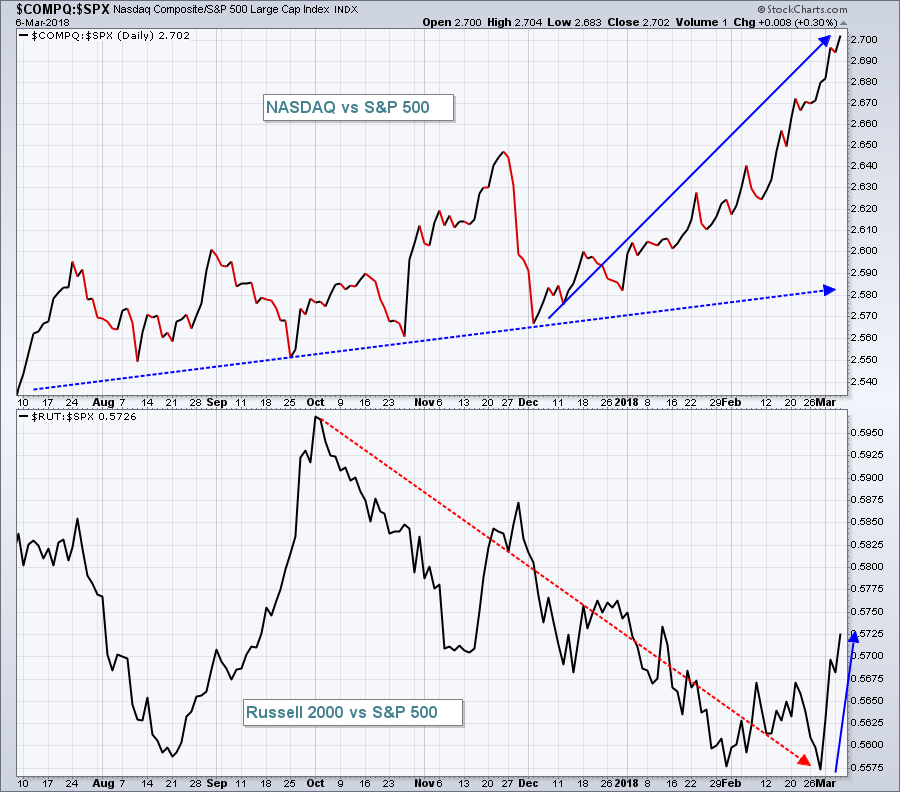
Rydex Ratio Turns Down - Bullish Sentiment = Bearish Implications
by Erin Swenlin,
Vice President, DecisionPoint.com
I decided to take a look at the Rydex Ratio today to see what the daily assets might be telling us as far as "actual money" sentiment. Here's a refresher for those new to the Rydex Ratio and sentiment readings in general. First, sentiment tells us...
READ MORE
MEMBERS ONLY

Execution!
by Greg Morris,
Veteran Technical Analyst, Investor, and Author
I am on record stating that most technical analysts do not trade with real money. I have no hard data to support that brash statement, rather it is my observation after speaking at hundreds of seminars and conferences and knowing hundreds of technical analysts. Many are famous. Many call themselves...
READ MORE
MEMBERS ONLY

GRAIN PRICES ARE FINALLY MOVING HIGHER -- A WEAKER DOLLAR IS INCREASING DEMAND FOR AGRICULTURAL EXPORTS -- COTTON ALSO APPEARS TO BE BOTTOMING -- RISING PRICES COULD BOOST FOOD AND CLOTHING COSTS -- TODAY'S DOLLAR DROP IS BOOSTING GOLD
by John Murphy,
Chief Technical Analyst, StockCharts.com
GRAIN PRICES ARE LEADING COMMODITY RALLY THIS YEAR ... My market message from January 6 expressed the view that commodity prices appeared to be bottoming, which could increase inflation pressures later this year. It also suggested that the chart of the CRB Index might actually be understating the inflation threat. That...
READ MORE
MEMBERS ONLY

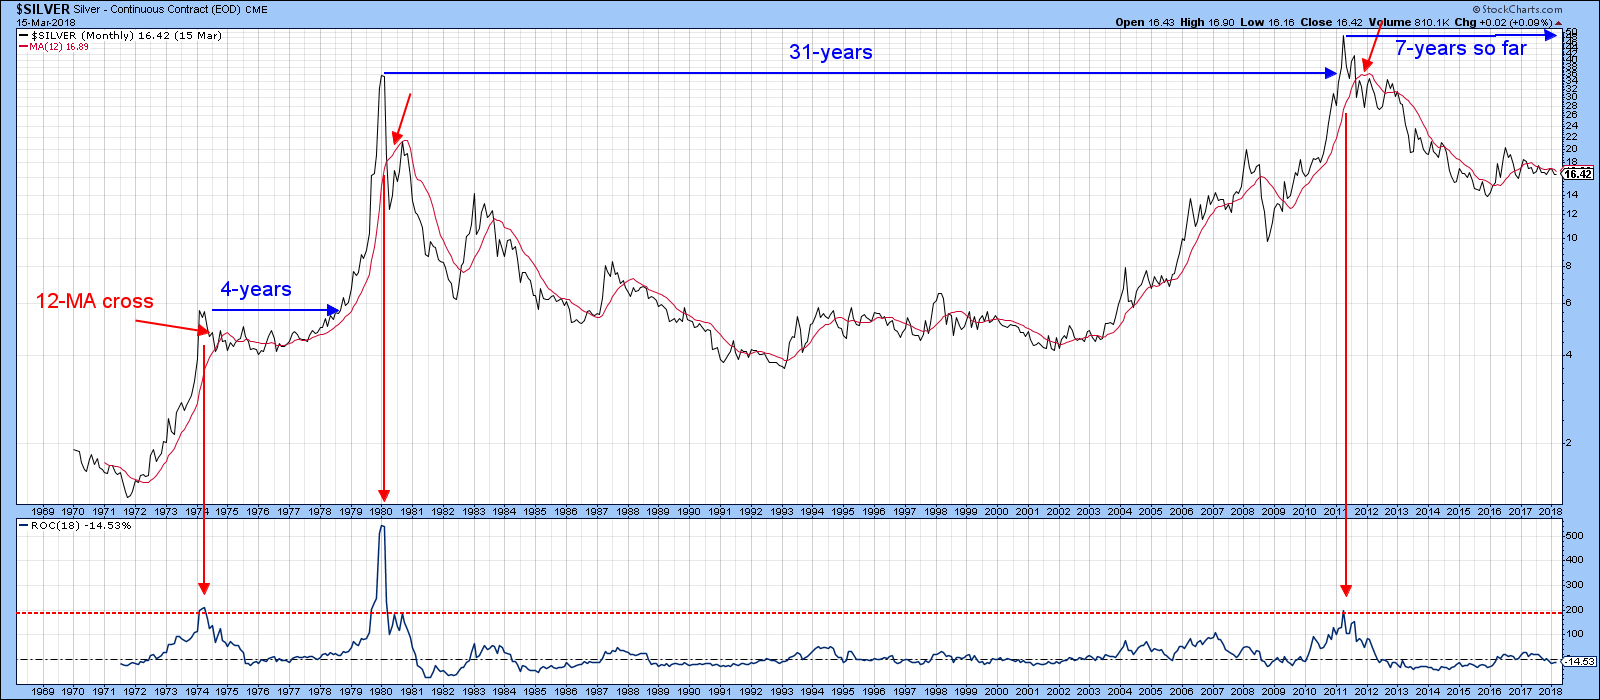
The Strange Correlation between Gold and Silver - Plus Copper the Chopper
by Arthur Hill,
Chief Technical Strategist, TrendInvestorPro.com
* The Strange Correlation between Gold and Silver.
* Gold Looks Poised to Continue Trend.
* Silver ETF Breaks Wedge Line.
* Copper the Chopper Bounces.
Correlation between Gold and Silver...
Gold and silver have not been on the same page lately, but there is still a strong positive correlation between the two. The...
READ MORE