MEMBERS ONLY
Leading Industry Prints Reversing Candle; Dow Jumps Over 300 Points

by Tom Bowley,
Chief Market Strategist, EarningsBeats.com
Market Recap for Monday, March 5, 2018
The Dow Jones surged on Monday, gaining 337 points (+1.37%) to lead all of our major indices higher. Two stalwarts - Caterpillar (CAT, +3.24%) and Boeing (BA, +2.34%) - were the leaders, but we saw 29 of the 30 Dow...
READ MORE
MEMBERS ONLY

SPY Meanders, but Two Sectors Stand Out - 7 Bullish Stock Charts

by Arthur Hill,
Chief Technical Strategist, TrendInvestorPro.com
* SPY Continues to Meander.
* Sector Performance Remains Mixed.
* Seven Industry Group ETFs Stand Out.
* Regional Bank SPDR Forms Continuation Pattern.
* QQQ, Top Stocks and the 50-day SMAs.
* Leading Stocks with Bullish Charts.
SPY Continues to Meander
The S&P 500 SPDR (SPY) got a nice oversold bounce the last...
READ MORE
MEMBERS ONLY
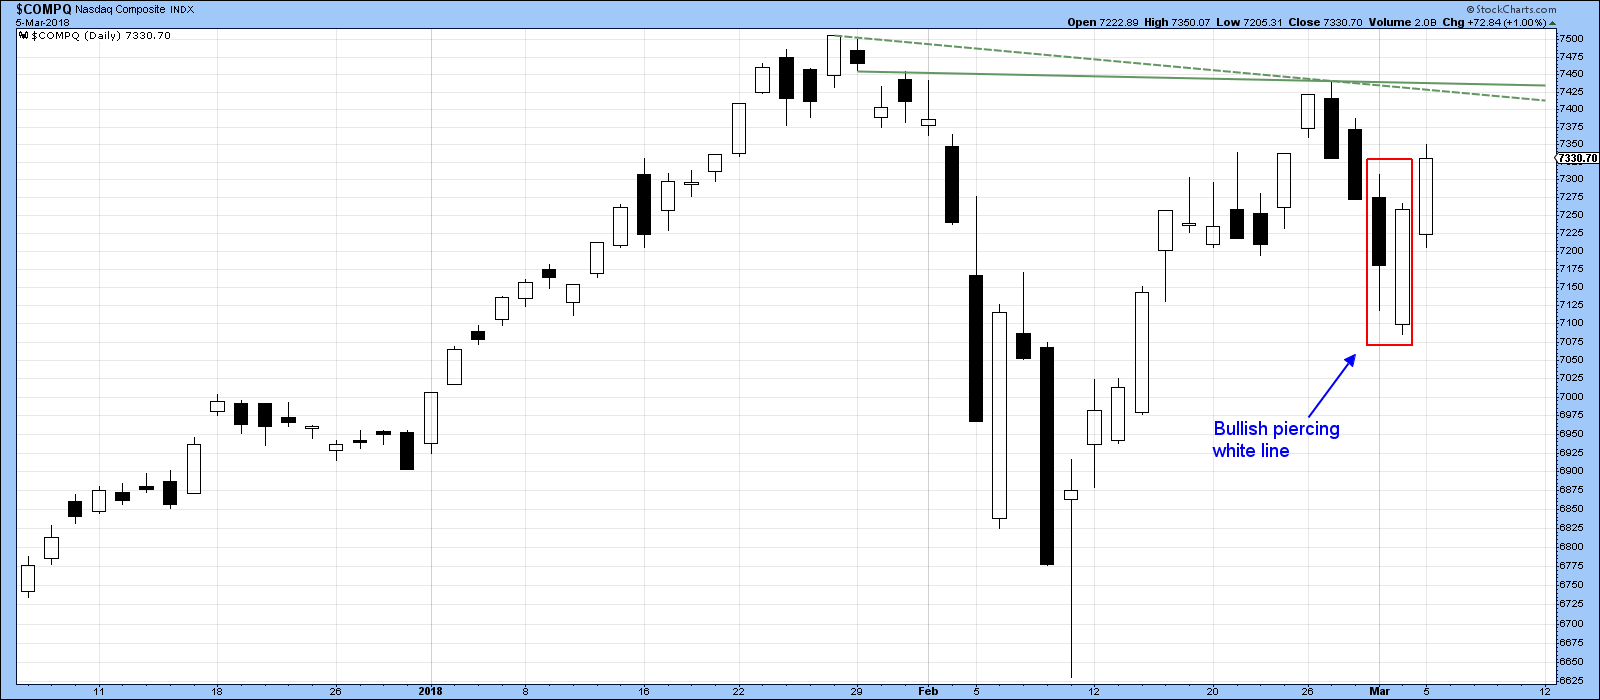
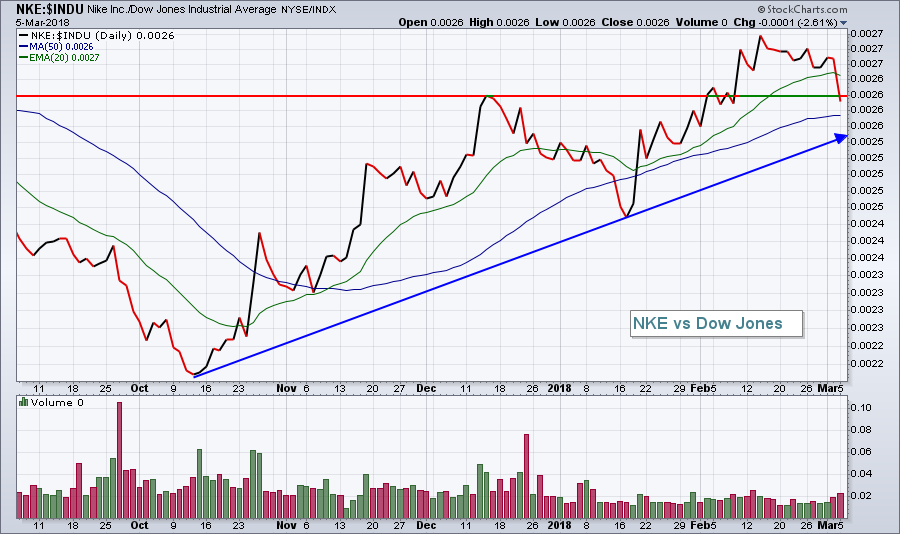
They Just Built A New Wall Of Worry For The US Stock Market

by Martin Pring,
President, Pring Research
* Two bullish piercing white lines
* A sector spread that predicts new stock market highs
* Two sectors affected by the proposed tariffs
Last week I wrote that the indicators seemed to be calling for a test of the early February low. My expectation was for a sharper and more prolonged decline...
READ MORE
MEMBERS ONLY

DOW AND S&P 500 BOUNCE IMPRESSIVELY OFF 100-DAY MOVING AVERAGES -- NASDAQ RISES FURTHER ABOVE 50-DAY LINE -- ALL SECTORS ARE IN THE GREEN -- WHILE THE VIX INDEX FALLS BACK BELOW 20 -- BLOOMBERG COMMODITY INDEX REGAINS ITS 50-DAY AVERAGE

by John Murphy,
Chief Technical Analyst, StockCharts.com
S&P 500 BOUNCES OFF 100-DAY AVERAGE... Last Friday's midday message showed the S&P 500 testing chart support near 2640 and in a short-term oversold condition (black line). After rallying off that support level on Friday afternoon, stocks built on those gains today. The daily...
READ MORE
MEMBERS ONLY

Electronic Arts Leads and Stalls at the Same Time
by Arthur Hill,
Chief Technical Strategist, TrendInvestorPro.com
Electronic Arts (EA) is one of the leading stocks in a strong video game industry group. Note that Activision (ATVI), one of its main competitors, hit a 52-week high in late January and is challenging this high here in early March. Take-Two (TTWO) is the weakest of the big three,...
READ MORE
MEMBERS ONLY
Medical Supplies Print Reversing Candle, Small Caps Surge And Monday Setups
by Tom Bowley,
Chief Market Strategist, EarningsBeats.com
Market Recap for Friday, March 2, 2018
The Dow Jones finished with a 71 point loss on Friday, thanks in part to another very weak performance by McDonalds (MCD). Apparently, their $1, $2, $3 menu is falling short of expectations and it's clearly reflected in recent price action....
READ MORE
MEMBERS ONLY

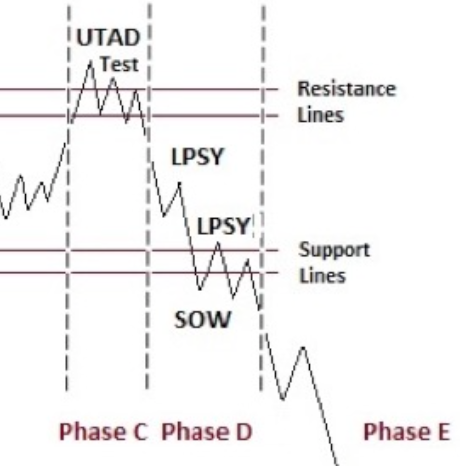
Divining Distribution

by Bruce Fraser,
Industry-leading "Wyckoffian"
In last Thursday’s MarketWatchers LIVE (recording available here) we discussed the Wyckoff Distribution concept of the Upthrust After Distribution (UTAD). Distribution and Accumulation adhere to a logical path or sequence of price and volume. During Distribution the Composite Operator (C.O.) has determined the area of price where they...
READ MORE
MEMBERS ONLY
Stocks Remain On The Defensive
by John Murphy,
Chief Technical Analyst, StockCharts.com
Editor's Note: This article was originally published in John Murphy's Market Message on Friday, March 2nd at 12:26pm ET
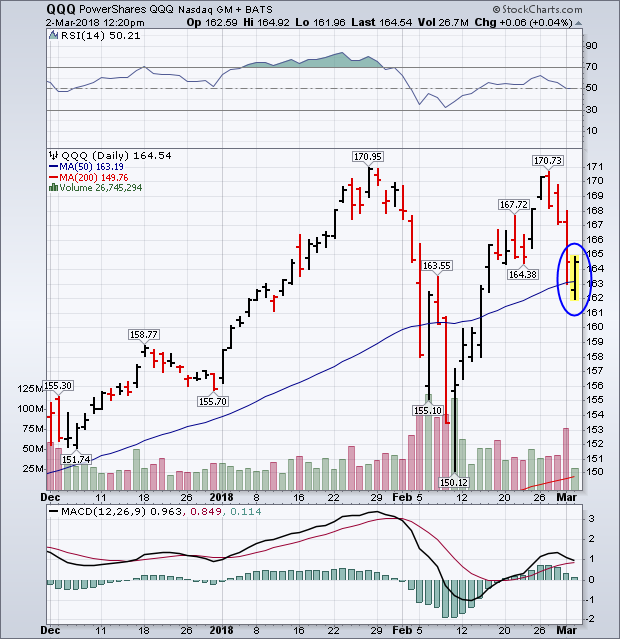
Wednesday's message showed the PowerShares QQQ (representing the Nasdaq 100 Index) pulling back from overhead resistance at its late January peak. That suggested profit-taking...
READ MORE
MEMBERS ONLY
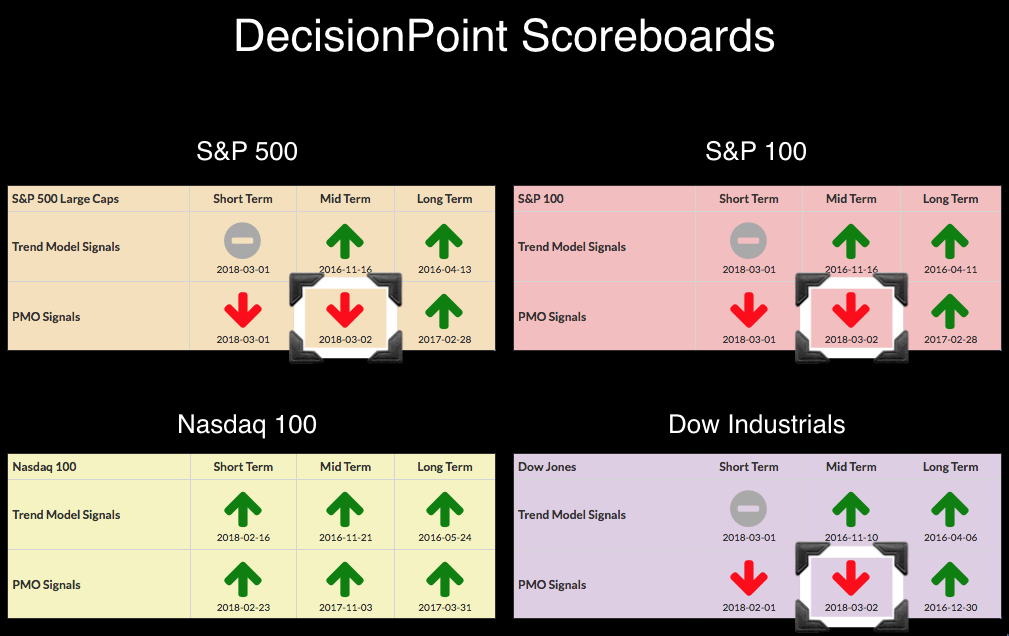
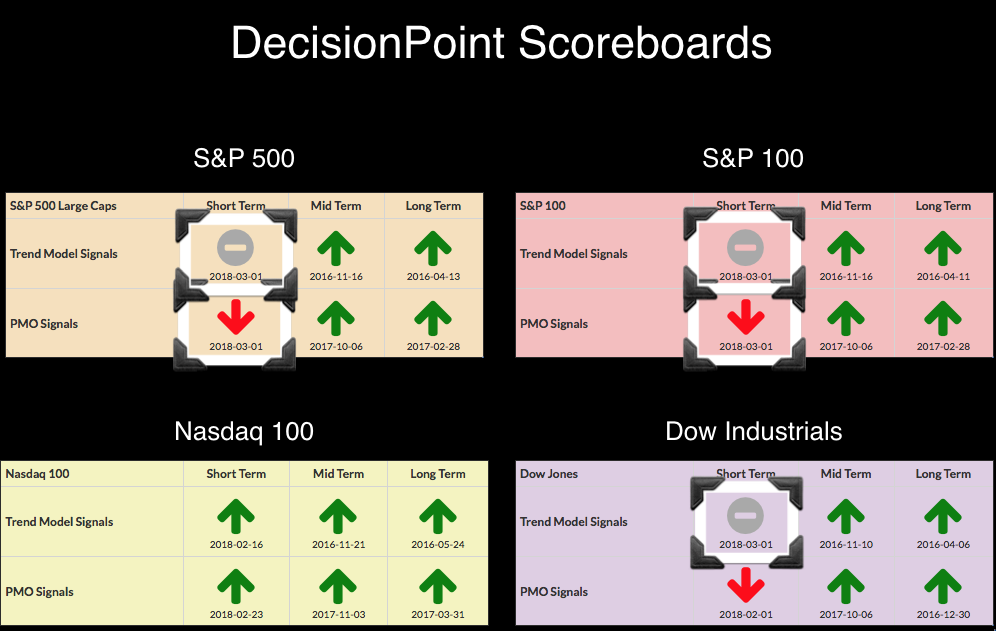
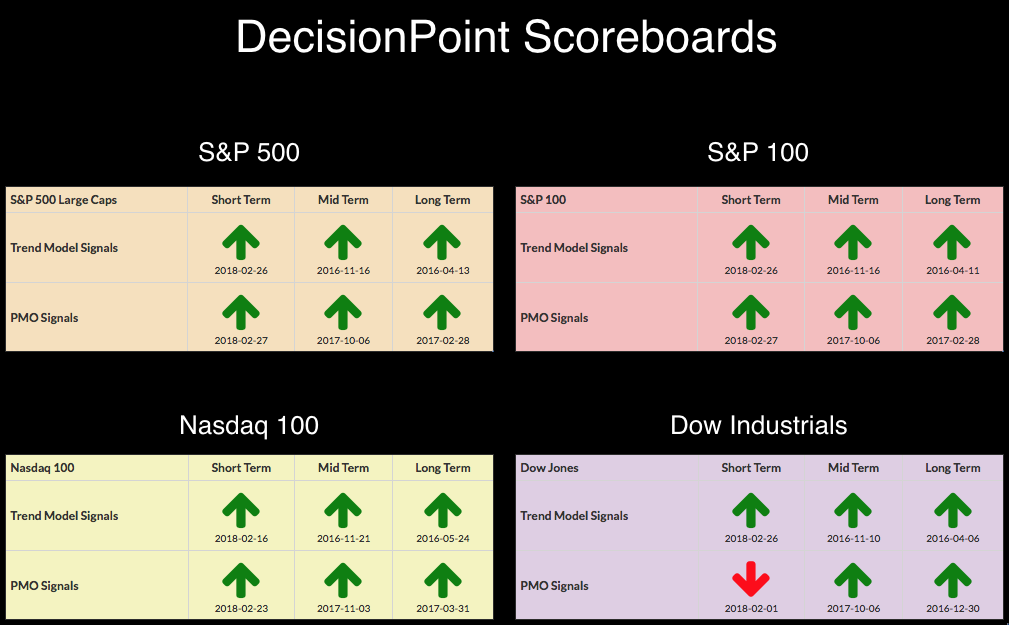
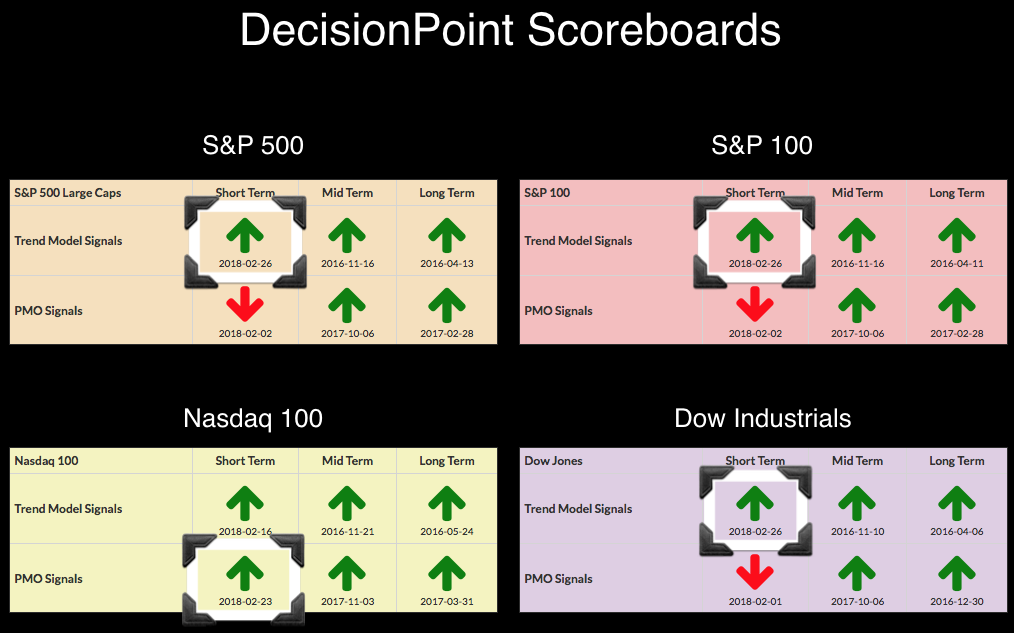
Bearish Bias - Weekly PMOs Log New SELL Signals on DP Scoreboards

by Erin Swenlin,
Vice President, DecisionPoint.com
I did a review of the monthly charts Wednesday and noticed a bearish bias. Today three new Intermediate-Term Price Momentum Oscillator (PMO) SELL signals arrived. The weekly PMOs crossed below their signal lines which triggered these signals. Weekly charts are presenting bearish characteristics.
After looking at all three of these...
READ MORE
MEMBERS ONLY
Is A Bear Market Underway? No And Here's My Argument
by Tom Bowley,
Chief Market Strategist, EarningsBeats.com
THE Question
Is this a correction within a bull market or is it the beginning of a bear market? That is THE question that everyone is debating and hoping to answer correctly. There's no crystal ball to know for sure the correct answer. However, the market does provide...
READ MORE
MEMBERS ONLY
Applying Dow Theory to the Top Sectors for Broad Market Analysis
by Arthur Hill,
Chief Technical Strategist, TrendInvestorPro.com
The principle of confirmation is important to the application of Dow Theory. This principle asserts that the Averages, Dow Industrials and Dow Transports, should confirm each other when making new highs. In other words, both should make new highs to affirm the broad market trend. Failure by one results in...
READ MORE
MEMBERS ONLY
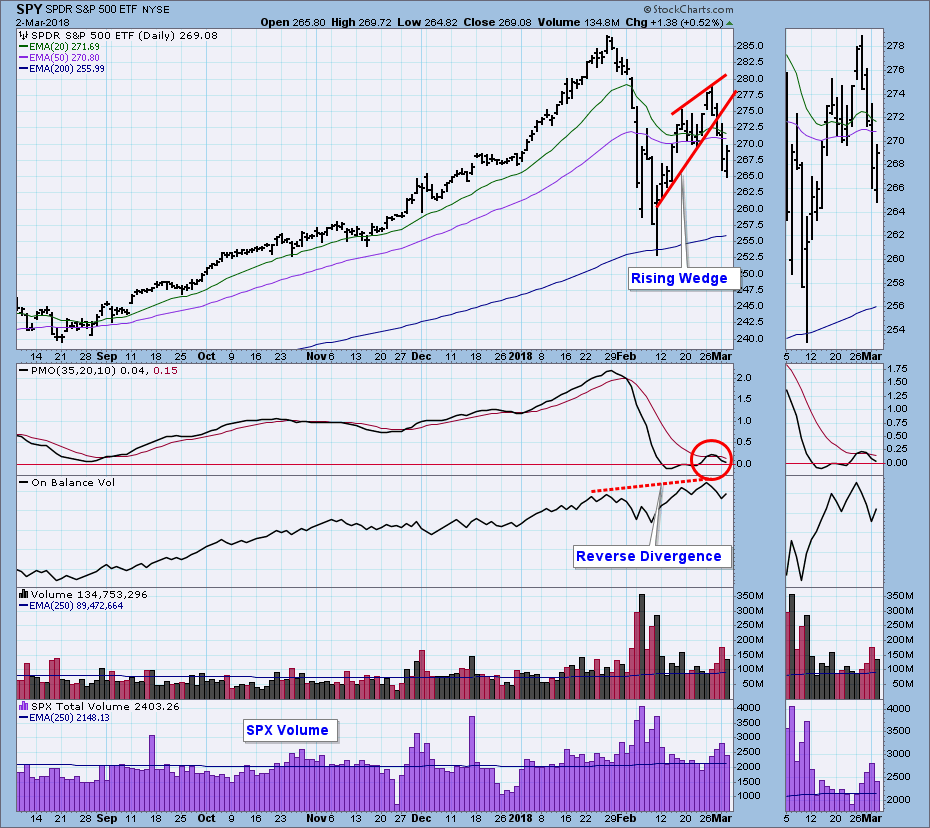
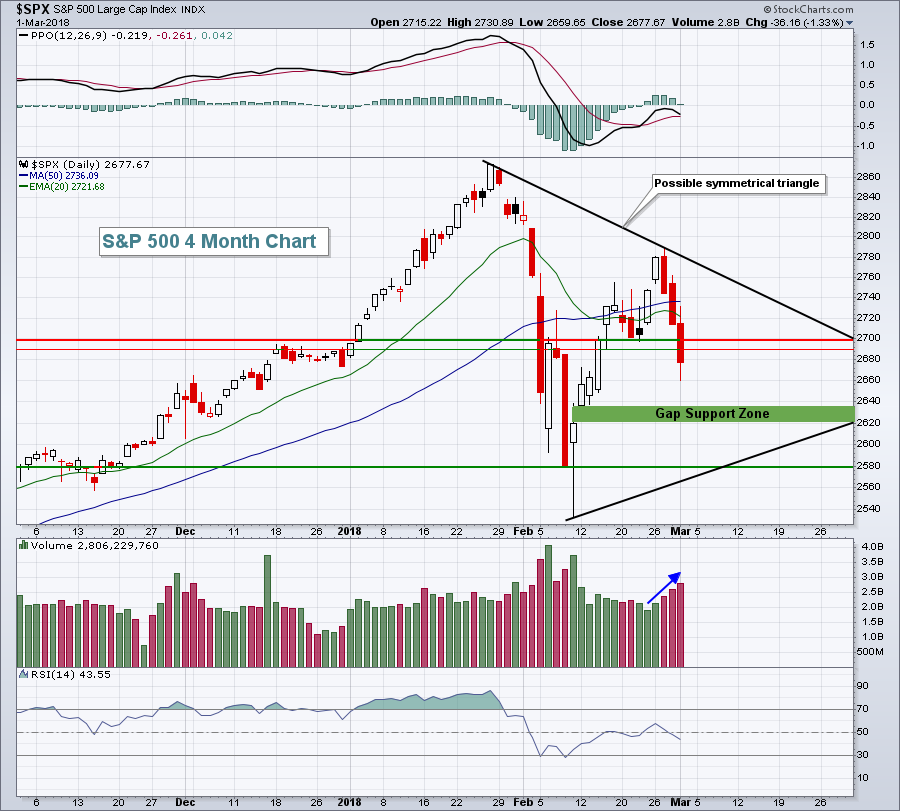
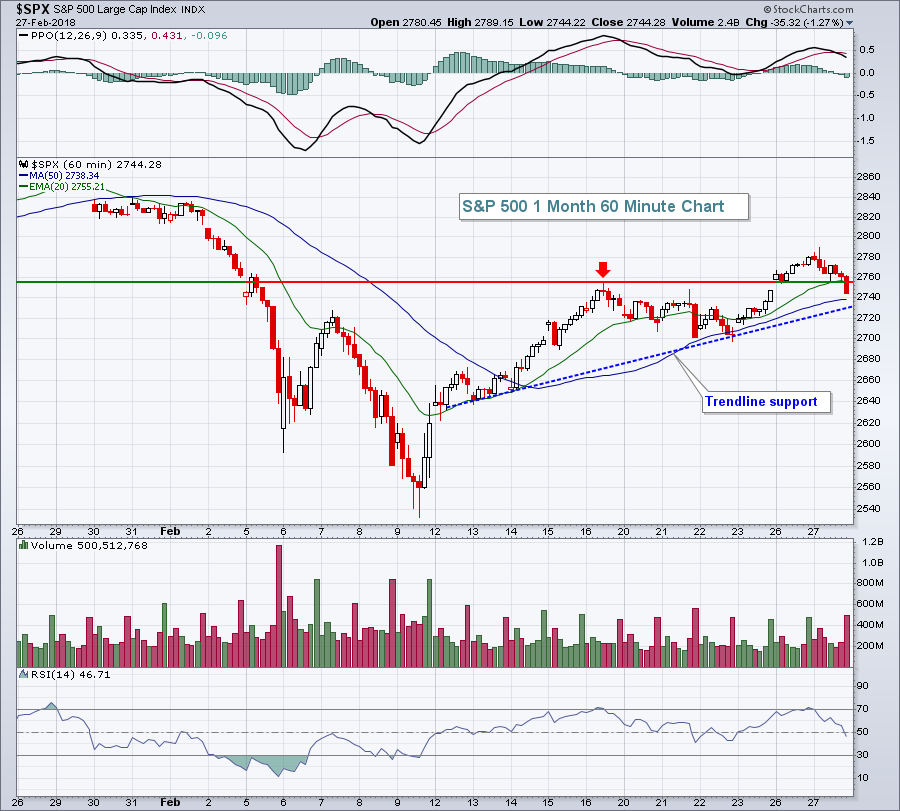
DP Weekly Wrap: Breakout Fakeout and Broken Wedge

by Carl Swenlin,
President and Founder, DecisionPoint.com
At last Friday's close we were faced with SPY pushing at the top of a bullish flag formation (not annotated). On Monday there was a strong breakout that proved to be a fakeout. On Tuesday price topped and fell back to the top of the flag, and at...
READ MORE
MEMBERS ONLY
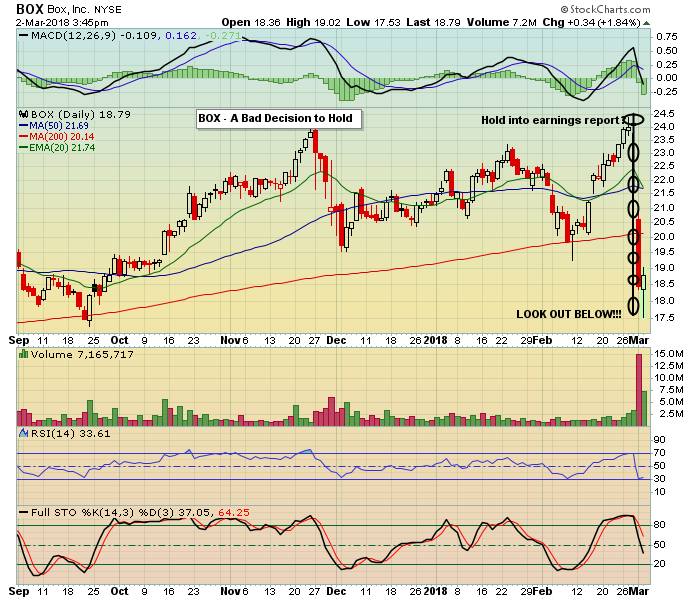
The Dark Side of Earnings

by John Hopkins,
President and Co-founder, EarningsBeats.com
Most analysts would agree that overall, 2017 Q4 earnings were superb. For quite a while we saw one company after another beat earnings expectations and they were rewarded for those results as well. But recently, as the market has come under fire, responses to many earnings reports have been brutal....
READ MORE
MEMBERS ONLY

Charts I'm Stalking: Action Practice #25

by Gatis Roze,
Author, "Tensile Trading"
p.p1 {margin: 0.0px 0.0px 0.0px 0.0px; font: 14.0px Helvetica; color: #000000; -webkit-text-stroke: #000000} span.s1 {font-kerning: none} span.s2 {text-decoration: underline ; font-kerning: none; color: #0000ff; -webkit-text-stroke: 0px #0000ff}
I confess!I’m messing with you a bit with respect to Action Practice #24. On...
READ MORE
MEMBERS ONLY

STOCKS REMAIN ON THE DEFENSIVE -- QQQ IS TESTING 50-DAY AVERAGE -- WHILE S&P 500 TESTS SHORT-TERM SUPPORT NEAR 2640 -- FALLING DOLLAR BOOSTS GOLD -- JAPANESE YEN SURGES TO 15-MONTH HIGH
by John Murphy,
Chief Technical Analyst, StockCharts.com
POWERSHARES QQQ IS TESTING 50-DAY AVERAGE ... Wednesday's message showed the PowerShares QQQ (representing the Nasdaq 100 Index) pulling back from overhead resistance at its late January peak. That suggested profit-taking in the technology-dominated QQQ and the rest of the market. It also suggested a retest of its 50-day...
READ MORE
MEMBERS ONLY
S&P 500 Loses Key Support, Odds Of A Bottom Retest Grow
by Tom Bowley,
Chief Market Strategist, EarningsBeats.com
Market Recap for Thursday, March 1, 2018
Any time the Volatility Index ($VIX) rises 13%, it's not going to be a great day on Wall Street. Fear equals selling and selling is exactly what we saw on Thursday. There was a bit of a late day rally, but...
READ MORE
MEMBERS ONLY

Weekly Market Review & Outlook (with Video) - Bull Markets, Corrections and Pullbacks
by Arthur Hill,
Chief Technical Strategist, TrendInvestorPro.com
* Pullbacks versus Corrections versus Bull Markets.
* Objective Uptrend and Subjective Correction.
* VIX Moves Back above 20.
* Gold Firms at Support Zone.
* Legendary Trader Sounds the Alarm.
* Trend Followers Know What they Don't Know.
* CNBC Interview with Tobias Levkovich.
* Notes from the Art's Charts ChartList.
Pullbacks, Corrections...
READ MORE
MEMBERS ONLY

Market Round Up Monthly Video 2018-03-01 With Martin Pring
by Martin Pring,
President, Pring Research
Here is the market analysis reviewing the current market outlook. There is a host of information on commodities, bonds and US equities.
Market Roundup With Martin Pring 2018-03-01 from StockCharts.com on Vimeo.
Chartcon 2018 registration is now open! Registration kicked off today, February 1st!
Chartcon 2018! Follow the link...
READ MORE
MEMBERS ONLY
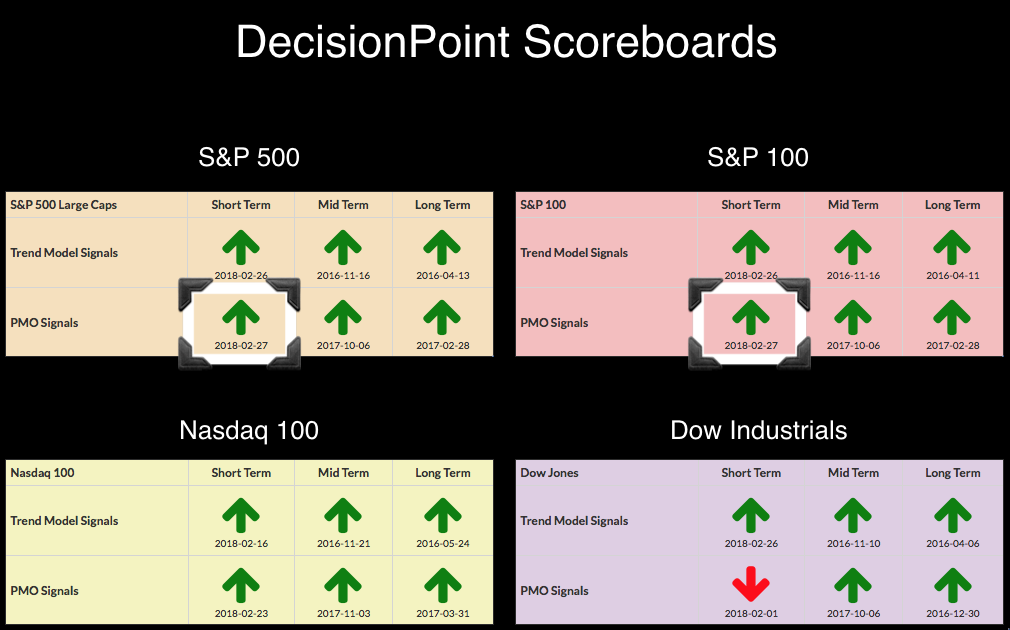
DP Bulletin: Scoreboards Lose BUY Signals
by Erin Swenlin,
Vice President, DecisionPoint.com
After deep declines today, the DP Scoreboards lost most of their short-term BUY signals. Rising wedges had appeared on the daily charts and today's decline confirmed it. The expectation is a breakdown from the wedge. The NDX is showing the most relative strength as it continues to cling...
READ MORE
MEMBERS ONLY
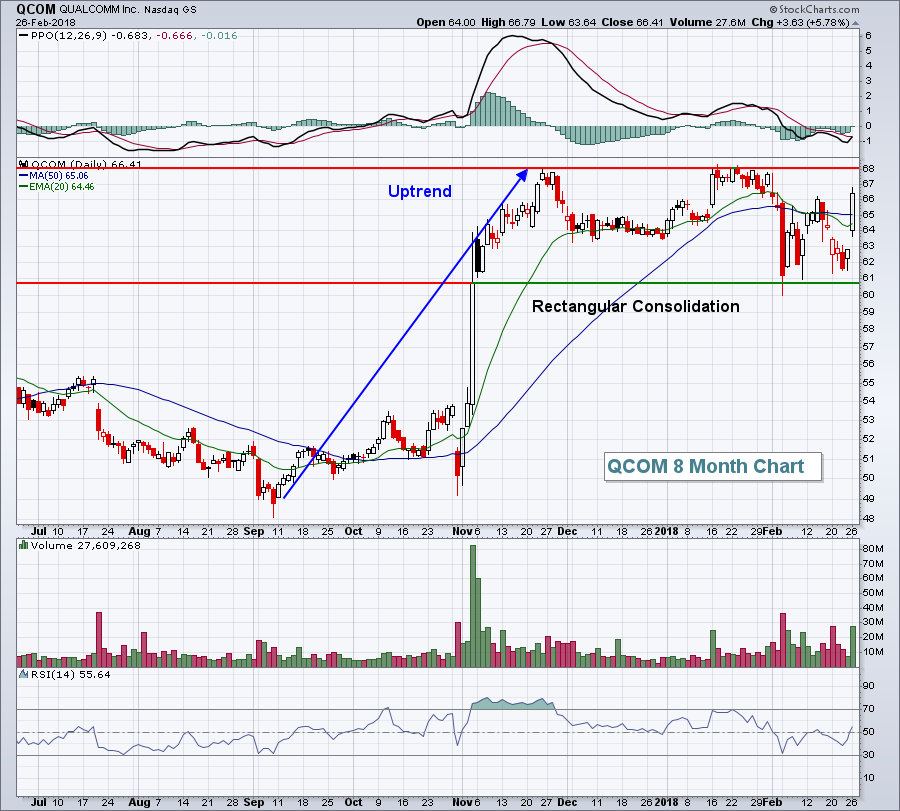
Looking For Seasonal Strength? Check Out This Leading Stock From A Leading Industry
by Tom Bowley,
Chief Market Strategist, EarningsBeats.com
Market Recap for Wednesday, February 28, 2018
Outside of the final two hours on Wednesday, it was a fairly boring day. We gapped higher at the open, sold off to fill the gap, and then moved back into positive territory.....until the final two hours. Selling returned in a big...
READ MORE
MEMBERS ONLY

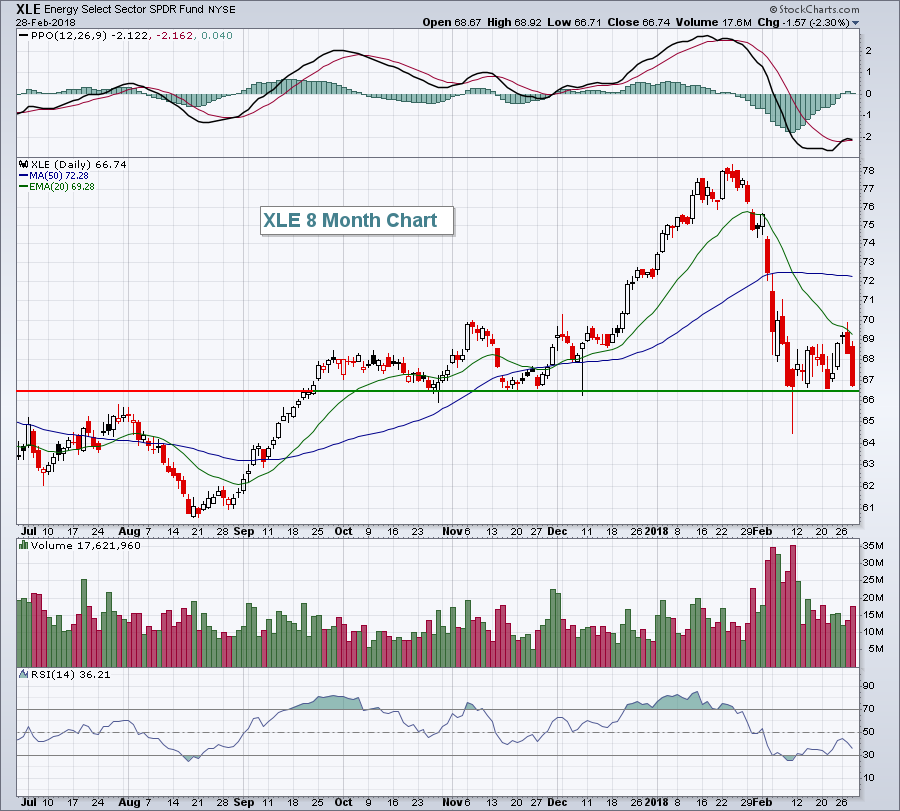
And Then There was One - Applying a Dow Theory Principle to the Top Sectors
by Arthur Hill,
Chief Technical Strategist, TrendInvestorPro.com
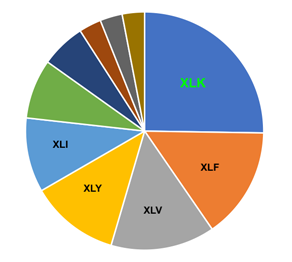
* XLK is Near Top of 2018 Range.
* XLE is Near Bottom of 2018 Range.
* Year-to-date Ranks for Equal-Weight Sectors.
* And Then There was One.
* EW Consumer Discretionary ETF Underperforms.
* Scanning the Major Indexes.
* Majority of Stocks are Struggling.
* Non-Confirmation Among the Offensive Sectors.
XLK is Near Top of 2018 Range....
READ MORE
MEMBERS ONLY
Monthly Chart Review of Major Indexes, Dollar, Gold, Oil and Bonds - Good, Bad & Ugly
by Erin Swenlin,
Vice President, DecisionPoint.com
The market has closed on the final day of February. This means that DecisionPoint monthly indicators have "gone final" which is the perfect time to review those signals and take a long-term view of the markets and the DecisionPoint "Big Four"- $USD, $GOLD, $WTIC &...
READ MORE
MEMBERS ONLY

SMALL AND MIDCAP STOCKS LEAD LARGE CAPS LOWER -- THE S&P 500 IS IN DANGER OF CLOSING BELOW ITS 50-DAY AVERAGE -- RISING DOLLAR PUSHES ENERGY SECTOR INTO ANOTHER TEST OF 200-DAY AVERAGE
by John Murphy,
Chief Technical Analyst, StockCharts.com
S&P SMALL AND MIDCAP INDEXES FAIL TEST OF 50-DAY AVERAGE... The pullback in stocks that started yesterday is continuing today. And it's being led down by smaller stocks. Chart 1 shows the S&P 600 Small Cap Index ($SML) falling decisively back its blue 50-day...
READ MORE
MEMBERS ONLY
Nine tech stocks to watch from an RRG perspective

by Julius de Kempenaer,
Senior Technical Analyst, StockCharts.com
An inspection of the weekly Relative Rotation Graph for US sectors at the beginning of this week (ending 2 March) reveals that we have:
* 3 sectors in leading
* 2 sectors in weakening
* 4 sectors in lagging
* 1 sector in improving
Out of these 10 sectors, we have only 2 at...
READ MORE
MEMBERS ONLY

P&G Weighs on Consumer Staples Sector
by Arthur Hill,
Chief Technical Strategist, TrendInvestorPro.com
The Consumer Staples SPDR (XLP) is one of the worst performing sectors year-to-date with a loss greater than 8 percent. The sector is also the second weakest in February because it failed to hold its bounce over the last two weeks.
The chart shows XLP with its biggest component (P&...
READ MORE
MEMBERS ONLY
3 Takeaways From Tuesday's Renewed Selling...And Why I'd Avoid Gold
by Tom Bowley,
Chief Market Strategist, EarningsBeats.com
Market Recap for Tuesday, February 27, 2018
During a day filled with renewed selling, especially in the final 10 minutes, there were 3 key takeways as far as I'm concerned. First, the short-term uptrend appeared to have been broken at the end of the day as gap, price...
READ MORE
MEMBERS ONLY

US Equities Emerging from The February Shakeout As A Global Leader Again
by Martin Pring,
President, Pring Research
* US is breaking out relative to the world
* Growth breaks decisively against value
* Blue Tuesday
US is breaking out relative to the world
Chart 1 shows that the ratio between the US stock market, in the form of the S&P Composite ($SPX), and the World Index (ACWI) often...
READ MORE
MEMBERS ONLY
DP Bulletin: SPX and OEX New BUY Signals - Beware Outside Reversal Days
by Erin Swenlin,
Vice President, DecisionPoint.com
Two items I need to call your attention to. First, the PMOs crossed their signal lines on the SPX and OEX to trigger ST PMO (Price Momentum Oscillator) BUY signals. The Dow's PMO is stubbornly staying below its signal line, but that should disappear tomorrow given it'...
READ MORE
MEMBERS ONLY

JUMP IN BOND YIELDS PUTS STOCK REBOUND IN JEOPARDY -- QQQ IS PULLING BACK FROM TEST OF OLD HIGH -- S&P 500 LOOKS OVEREXTENDED -- BOUNCING DOLLAR WEAKENS GOLD -- EMERGING MARKETS ARE ALSO EXPERIENCING PROFIT-TAKING
by John Murphy,
Chief Technical Analyst, StockCharts.com
TEN-YEAR BOND YIELD IS BACK OVER 2.90% ... After a modest pullback that started last Thursday, bond yields are climbing again today. The daily bars in Chart 1 show the 10-Year Treasury Yield ($TNX) jumping 6 basis points to 2.92% and within striking distance of its four-year high reached...
READ MORE
MEMBERS ONLY
Software Breaks Out; Semis, Computer Hardware Next In Line
by Tom Bowley,
Chief Market Strategist, EarningsBeats.com
Market Recap for Monday, March 26, 2018
Monday was a very solid day for U.S. equities. All of our major indices roared to higher levels, led by the 400 point gain on the Dow Jones Industrial Average ($INDU). Eight of nine sectors advanced, with only the defensive utilities group...
READ MORE
MEMBERS ONLY

The 800-Pound Gorilla in the Market - Charting the Fab Five
by Arthur Hill,
Chief Technical Strategist, TrendInvestorPro.com
* SPY Leads with First Breakout.
* Small Caps and Mid Caps Still Lagging.
* Six Sectors and Six Upswings.
* Techs and Materials Lead New High List.
* The 800-pound Sector in the Market.
* Charting the Fab Five (AAPL, GOOGL, FB, AMZN, MSFT).
* Retail and Housing Lag.
SPY Leads with First Breakout...
For the...
READ MORE
MEMBERS ONLY
Flags Execute on Major Indexes - New BUY Signals on DP Scoreboards
by Erin Swenlin,
Vice President, DecisionPoint.com
The DP Scoreboard transformation actually began on Friday when the NDX grabbed a new PMO BUY signal after already logging a ST Trend Model BUY signal. It appears the other indexes are falling in line as their 5-EMAs crossed above 20-EMAs to generate ST Trend Model BUY signals too. When...
READ MORE
MEMBERS ONLY

STOCKS REGAIN THREE-QUARTERS OF FEBRUARY SELLOFF -- QQQ NEARS TEST OF OLD HIGH -- AMERICAN AIRLINES AND UNION PACIFIC LEAD TRANSPORTS HIGHER -- COMMODITIES ARE ALSO RECOVERING
by John Murphy,
Chief Technical Analyst, StockCharts.com
STOCK INDEXES GAIN MORE GROUND -- QQQ NEARS TEST OF OLD HIGH... U.S. stock indexes continue to gain more ground today and have now regained about three-quarters of their recent correction. Charts 1 and 2 show the Dow Industrials and S&P 500 trading at three-week highs after...
READ MORE
MEMBERS ONLY

Humana Tests Breakout Zone as PPO Turns
by Arthur Hill,
Chief Technical Strategist, TrendInvestorPro.com
Humana (HUM) is part of the HealthCare Providers ETF (IHF) and this group led the market from mid-October to late January with a 20+ percent surge to new highs. The group pulled back in February, but the long-term trend is up and this bodes well for stocks in the group....
READ MORE
MEMBERS ONLY
Looking For March Seasonal Strength? Check These Two Out
by Tom Bowley,
Chief Market Strategist, EarningsBeats.com
Market Recap for Friday, February 23, 2018
After a steady diet of afternoon flops recently, our major indices soared into Friday's close, clearing important overhead resistance in the process. All major indices finished with 1% gains or more, setting the stage for what could be a very solid...
READ MORE
MEMBERS ONLY

Whipsaws!

by Greg Morris,
Veteran Technical Analyst, Investor, and Author
I had another article planned but think writing about something that just occurred in the market is a much better learning/teaching experience. Trend following has one issue that will constantly plague the investor and usually at the least expected time, and that is whipsaws. I must admit, I think...
READ MORE
MEMBERS ONLY
Distribution Review
by Bruce Fraser,
Industry-leading "Wyckoffian"
It has been a long time since we have explored the intricacies of the Wyckoff Distribution structure. But since 2018 has opened with a Bang, by going straight up in January and then early February’s retracement of the prior month’s advance, it is time to review. The year...
READ MORE
MEMBERS ONLY
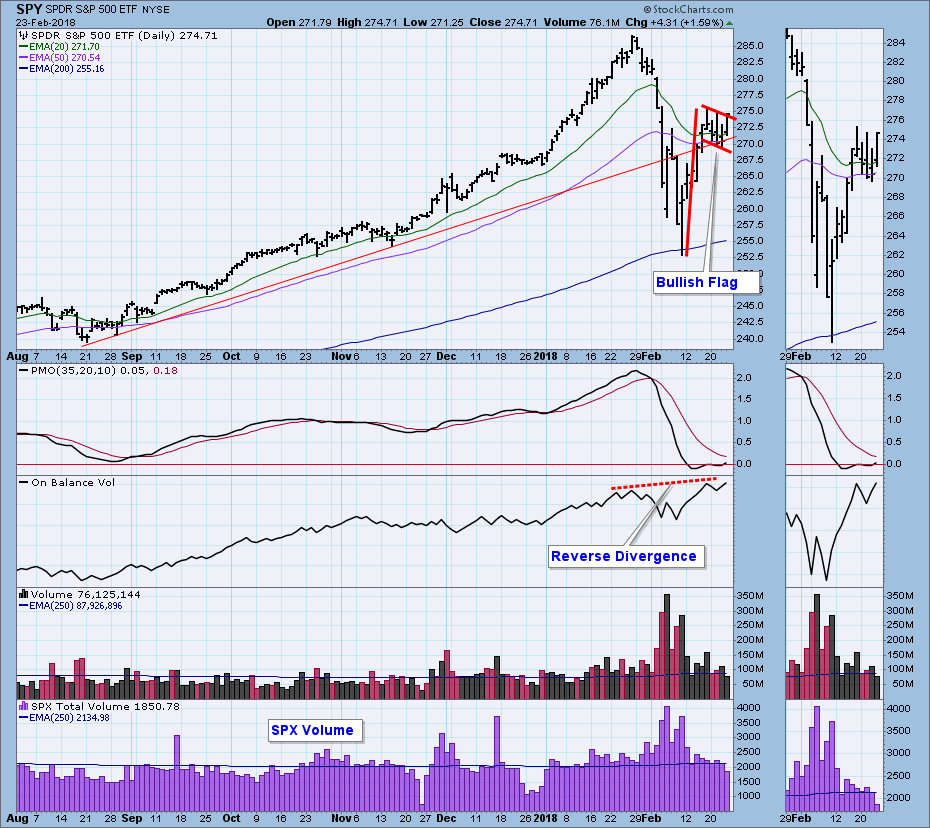
DP Weekly Wrap: Promising Flag Formation
by Carl Swenlin,
President and Founder, DecisionPoint.com
Nothing has happened this week to support my belief that we are in a bear market. If the market were in that much trouble, it seems to me that this week it should have headed lower. Instead, it has consolidated and formed a bullish flag formation. If the flag fulfills...
READ MORE
MEMBERS ONLY

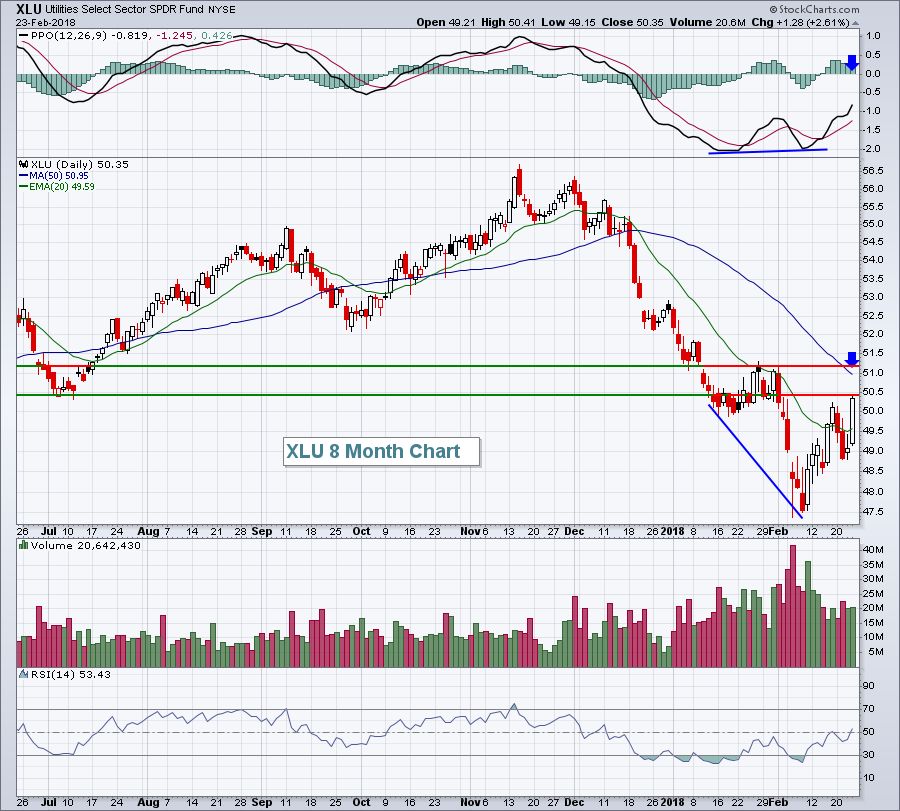
BOND YIELDS ARE STARTING TO WEAKEN FROM OVERBOUGHT CONDITION -- THAT'S GIVING A BOOST TO BOND PROXIES LIKE UTILITIES, REITS, AND TELECOM -- HIGH YIELD BONDS ARE BOUNCING BACK WHICH IS GOOD FOR STOCKS
by John Murphy,
Chief Technical Analyst, StockCharts.com
TEN-YEAR BOND YIELD IS WEAKENING ... The uptrend in bond yields is starting to weaken. The daily bar in Chart 1 show the 10-Year Treasury yield falling 5 basis points to 2.87%. More importantly, its 14-day RSI line overlaid over the price bars is falling to the lowest level since...
READ MORE
MEMBERS ONLY

Free Style Tips: How I Organize My Custom ChartStyles!

by Grayson Roze,
Chief Strategist, StockCharts.com
Well, I did it again. Yesterday morning, I joined Tom Bowley and Erin Swenlin on MarketWatchers LIVE as part of the weekly "Everything StockCharts" segment, which covers important tips, tricks and other information that all StockCharts users can benefit from.
My appearance was a demonstration in style...ChartStyle!...
READ MORE