MEMBERS ONLY
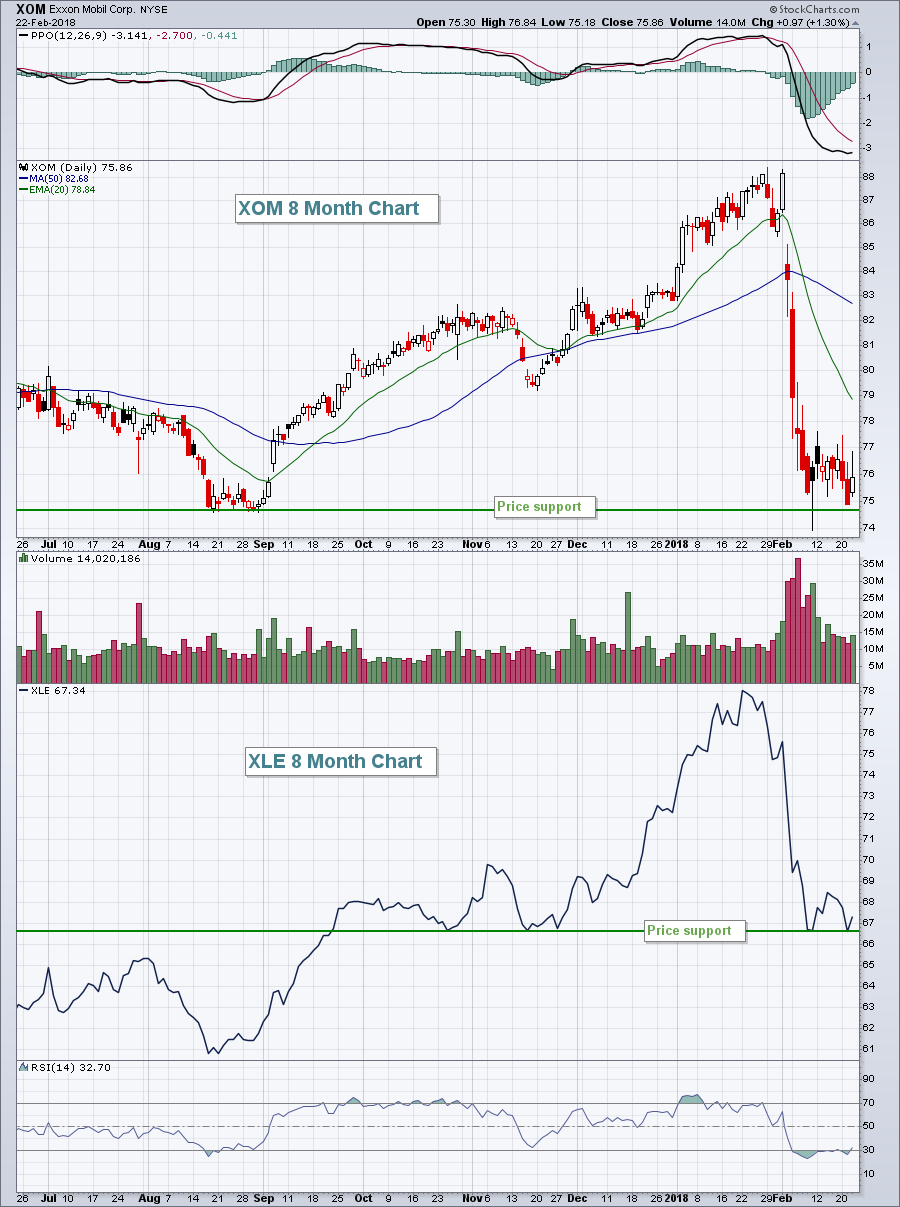
Higher Treasury Yields Crushing Last Year's Darling - Home Construction

by Tom Bowley,
Chief Market Strategist, EarningsBeats.com
Market Recap for Thursday, February 22, 2018
U.S. indices continued to tread water on Thursday, with mixed action among our major indices and sectors. The Dow Jones posted a triple digit gain (165 points), but the more aggressive NASDAQ and Russell 2000 indices both fell fractionally. Volatility ($VIX) subsided...
READ MORE
MEMBERS ONLY

Weekly Market Review & Outlook (with Video) - Something for Everyone

by Arthur Hill,
Chief Technical Strategist, TrendInvestorPro.com
* Bulls, Bears and Fishermen.
* Long-term Picture Still Bullish.
* Rising SMAs for the S&P 500.
* A Short-term Bullish Pattern for SPY.
* Small-caps Show some Short-term RS.
* Lots of Little Consolidations.
* Oil Extends Bounce off Support.
* Energy Stocks are Not Impressed.
* Gold Miners Not Impressed Either.
* Notes from the Art&...
READ MORE
MEMBERS ONLY
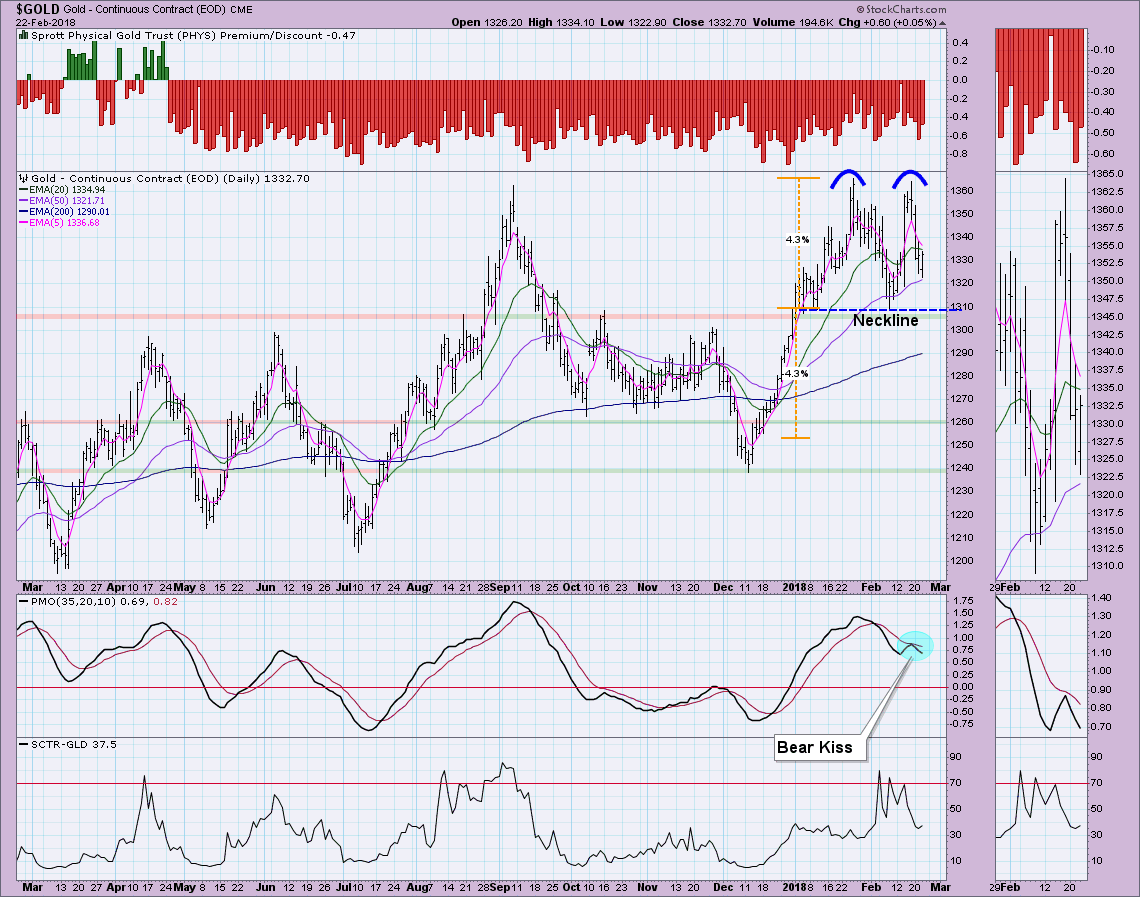
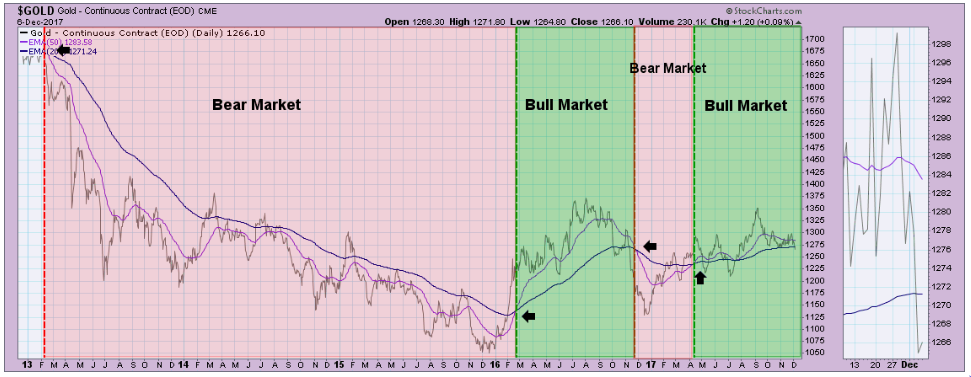
Why So Down on Gold?

by Erin Swenlin,
Vice President, DecisionPoint.com
I was asked during the MarketWatchers LIVE program today about my thoughts regarding Gold v. Dollar and particularly, why I'm bearish on Gold right now. I'll explain.
The chart for Gold is bearish on many counts. First there is the PMO with its "bear kiss&...
READ MORE
MEMBERS ONLY

SystemTrader - In-Sample and Out-of-Sample Results for Two Momentum Systems - Measuring Performance and Drawdowns
by Arthur Hill,
Chief Technical Strategist, TrendInvestorPro.com
* Revisiting Two Momentum Systems from 2017.
* A Simple Momentum Rotation System.
* Live by the Sword, Die by the Sword.
* A Trend-Momentum System with a Profit Target.
* Successful and Unsuccessful Trades.
* In-Sample and Out-of-Sample Performance.
* Drawdowns are Unavoidable.
* Conclusions and Takeaways.
* Consulting, Software and Data.
Revisiting Two Momentum Systems
I introduced...
READ MORE
MEMBERS ONLY
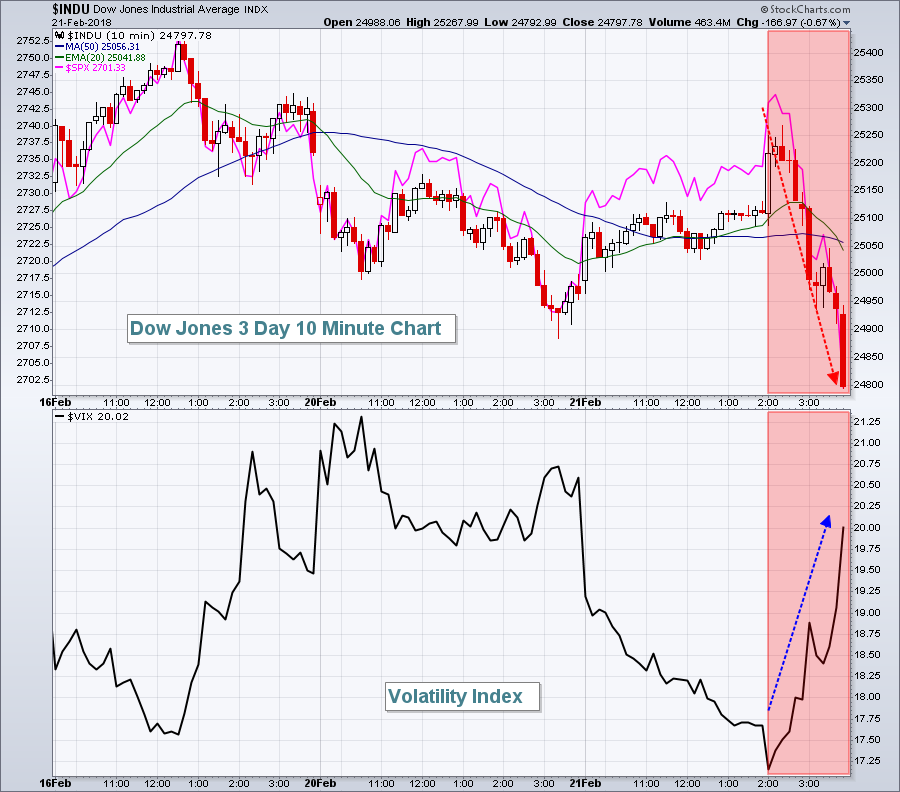
FOMC Minutes Spook Traders, Equities Tumble In Final Two Hours
by Tom Bowley,
Chief Market Strategist, EarningsBeats.com
Market Recap for Wednesday, February 21, 2018
Well, the U.S. stock market was humming right along.....until the FOMC minutes were released at 2pm EST. Take a look at this intraday chart on the Dow Jones and S&P 500 and I think you'll fairly quickly...
READ MORE
MEMBERS ONLY

DP Alert - ST Indicators Suggest Pullback
by Erin Swenlin,
Vice President, DecisionPoint.com
The NDX switched back to a Short-Term Trend Model BUY Signal on the DecisionPoint Scoreboards. The 5-EMA crossed above the 20-EMA which triggered the signal (the chart is below the scoreboards for your review).
The purpose of the DecisionPoint Alert Update is to quickly review the day's action,...
READ MORE
MEMBERS ONLY

Emerging From The Correction The Best And Worst Looking Sectors

by Martin Pring,
President, Pring Research
* General market thoughts
* Sectors under pressure
* Stronger looking sectors
General market thoughts
My thoughts on the recent correction is that we have likely seen the low, that more ranging action is likely, probably involving a test of that low, but that eventually US equities will see new bull market highs....
READ MORE
MEMBERS ONLY

STRONG TECH SECTOR CONTINUES TO SUPPORT MARKET -- FINANCIALS, CYCLICALS, AND INDUSTRIALS ARE ALSO LEADING -- SMALLS CAPS LOOK STRONGER -- AMERICAN AIRLINES AND KANSAS CITY SOUTHERN LEAD TRANPORTS HIGHER

by John Murphy,
Chief Technical Analyst, StockCharts.com
TECHNOLOGY SECTOR CONTINUES TO SUPPORT MARKET ... My last sentence from yesterday's message was that the stock market was unlikely to suffer any serious short-term damage as long as technology stocks kept rising. That's because technology is such a big part of the stock market. And they&...
READ MORE
MEMBERS ONLY

Regional Bank ETF Rises to the Top
by Arthur Hill,
Chief Technical Strategist, TrendInvestorPro.com
Even though I am currently in the "correction" camp for the broader market, there are clearly pockets of strength in some key groups. The Software iShares (IGV), Cyber Security ETF (HACK), Internet ETF (FDN) and Networking iShares (IGN) are leading the technology rebound and all are close to...
READ MORE
MEMBERS ONLY
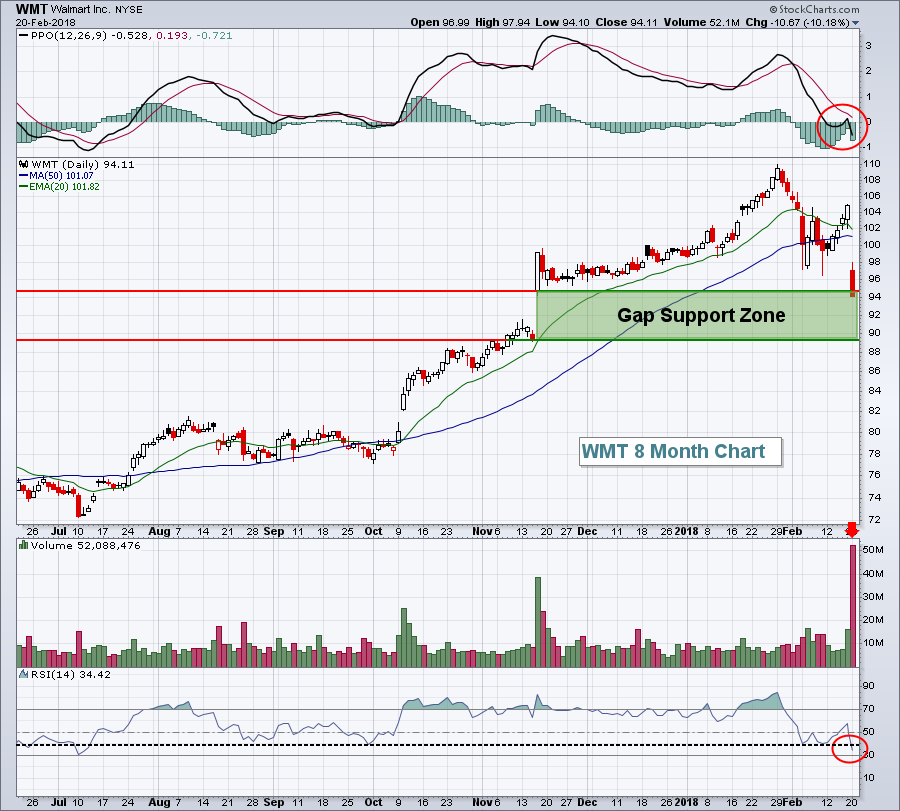
Walmart Results Take A Big Bite Out Of Dow Jones, Ends Winning Streak
by Tom Bowley,
Chief Market Strategist, EarningsBeats.com
Market Recap for Tuesday, February 20, 2018
Selling returned to Wall Street as its six day winning streak came to an end. The Dow Jones was easily the biggest loser as Walmart, Inc (WMT) disappointed traders with its latest quarterly earnings report and had its worst trading day in many...
READ MORE
MEMBERS ONLY

SEMICONDUCTORS LEAD THE NASDAQ AND TECHNOLOGY SECTOR HIGHER TODAY -- CHIP LEADERS INCLUDE APPLIED MATERIALS, KLA-TENCOR, AND LAM RESEARCH -- MOST OTHER SECTORS ARE IN THE RED -- DOW AND S&P 500 ARE STRUGGLING AT MOVING AVERAGE LINES
by John Murphy,
Chief Technical Analyst, StockCharts.com
SEMICONDUCTOR ISHARES HAVE A STRONG DAY... Semiconductor stocks are the strongest part of the market today. Chart 1 shows the PHLX Semiconductor iShares (SOXX) trading more than 2% higher today and moving further above its 50-day moving average. The SOXX has also risen above its 20-day moving average (green line)...
READ MORE
MEMBERS ONLY
Never Short a Dull Market or Go Long a Volatile One
by Arthur Hill,
Chief Technical Strategist, TrendInvestorPro.com
* Go Long a Volatile Market?
* Setting Correction Targets for S&P 500.
* Leaders and Laggards During the Rebound.
* Scanning for Percent from High.
* Semis, Housing and Transports Lag.
"Never short a dull market" is an old Wall Street saying. Even though we cannot build a strategy on...
READ MORE
MEMBERS ONLY
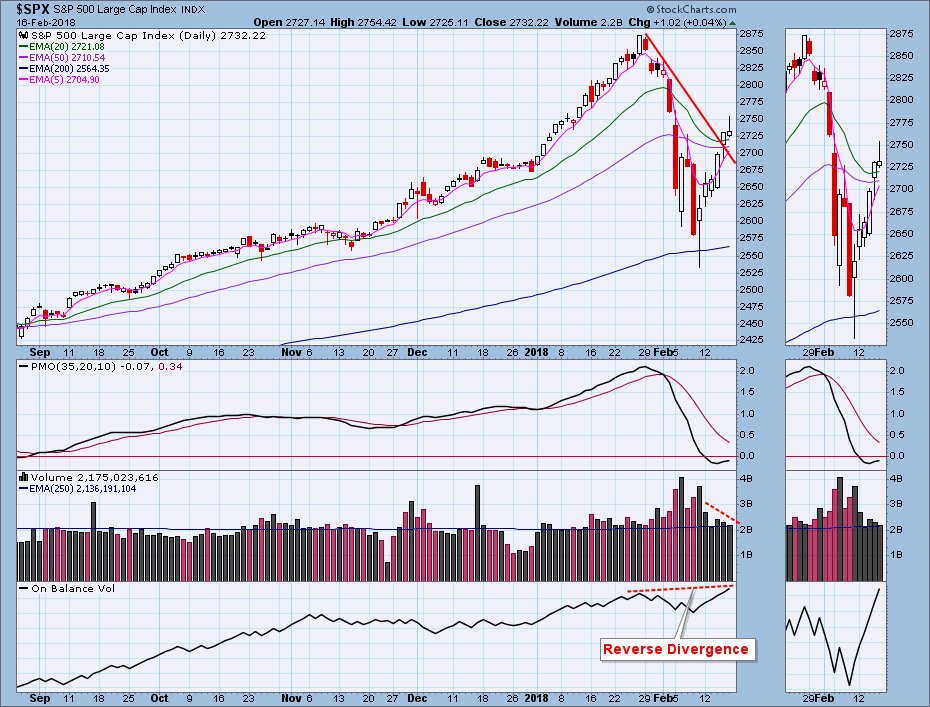
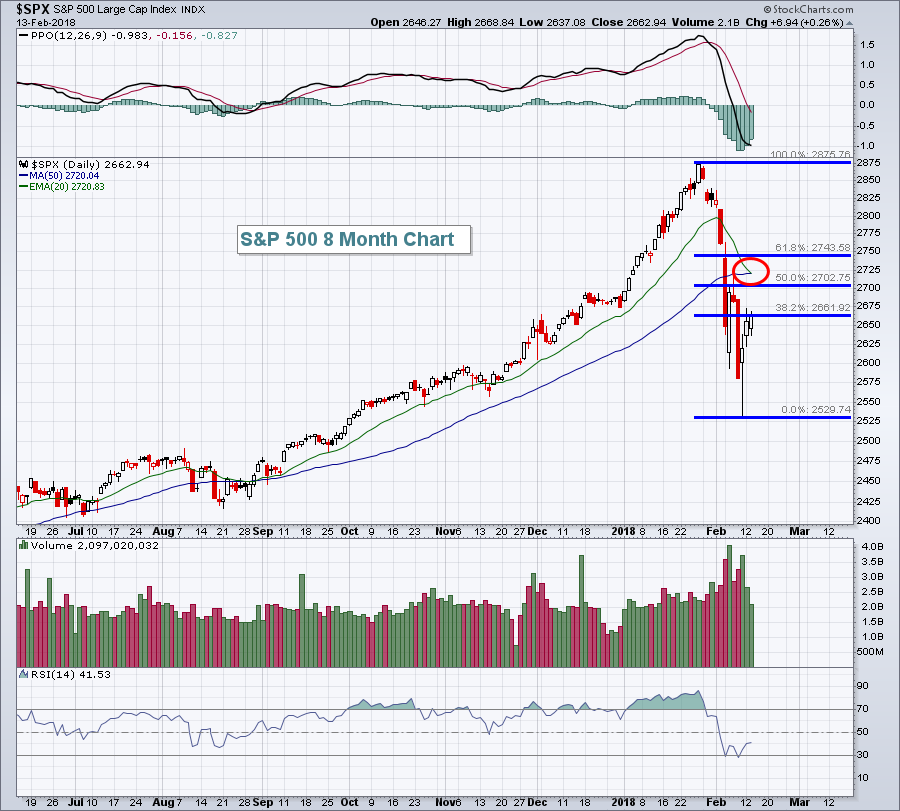
Traders Turn Defensive As Key Fibonacci Retracement Level Reached - Bearish
by Tom Bowley,
Chief Market Strategist, EarningsBeats.com
Market Recap for Friday, February 16, 2018
On the surface, Friday's action didn't seem all that bad. While there was bifurcated action, three of our four major indices did finish in positive territory. The aggressive small cap Russell 2000 ($RUT) led the advance. Only the NASDAQ...
READ MORE
MEMBERS ONLY

The Law of Cause and Effect in Action

by Bruce Fraser,
Industry-leading "Wyckoffian"
The Law of Cause and Effect is a cornerstone principle of the Wyckoff Method. Cause building on the chart precedes the Effect of a Markup or a Markdown. Wyckoffians meticulously study trading ranges on the charts for Accumulation or Distribution characteristics. Analysis of Phases (Phases A thru E) track the...
READ MORE
MEMBERS ONLY
Building a Rules-Based Trend Following Model - 5

by Greg Morris,
Veteran Technical Analyst, Investor, and Author
The significant components of my Weight of the Evidence are Price Measures and Breadth Measures. All of my Price Measures use the Nasdaq Composite Index which I have written about many times. If using the same price, then the difference between most price indicators is to offer varying time periods;...
READ MORE
MEMBERS ONLY
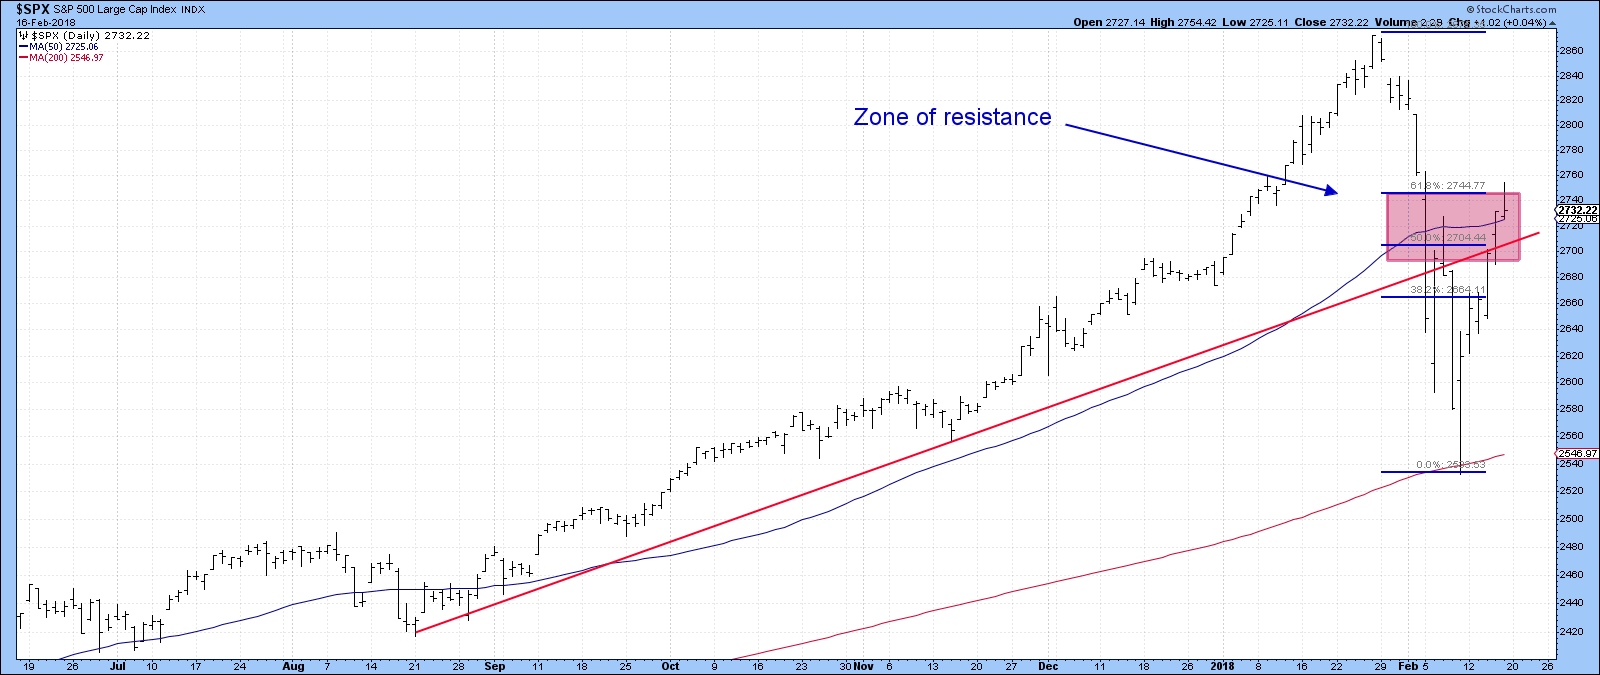
Some Equity Markets Showing Signs Of Long-term Vulnerability
by Martin Pring,
President, Pring Research
* Pinocchio argues for a test of the lows
* European equities are facing a big challenge
* Shanghai starting to look sick
Pinocchio argues for a test of the lows
Last week I suggested that the S&P had reached a resistance zone following its bounce from the early February panic...
READ MORE
MEMBERS ONLY
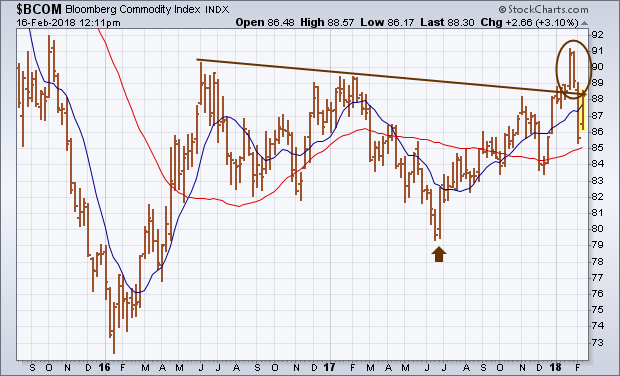
Recent Pullback in Commodities Is Likely Tied to Stock Correction
by John Murphy,
Chief Technical Analyst, StockCharts.com
My January 27 message wrote about a bullish breakout in commodity prices to the highest level in two years. I took that as another sign that inflation pressures were starting to build. The weekly bars in Chart 1 show that bullish breakout taking place in the Bloomberg Commodity Index (circled...
READ MORE
MEMBERS ONLY
Big Scores Made Possible through Extreme Patience

by John Hopkins,
President and Co-founder, EarningsBeats.com
I'm sure most traders get tired of being told to be patient when the market or a specific stock is climbing day after day. Missing out on nice rallies can be extremely frustrating. But if there ever was a time when patience paid off big time it was...
READ MORE
MEMBERS ONLY
History And Fibonacci Say We Topped On Friday
by Tom Bowley,
Chief Market Strategist, EarningsBeats.com
Fear ramped up with the early February selling and a capitulatory bottom (at least short-term) printed. The Volatility Index ($VIX) doesn't hit the 40-50 zone often and, when it does, it typically coincides with a panicked selloff and bottom. The last time we saw panicked selling (before the...
READ MORE
MEMBERS ONLY
Where Did All Those New Lows Come From?
by Arthur Hill,
Chief Technical Strategist, TrendInvestorPro.com
Stocks rebounded this week as the S&P 500 Equal-Weight Index ($SPXEW) recovered most of the losses from the previous week. On a closing basis, the index fell around 10% in nine days and then recovered around half of this loss with a 5.4% gain the last six...
READ MORE
MEMBERS ONLY
DP Weekly Wrap: Bear Market Rally Over?

by Carl Swenlin,
President and Founder, DecisionPoint.com
Last Friday the market executed a bullish intraday reversal, and this week it rallied five days straight; however, there were some problems. S&P 500 volume contracted into the rally, and Friday's candlestick was a bearish shooting star. I don't really use candlesticks much, but...
READ MORE
MEMBERS ONLY
Bull or Bear Market Rules?
by Erin Swenlin,
Vice President, DecisionPoint.com
Today on MarketWatchers LIVE, I did a workshop on bull and bear market rules. You'll hear many technicians discuss "bull market rules apply" or vice versa. The question is pertinent and timely right now. The jury is still out on whether we are about to enter...
READ MORE
MEMBERS ONLY

RECENT PULLBACK IN COMMODITIES IS LIKELY TIED TO STOCK CORRECTION -- COPPER AND OIL ARE STILL IN UPTRENDS -- AND GOLD MAY BE NEAR A BULLISH BREAKOUT -- GOLD MAY GET AN ADDITIONAL LIFT FROM THIS WEEK'S BULLISH BREAKOUT IN THE YEN TO A FIFTEEN MONTH HIGH
by John Murphy,
Chief Technical Analyst, StockCharts.com
COMMODITY PULLBACK IS TIED TO STOCKS... My January 27 message wrote about a bullish breakout in commodity prices to the highest level in two years. I took that as another sign that inflation pressures were starting to build. The weekly bars in Chart 1 show that bullish breakout taking place...
READ MORE
MEMBERS ONLY

Two Icons Reveal the Same Secret to Success

by Gatis Roze,
Author, "Tensile Trading"
Steve Jobs famously challenged everyone when he said, “We’re here to put a dent in the universe. Otherwise, why else be here?”
I was fortunate recently to spend a couple of days in Napa Valley at the DENT 2018 conference. There’s nothing like spending quality time with lots...
READ MORE
MEMBERS ONLY

Weekly Market Review & Outlook (with Video) - Rubber Band Rebound
by Arthur Hill,
Chief Technical Strategist, TrendInvestorPro.com
* Rubber Band Rebound.
* A Bearish Breadth Thrust.
* High-Low Percent Indicators Weaken.
* %Above Indicators Remain Bullish.
* Weight of the Evidence.
* SPX Clears 50-day as VIX Falls.
* Small-caps Take the Internal Lead.
* Scan Code for Top ROC.
* Tech-Related Industry Groups Lead.
* Notes from the Art's Charts ChartList.
Rubber Band Rebound...
READ MORE
MEMBERS ONLY
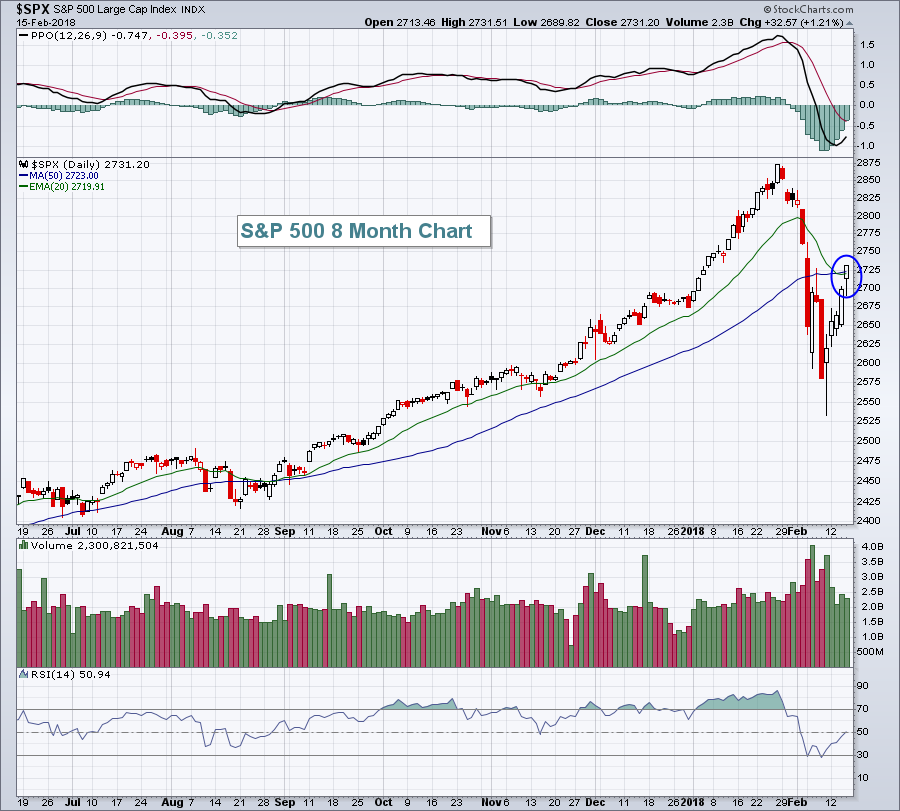
Grading The Current Rally - Is It Sustainable?
by Tom Bowley,
Chief Market Strategist, EarningsBeats.com
Market Recap for Thursday, February 15, 2018
Selling is inevitable during bull markets. After each leg higher, there's typically a period of selling/consolidation. The bulls were spoiled for several months, as the bull market advance continued nearly uninterrupted. There really hadn't been any notable selling...
READ MORE
MEMBERS ONLY

Painting the US equity landscape using Relative Rotation Graphs

by Julius de Kempenaer,
Senior Technical Analyst, StockCharts.com
Relative Rotation Graphs are a great tool to visualize sector rotation and that is probably where you will see them applied most. But they can be used for so many more (rotational) variations of different universes or similar universes in a different way.
In this post, I will show you...
READ MORE
MEMBERS ONLY

Time For Some Temporary Grief In The Equity Market?
by Martin Pring,
President, Pring Research
* Path of recoveries from recent declines have been mixed
* S&P is at short-term resistance
* Some reliable short-term indicators not quite there yet
* Yen breaks out from a large base
Path of recoveries from recent declines have been mixed
After five straight up days since the February 9 intraday...
READ MORE
MEMBERS ONLY

Oil Bounces off Breakout Zone - Plus XES, HAL and an S&P 500 Update
by Arthur Hill,
Chief Technical Strategist, TrendInvestorPro.com
* Indicators Improve as S&P 500 Follows Through.
* A Retest of the February Low?
* Monitoring the Pennant Breakout.
* Oil Bounces off Breakout Zone.
* Use Continuous Contract Long-Term.
* Oil & Gas Equip & Services SPDR Firms.
* Haliburton Returns to Breakout Zone.
Indicators Improve as S&P 500 Follows Through...
READ MORE
MEMBERS ONLY
Wall Street Shakes Off Inflation Worries, Retail Slump; Rallies For 4th Straight Session
by Tom Bowley,
Chief Market Strategist, EarningsBeats.com
Market Recap for Wednesday, February 14, 2018
Wall Street sure did look like it was heading for a very rough day at 8:30am EST on Wednesday. Very poor economic news hit traders with a 1-2 punch as the consumer price index jumped 0.5% instead of the 0.3%...
READ MORE
MEMBERS ONLY
DP Alert: Bullish Indicators - Gold Surges...For Now
by Erin Swenlin,
Vice President, DecisionPoint.com
The DecisionPoint Scoreboards didn't show any improvement from last week as the neutral and sell signals remained in the short term. PMO SELL signals are not yet on the weekly charts for these indexes, but they are lining up. If we see a pullback on the recent rally,...
READ MORE
MEMBERS ONLY

STOCKS RECOVER FROM HIGHER INFLATION REPORT -- NASDAQ 100 IS FIRST INDEX TO REACH 50-DAY LINE -- BANK ETF GAINS MORE GROUND ON RISING YIELDS -- WHILE UTILITIES FALL -- JUMP IN GOLD PUTS IT CLOSER TO MAJOR UPSIDE BREAKOUT -- VIX DROPS TO 20
by John Murphy,
Chief Technical Analyst, StockCharts.com
MAJOR STOCK INDEXES BOUNCE BACK FROM EARLY SELLING ... January's CPI report came in higher than expected and caused stocks to open lower. The headline reading of 2.1% and core reading (excluding food and energy) of 1.8% were higher than economists were expecting. After opening lower, stocks...
READ MORE
MEMBERS ONLY

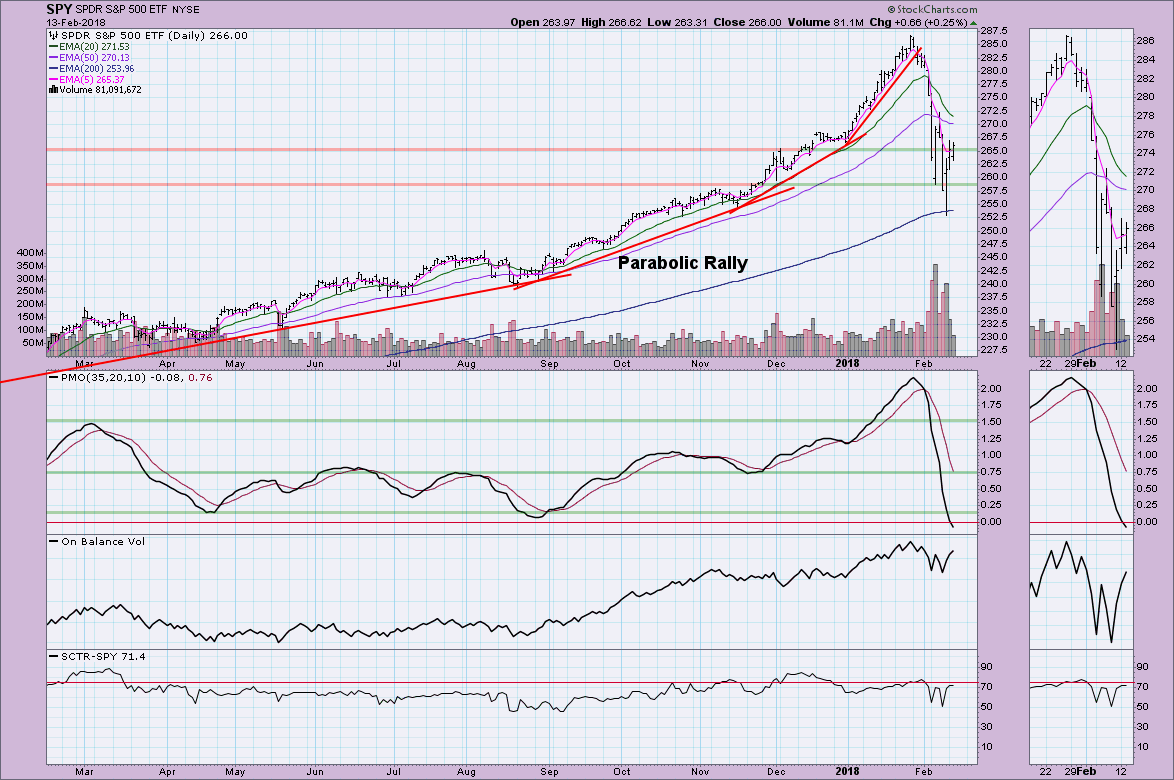
A Short-term Disconnect between VIX and SPY - Watch the Pennant
by Arthur Hill,
Chief Technical Strategist, TrendInvestorPro.com
There is another disconnect working between the VIX and SPY. The S&P 500 SPDR (SPY) opened weak with a dip below 265, but the S&P 500 Volatility Index ($VIX) also declined. This is an interesting dynamic because the VIX usually moves opposite of SPY. I am...
READ MORE
MEMBERS ONLY
This Might Very Well Be The Best Investment Over The Next 6-12 Months
by Tom Bowley,
Chief Market Strategist, EarningsBeats.com
Market Recap for Tuesday, February 13, 2018
The U.S. stock market settled down on Tuesday, trading in a much narrower range, and finished with gains across its major indices for the third consecutive day. While it was good to see the market stabilize after such panicked selling, there remains...
READ MORE
MEMBERS ONLY
Indicators Turning Up But is Correction Over?
by Erin Swenlin,
Vice President, DecisionPoint.com
The question that continues to arise this month is, "Is it over?". This correction was deeper than many expected or was about as deep as expected but it occurred so quickly. I'm finally getting some good news on my intermediate-term indicators, but not enough for me...
READ MORE
MEMBERS ONLY

REGIONAL BANK SPDR EXCEEDS 50-DAY AVERAGE -- LEADERS INCLUDE M&T BANK, BB&T CORP, AND REGIONS FINANCIAL -- JPM IS ANOTHER BANK LEADER -- TRANSPORTS BOUNCE OFF 200-DAY AVERAGE -- WEAK DOLLAR BOOSTS METALS -- STOCK REBOUND STILL HAS FURTHER TO GO
by John Murphy,
Chief Technical Analyst, StockCharts.com
REGIONAL BANK SPDR CLEARS 50-DAY AVERAGE... One of the simplest ways to determine which stock groups, or individual stocks, are leading the market higher is to look for the ones that are clearing their 50-day moving averages first (or stayed above them). Yesterday's message showed the Consumer Discretionary...
READ MORE
MEMBERS ONLY

Expansion in New Lows Points to Extended Correction
by Arthur Hill,
Chief Technical Strategist, TrendInvestorPro.com
As with Charles Dow, I work under the assumption that the trend is in force until proven otherwise. And, in accordance with Dow Theory, neither the length nor the duration can be forecast. We can, however, identify trend changes and act accordingly.
The stock market is in a delicate spot...
READ MORE
MEMBERS ONLY
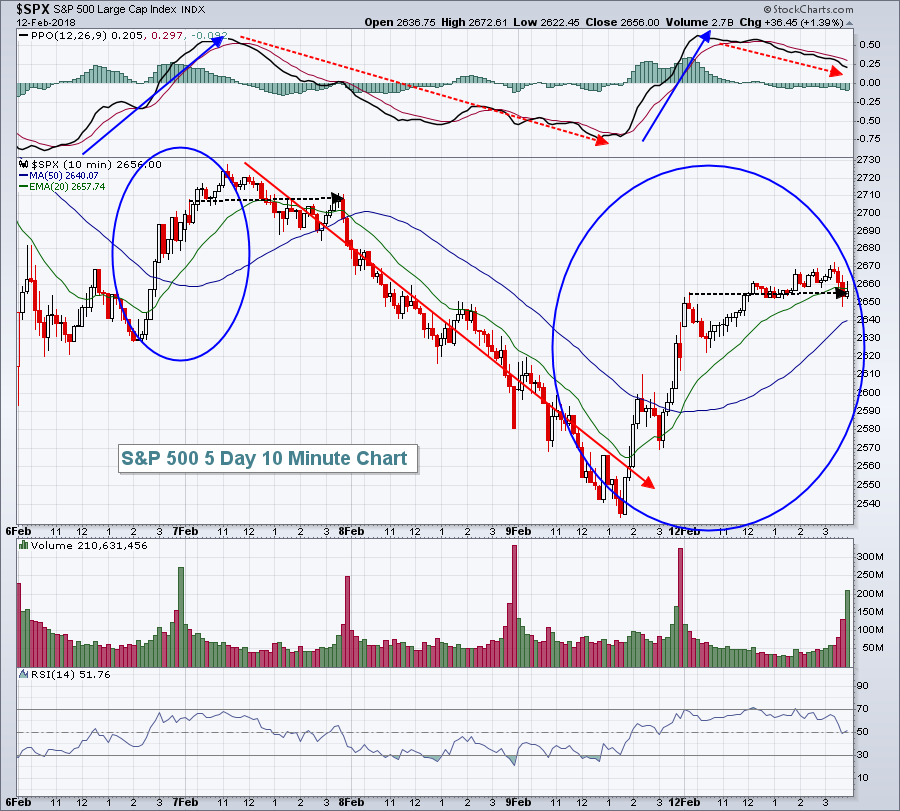
Apple Rebounds, Leads Technology Higher As Wall Street Gains For Second Straight Day
by Tom Bowley,
Chief Market Strategist, EarningsBeats.com
Market Recap for Monday, February 12, 2018
Wall Street saw more gains on Monday, continuing the strength we saw late during the Friday session. Most of the strength, however, came during the morning session as the benchmark S&P 500 hit 2660, rising 130 points or approximately 5%, off...
READ MORE
MEMBERS ONLY

STOCKS ARE BUILDING ON FRIDAY'S UPSIDE REVERSAL FROM 200-DAY AVERAGE -- THE NEXT TEST WILL COME AT 50-DAY AVERAGES -- SMALL AND MIDSIZE STOCK INDEXES ALSO BOUNCE OFF 200-DAY LINES
by John Murphy,
Chief Technical Analyst, StockCharts.com
MARKETS MOVE FURTHER AWAY FROM 200-DAY LINE... Stocks continue to build on the upside reversal that took place on Friday from 200-day moving averages. The daily bars in Chart 1 show the S&P 500 gaining enough ground today to climb back over its 100-day line (green line). The...
READ MORE
MEMBERS ONLY
CME Group Embraces Volatility and Bucks Selling Pressure
by Arthur Hill,
Chief Technical Strategist, TrendInvestorPro.com
The CME Group (CME), which has a number of volatility-based futures products, runs a variety of futures and options exchanges including the CME, CBOT, NYMEX and COMEX.
While the S&P 500 fell 8.82% over the last two weeks, CME Group actually gained ground and advanced 1.09%...
READ MORE