MEMBERS ONLY
U.S. Equities Recover, Stocks To Consider On A Rebound

by Tom Bowley,
Chief Market Strategist, EarningsBeats.com
Market Recap for Friday, February 9, 2018
For the first time in 18 months, the Dow Jones, S&P 500 and NASDAQ all closed out a week beneath their rising 20 week EMAs. After not seeing a meaningful pullback (more than 3%) for well over a year, our major...
READ MORE
MEMBERS ONLY

Thoughts on the Current Market

by Greg Morris,
Veteran Technical Analyst, Investor, and Author
I rarely, if ever, discuss the current market or offer any market analysis. StockCharts.com has many expert technical analysts that already do a bang up job on this. However, since I am writing a series on Building a Rules-Based Trend Following Model, I thought I would tell you how...
READ MORE
MEMBERS ONLY

Bonds Get Clipped

by Bruce Fraser,
Industry-leading "Wyckoffian"
As stocks have been getting roiled over the last two weeks, bonds have been somewhat overlooked. Bond prices began dropping in December 2017, and possibly contributed to the weakness in stock prices weeks later. It has been about a year since we have looked at treasury bonds. What are they...
READ MORE
MEMBERS ONLY
US Stock Traders Get Out Their Hammers

by Martin Pring,
President, Pring Research
* Bottoms are being “hammered” out
* VIX is quietening down
* Net new highs offer green shoots
* NASDAQ Chart is turning
Bottoms are being “hammered” out
It has certainly been a wild ride this week, but Friday saw several major indexes trace out a Japanese candlestick pattern known as a “hammer”. This...
READ MORE
MEMBERS ONLY
DP Weekly Wrap: Think Bear Market

by Carl Swenlin,
President and Founder, DecisionPoint.com
Last week I asserted that the character of the market had changed from super bullish to normal bullish, by which I meant that we should start to see more normal bull market corrections. On Monday I quickly revised that opinion and told Erin that I thought we may have entered...
READ MORE
MEMBERS ONLY

AN OVERSOLD S&P 500 IS TRYING TO STABILIZE AT ITS 200-DAY MOVING AVERAGE -- THE VIX INDEX IS PULLING BACK FROM RESISTANCE ABOVE THE 40 LEVEL FOR THE SECOND TIME THIS WEEK

by John Murphy,
Chief Technical Analyst, StockCharts.com
S&P 500 IS TESTING ITS 200-DAY AVERAGE ... The downside correction that started a week ago pushed stock prices lower again today. But they're trying to stabilize in afternoon trading. Chart 1 shows the S&P 500 trying to find support at its 200-day moving average....
READ MORE
MEMBERS ONLY

Weekly Market Review & Outlook (with Video) - The Main Driver for Stock Prices

by Arthur Hill,
Chief Technical Strategist, TrendInvestorPro.com
* The Main Driver for Stocks.
* Rate-of-Change Reaches an Extreme.
* Two Relatively Clean Bottoms.
* A Messy Bottom in 2011.
* Watching the 200-day First.
* Notes from the Art's Charts ChartList.
The Main Driver for Stock Prices
Today's report will focus on the S&P 500 because the...
READ MORE
MEMBERS ONLY
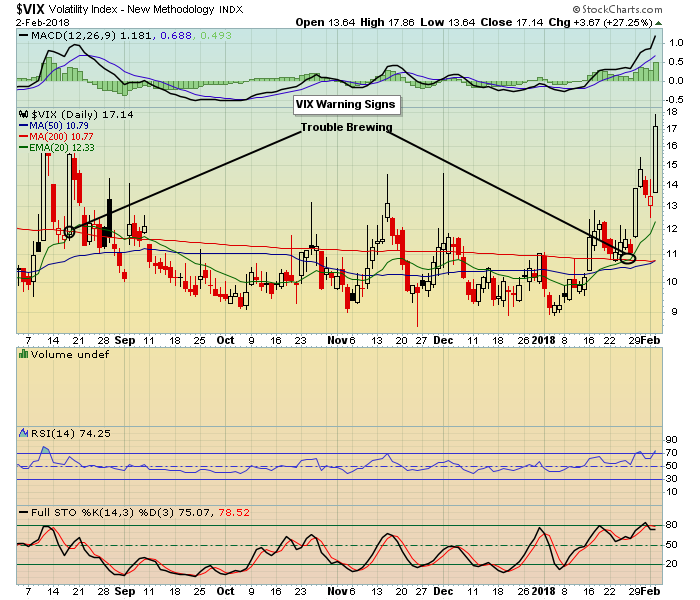
A High VIX Means Irrational Market Swings
by Tom Bowley,
Chief Market Strategist, EarningsBeats.com
Market Recap for Thursday, February 8, 2018
For now, forget about the strong earnings season that we just witnessed. Also, forget about bond yields rising, which I view as a very bullish development generally-speaking as it allows money to rotate from the more defensive bond market to the more aggressive...
READ MORE
MEMBERS ONLY
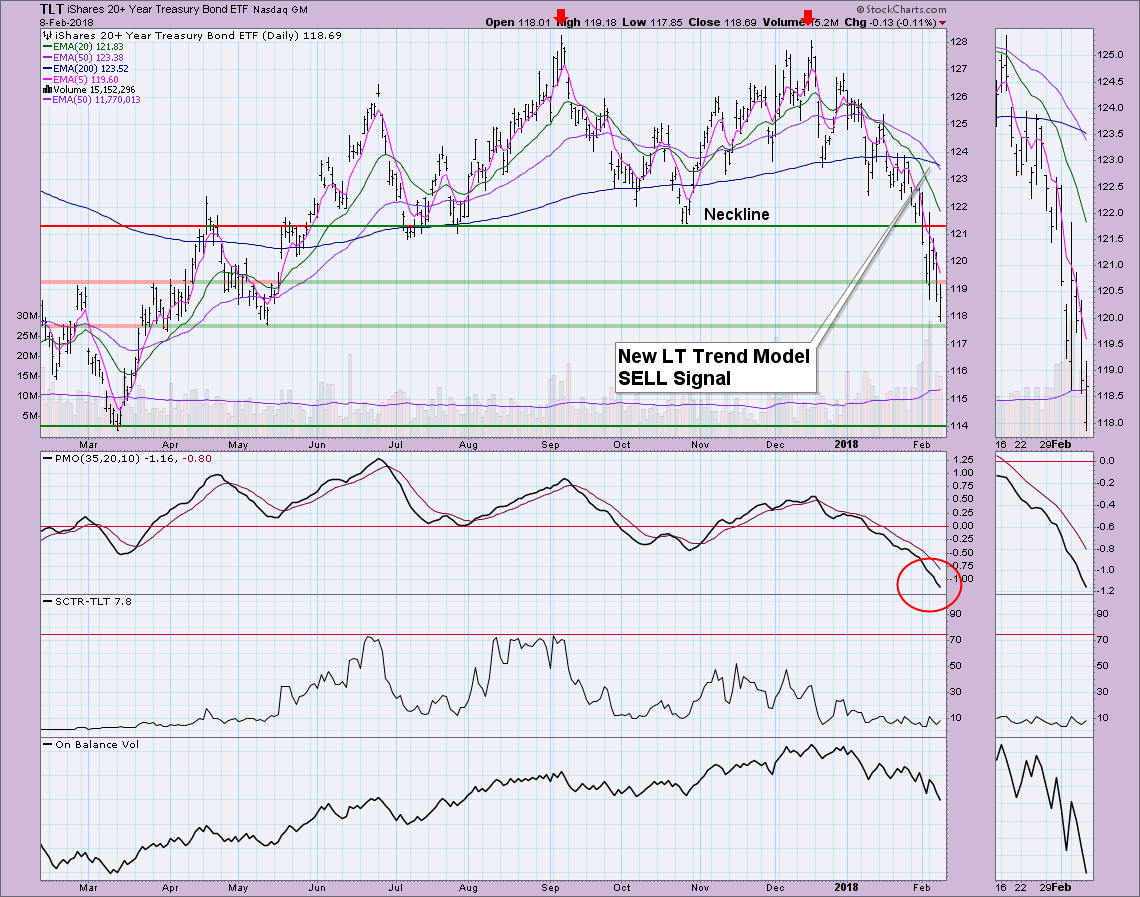
DP Bulletin: TLT New Long-Term Trend Model SELL Signal - ST Indicators Extremely Oversold

by Erin Swenlin,
Vice President, DecisionPoint.com
Two charts you should look at now. I mentioned yesterday that TLT was going to see a Long-Term Trend Model SELL signal today and it did. Additionally, ST indicators which had turned up have turned back down and have reached down into very oversold extremes.
While the PMO may appear...
READ MORE
MEMBERS ONLY

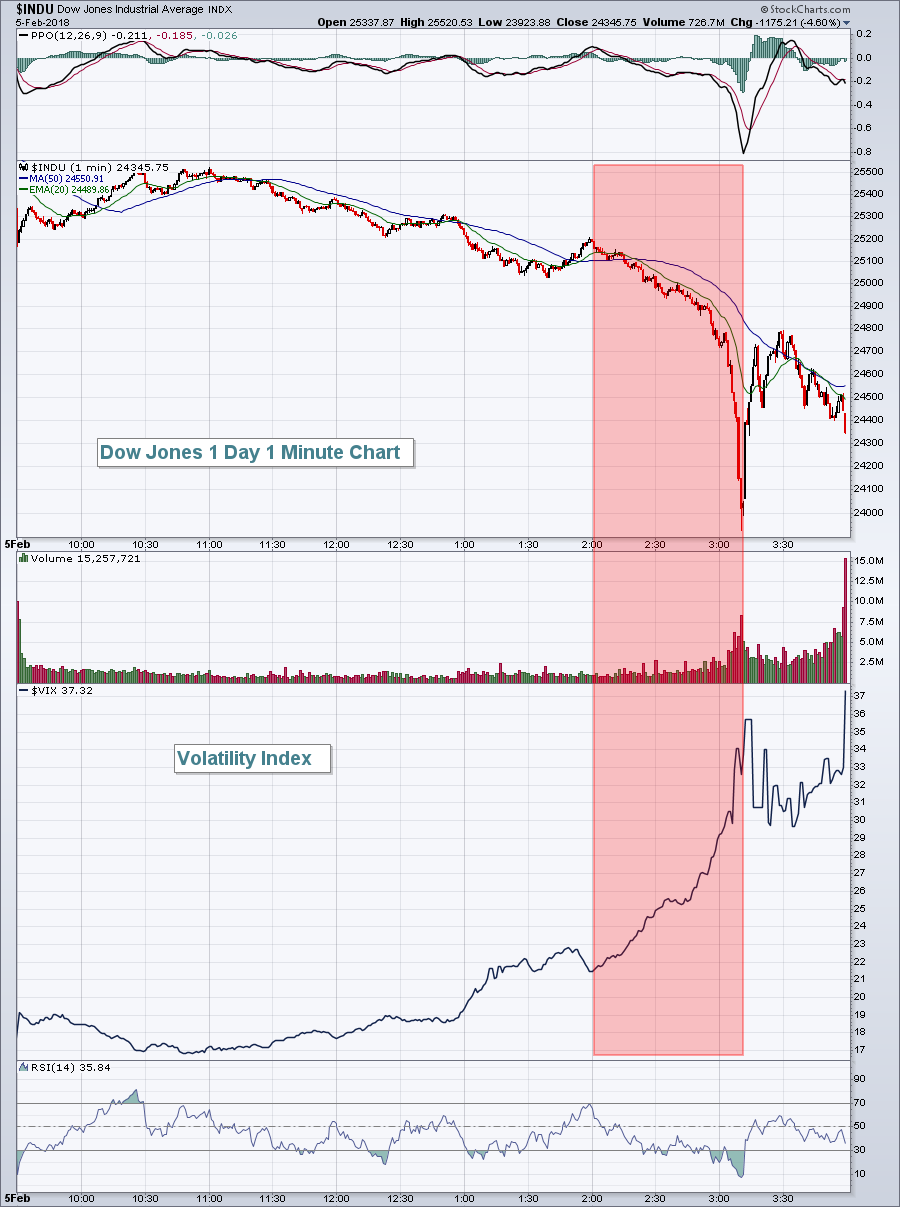
STOCK INDEXES ARE RETESTING INTRA-DAY SUPPORT LEVELS FORMED ON TUESDAY -- THE REBOUND IN THE VIX IS MUCH WEAKER THAN ON TUESDAY
by John Murphy,
Chief Technical Analyst, StockCharts.com
MAJOR STOCK INDEXES ARE RETESTING TUESDAY'S INTRA-DAY LOWS... Stocks are falling sharply again today and are in the process of retesting intra-day support levels formed on Tuesday. That's an important test. The 10-minute bars in Chart 1 shows the Dow Industrials testing lows formed Tuesday between...
READ MORE
MEMBERS ONLY
Copper Prices Remain In Strong Uptrend And That's Bullish For The S&P 500
by Tom Bowley,
Chief Market Strategist, EarningsBeats.com
Market Recap for Wednesday, February 7, 2018
With the exception of a fractional gain in the small cap Russell 2000, late day selling resulted in losses on each of our major indices. The Dow Jones spent much of the day in positive territory and sported a 270 point gain with...
READ MORE
MEMBERS ONLY

Not Many Hiding Places - Oil Turns and XLE Triggers Breadth Signals.
by Arthur Hill,
Chief Technical Strategist, TrendInvestorPro.com
* Nowhere to Hide.
* Majority of Stocks Remain Weak.
* VIX Remains at Lofty Levels.
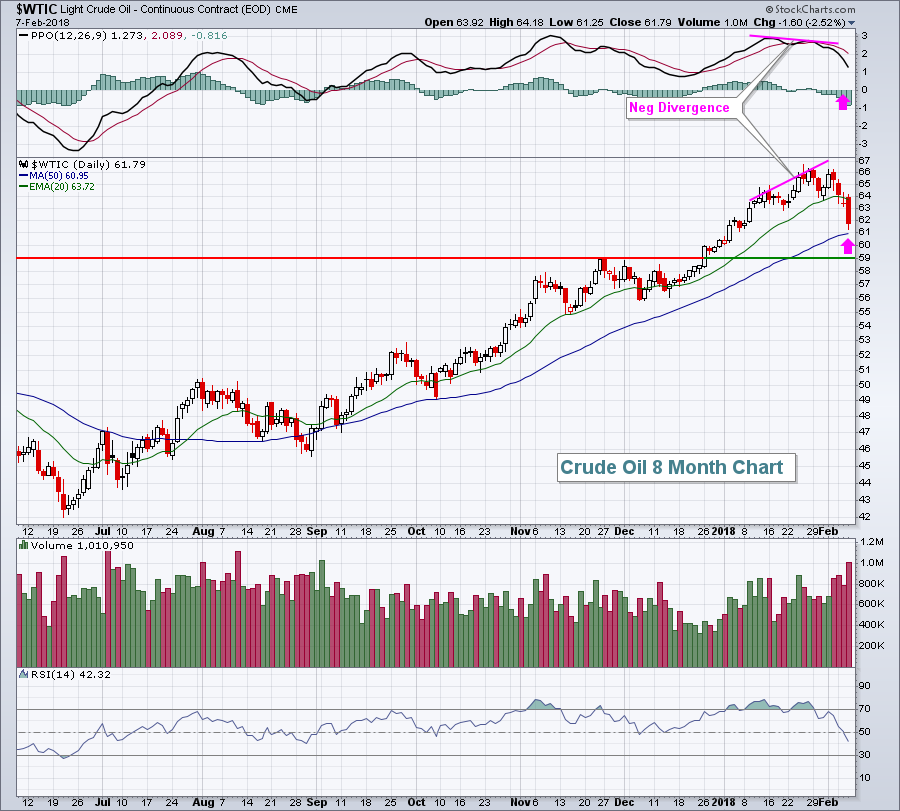
* Oil Starts to Correct.
* XES Extends Correction and Breaks Wedge Line.
* XLE Triggers Bearish Breadth Signals.
* Charting Breadth Indicators.
February marked a sudden and dramatic shift in the financial markets. As the PerfChart below shows, stocks, oil,...
READ MORE
MEMBERS ONLY

DP Alert: New PMO BUY Signal on Dollar - TLT Narrowly Misses Long-Term SELL Signal
by Erin Swenlin,
Vice President, DecisionPoint.com
No one can deny that this correction has been difficult and it has certainly left investors uneasy. However, the VIX is calming down somewhat and the Swenlin Trading Oscillators have bottomed. I don't think the market is completely out of the woods from an intermediate-term indicator perspective. UUP...
READ MORE
MEMBERS ONLY

BOND YIELDS CLIMB BACK NEAR RECENT HIGH -- A BOUNCING DOLLAR IS PUSHING COMMODITIES LOWER -- THE RUSSELL 2000 SMALL CAP INDEX IS BOUNCING OFF ITS 200-DAY MOVING AVERAGE -- THE S&P 500 SLIPS INTO THE RED NEAR THE CLOSE IN HEAVIER TRADING
by John Murphy,
Chief Technical Analyst, StockCharts.com
10-YEAR TREASURY YIELD NEARS ANOTHER FOUR-YEAR HIGH ... A plunging stock market earlier in the week caused some safe-haven bond buying which caused bond yields to weaken. Chart 1, however, shows the 10-Year Treasury yield climbing 7 basis points today and very close to another four-year high. The recent upside breakout...
READ MORE
MEMBERS ONLY

Intel Holds Support with Three Day Reversal
by Arthur Hill,
Chief Technical Strategist, TrendInvestorPro.com
Intel (INTC) was hit hard the first three days of February, but the stock managed to hold support with a high volume reversal over the last three days.
First and foremost, the long-term trend is up because Intel recorded a 52-week high in late January and the 50-day EMA is...
READ MORE
MEMBERS ONLY
I'll Step Out On That Limb, The Bottom Is In
by Tom Bowley,
Chief Market Strategist, EarningsBeats.com
Market Recap for Tuesday, February 6, 2018
Volatility is the name of the game right now and big swings - both up and down - should be expected in the near-term. Yesterday was the bulls' turn as our major indices rallied back, led by the Dow Jones' 567...
READ MORE
MEMBERS ONLY

Evidence of A Bottom Looking Stronger
by Martin Pring,
President, Pring Research
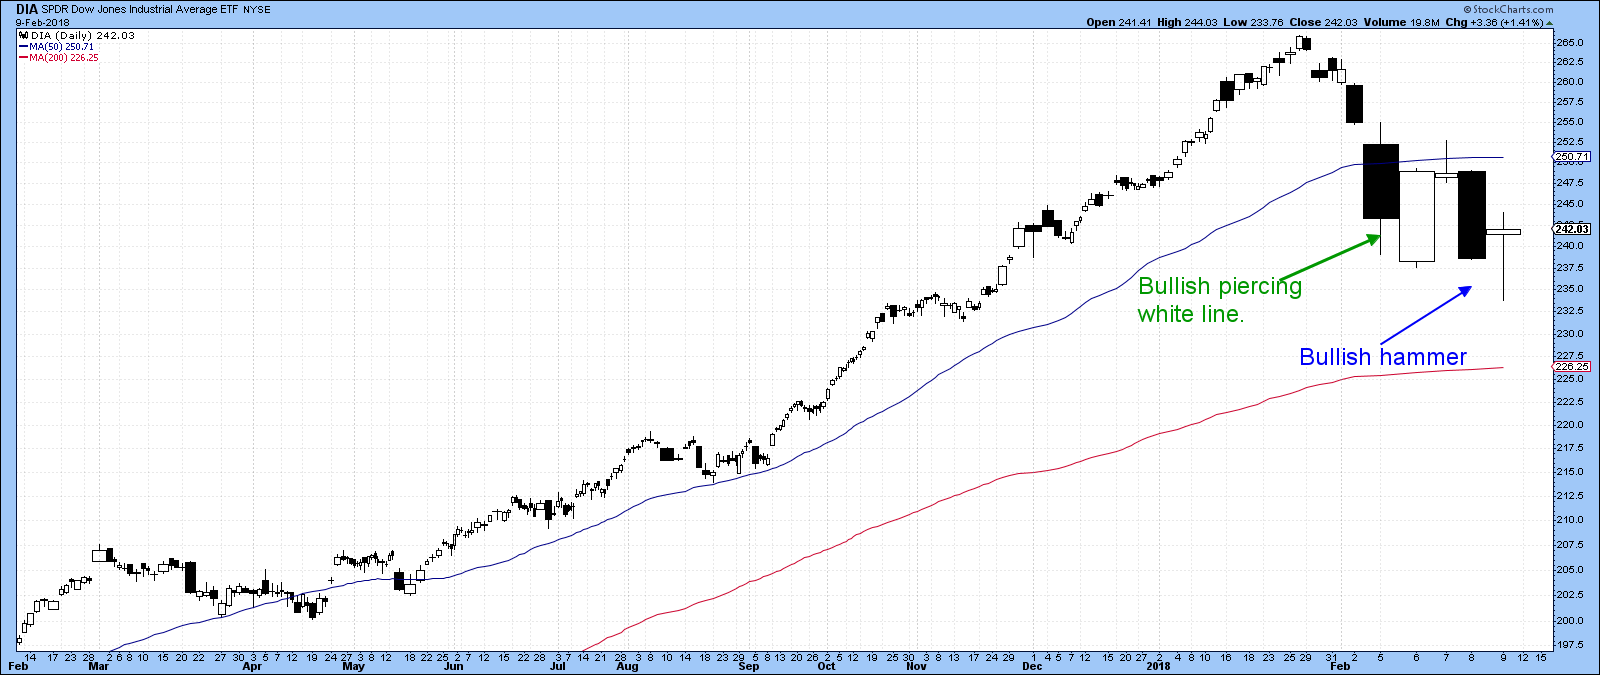
* Bullish piercing white line
* Bullish volume
* VIX signaling volatility retreating again
Bullish piercing white line
Tuesday’s market action suggests that the selling squall is over, at least for the time being. That’s because a couple of indexes experienced a bullish candlestick pattern known as a piercing white line....
READ MORE
MEMBERS ONLY

STOCKS ACHIEVE UPSIDE REVERSAL -- S&P 500 BOUNCES OFF TRENDLINE SUPPORT AND 100-DAY AVERAGE -- THE VIX REVERSES LOWER AFTER FAILING TO STAY OVER 40 LEVEL -- APPLE AND DOWDUPONT BOUNCE SHARPLY OFF 200-DAY AVERAGES
by John Murphy,
Chief Technical Analyst, StockCharts.com
S&P 500 REBOUNDS OFF CHART SUPPORT... After opening sharply lower, stocks achieved an upside reversal on heavier volume than yesterday. And stocks bounced off a couple of important support levels. Yesterday's message showed a rising trendline extending back to late 2016 near the 2600 level. The...
READ MORE
MEMBERS ONLY

What To Look For Next
by Martin Pring,
President, Pring Research
* Primary trend indicators are still bullish
* Short-term indicators still overbought
* Very short-term indicators already at extremes
* Bonds bottoming short-term?
I have been saying for some time that the market’s primary trend is a bullish one and that we should not get hung up with short-term corrections. That theory is...
READ MORE
MEMBERS ONLY
Look To VIX To Call Market Bottom
by Tom Bowley,
Chief Market Strategist, EarningsBeats.com
Market Recap for Monday, February 5, 2018
What a day and especially what a final hour! It was very reminiscent of selling episodes in 2008 where our major indices were losing a percent every few minutes. From a bullish perspective, there's little defense from panicked selling other than...
READ MORE
MEMBERS ONLY

Is this Just a Correction or Something More?
by Arthur Hill,
Chief Technical Strategist, TrendInvestorPro.com
* First Things First (Correction or More?).
* Another Perfect Storm.
* Yield Curve Turns Up.
* Oversold Setup in Breadth Indicators.
* A Bullish Setup for VIX.
* Playing the Guessing Game.
* Past Corrections Study.
First Things First
It is still a bull market. The 50-day EMA for the S&P 500 remains above...
READ MORE
MEMBERS ONLY
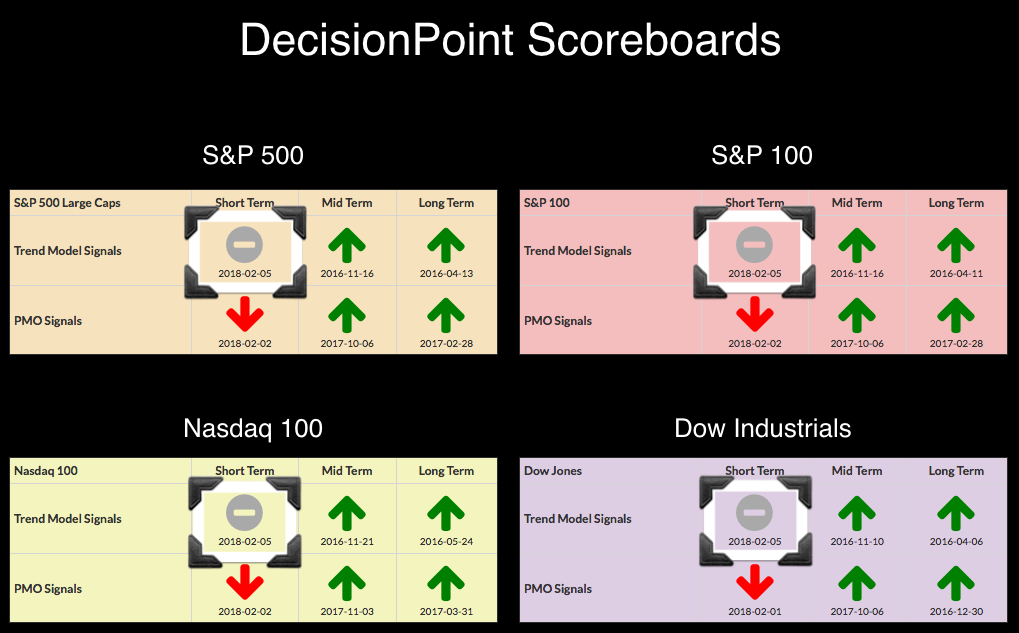
DP Bulletin: ST Trend Model Neutrals on Scoreboard Indexes - PMO SELL for Gold
by Erin Swenlin,
Vice President, DecisionPoint.com
Today all four Scoreboard indexes (NDX, INDU, SPX & OEX) logged new Short-Term Trend Model Neutral signals. These signals arrived when the 5-EMA crossed below the 20-EMA while the 20-EMA was above the 50-EMA. In addition, we saw a new PMO SELL signal on Gold. I've included the...
READ MORE
MEMBERS ONLY

STOCKS HAVE WORST DAY IN YEARS -- 50-DAY AVERAGES HAVE BEEN BROKEN -- S&P 500 APPEARS HEADED FOR RETEST OF RISING TRENDLINE EXTENDING BACK TO 2016 -- VIX DOUBLES TO HIGHEST LEVEL IN MORE THAN TWO YEARS -- LATE RALLY IN MAJOR STOCK INDEXES FADES
by John Murphy,
Chief Technical Analyst, StockCharts.com
S&P 500 FALLS BELOW 50-DAY AVERAGE... Stocks had a terrible day today. Major stock indexes in the U.S. lost about 4% in one day. And some chart damage was done. The daily bars in Chart 1 show the S&P 500 falling well below its 50-day...
READ MORE
MEMBERS ONLY

Palo Alto Holds above Breakout Zone
by Arthur Hill,
Chief Technical Strategist, TrendInvestorPro.com
The stock market was hit with hard selling pressure last week, but Palo Alto Networks (PANW) held up rather well and move below its breakout zone. Stocks that hold up best during a broad market correction are often the ones that lead on the rebound.
The chart shows PANW in...
READ MORE
MEMBERS ONLY

A few hundred points in the S&P 500.... Who cares?

by Julius de Kempenaer,
Senior Technical Analyst, StockCharts.com
The rough ride down in the markets last Friday was something that was probably expected by many but still came as a surprise. I am not a big fan of “calling tops”, or troughs for that matter. Mainly because many of these “predictions” have had many failed attempts to “call...
READ MORE
MEMBERS ONLY
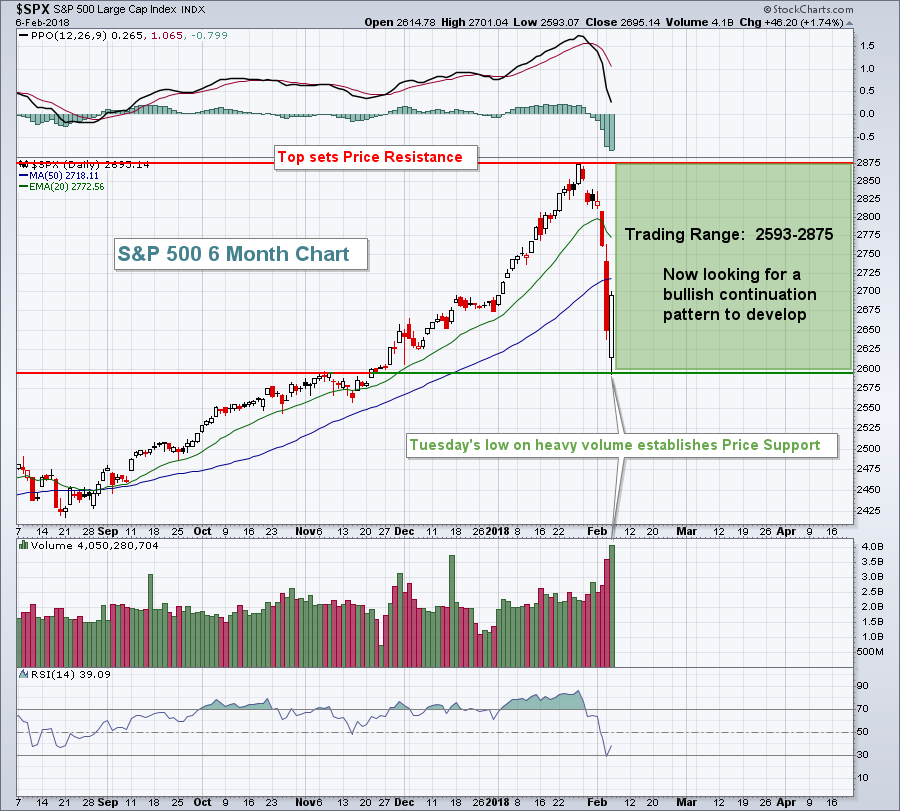
Stocks Slammed, Futures Lower; Here's A Possible Support Level
by Tom Bowley,
Chief Market Strategist, EarningsBeats.com
Market Recap for Friday, February 2, 2018
It was an ugly day on Wall Street. In fact, it was the ugliest day on Wall Street since June 24, 2016, when the Dow Jones last fell more than 600 points. Friday's drop was 665 points and the technical damage...
READ MORE
MEMBERS ONLY

AAPL Pie
by Bruce Fraser,
Industry-leading "Wyckoffian"
Apple, Inc. has been an endlessly illuminating Wyckoff Method case study during this bull market advance. The ascension of AAPL demonstrates the power of large institutional sponsorship. The top echelon of this sponsorship is what Wyckoffians call the ‘Composite Operator’ (C.O.). The footprints of the C.O. can be...
READ MORE
MEMBERS ONLY
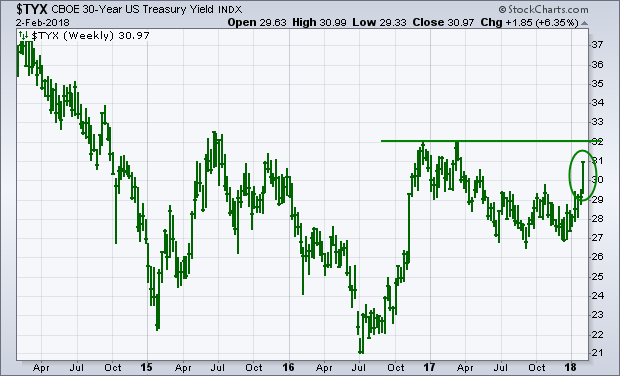
Bond Yields Climbing, Gaining on Stocks
by John Murphy,
Chief Technical Analyst, StockCharts.com
Bond yields are rising a lot faster than a lot of people expected. And that's starting to worry stock holders. The weekly bars in Chart 1 show the 30-Year Treasury Yield rising over 3.00% for the first time since last March and heading up for a challenge...
READ MORE
MEMBERS ONLY
Every Setback Presents Fresh Opportunities

by John Hopkins,
President and Co-founder, EarningsBeats.com
Traders who are "all in" on the long side hate days like this past Friday when the market got slammed big time, with the Dow down 2.6%, the NASDAQ down 2.1% and the S&P down 2%, the worst overall showing in two years. And...
READ MORE
MEMBERS ONLY
The NASDAQ 100 And Its Best Seasonal Candidates In February
by Tom Bowley,
Chief Market Strategist, EarningsBeats.com
Identifying The Candidates
I've included the month-by-month seasonal information for all NASDAQ 100 ($NDX) stocks in an Excel spreadsheet. In an effort to identify the best seasonal stocks on the NDX, I first considered the number of years history for each stock. For instance, I eliminated JD.com...
READ MORE
MEMBERS ONLY
Building a Rules-Based Trend Following Model - 4
by Greg Morris,
Veteran Technical Analyst, Investor, and Author
We have covered most of the preliminary issues such as digital measures and compound measures. This article will discuss the concept of Weight of the Evidence. I have been fond of a weight of the evidence approach for over 30 years. The concept of “weight of the evidence” came from...
READ MORE
MEMBERS ONLY

Long-term Treasury Yields Finally Play Catch Up
by Arthur Hill,
Chief Technical Strategist, TrendInvestorPro.com
Short-term Treasury yields have been moving sharply higher since September with the 5-yr and 2-yr yields hitting multi-year highs over the last few months. Yields at the long end of the curve are lagging, but appear to be catching up finally as the 10-yr yield broke out in January and...
READ MORE
MEMBERS ONLY
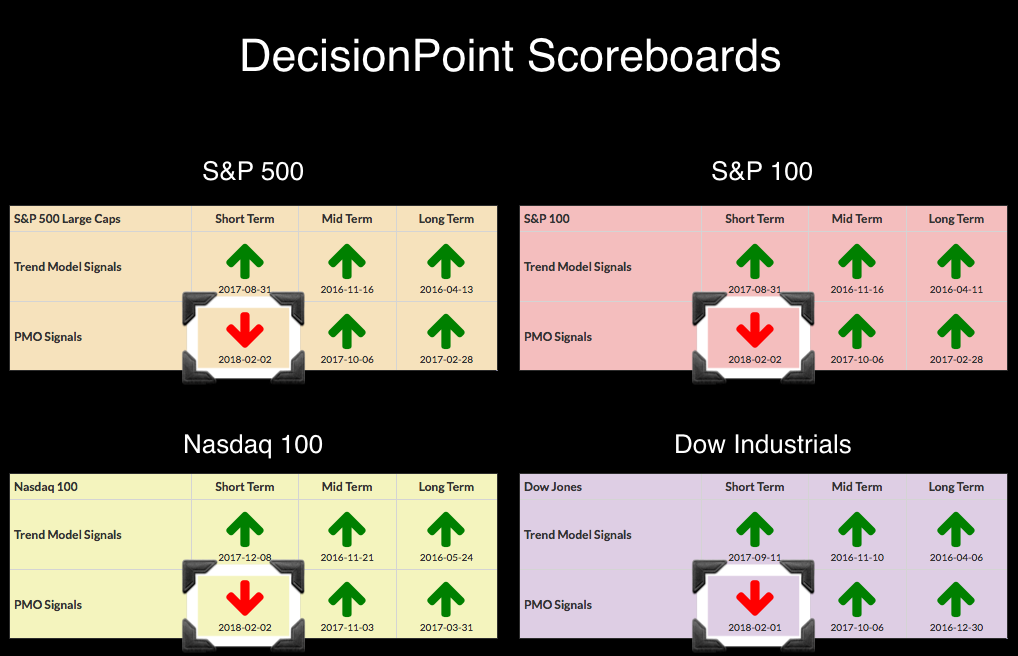
DecisionPoint Scoreboards Seeing Red, But ST Indicators Very Oversold Already
by Erin Swenlin,
Vice President, DecisionPoint.com
It's been nearly a month since we saw our last signal changes to the DecisionPoint Scoreboards, but with the pullback over the past week, momentum turned negative and now we are seeing new Price Momentum Oscillator (PMO) SELL signals on all four!
The Dow actually incurred its PMO...
READ MORE
MEMBERS ONLY
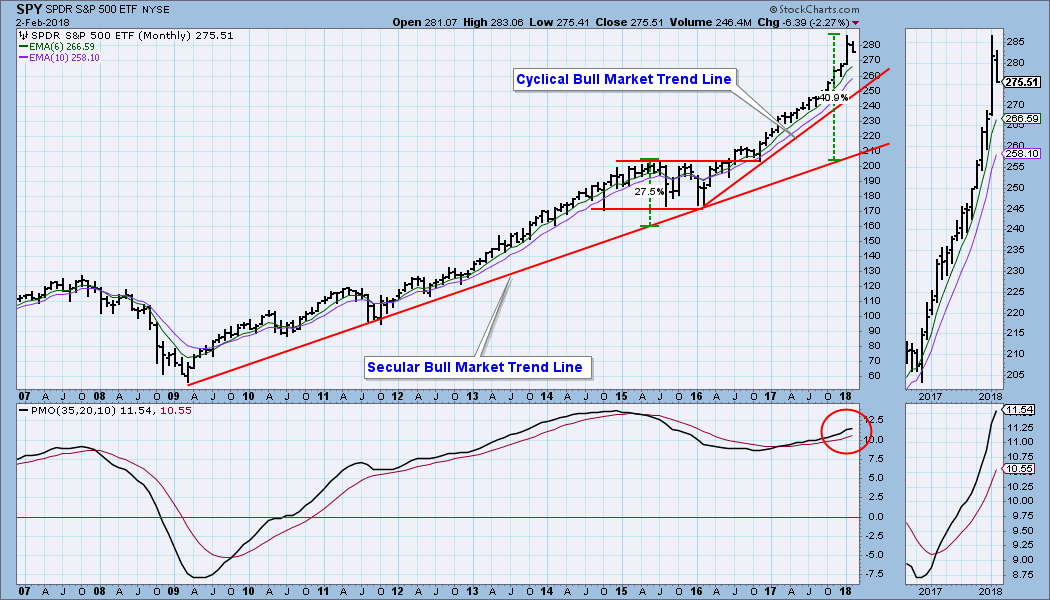
DP Weekly Wrap: Inadequate Correction
by Carl Swenlin,
President and Founder, DecisionPoint.com
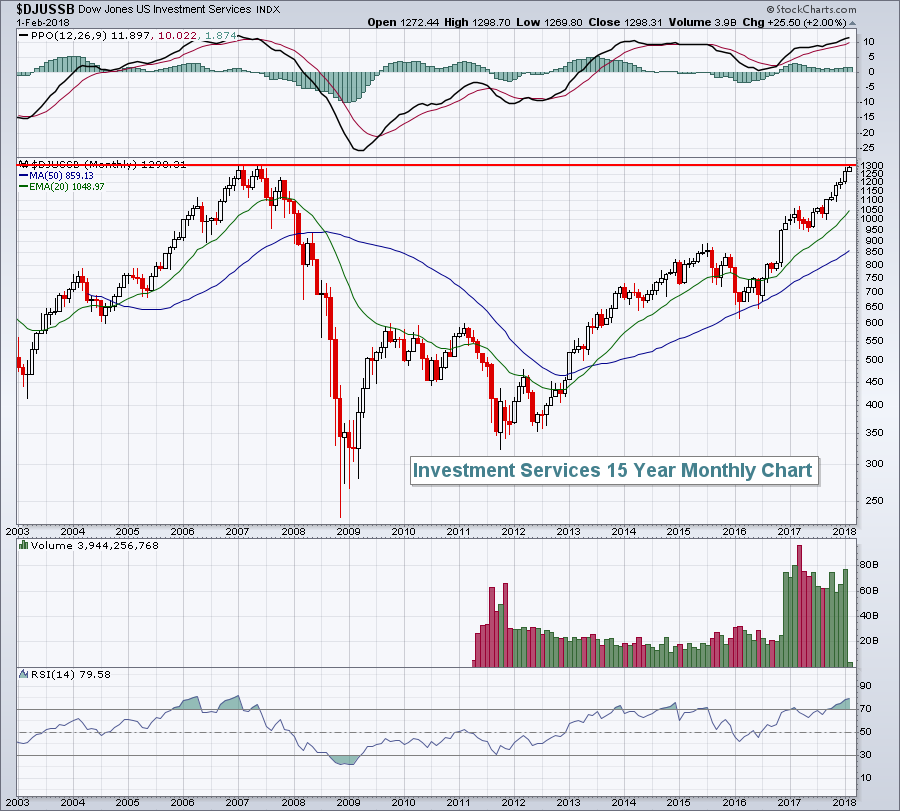
Because the DP Weekly Wrap is a recap of the week just ended, I normally lead with a daily chart; however, since there is so much agony being expressed about this week's correction, I am leading with a monthly chart to try to put things in proper perspective....
READ MORE
MEMBERS ONLY

RISING BOND YIELDS ARE RATTLING STOCK HOLDERS -- TEN YEAR YIELD REACHES FOUR-YEAR HIGH -- BOND YIELDS ARE RISING FASTER THAN STOCKS FOR THE FIRST TIME SINCE THE BULL MARKET STARTED -- THE VIX INDEX SURGES TO FIFTEEN-MONTH HIGH
by John Murphy,
Chief Technical Analyst, StockCharts.com
BOND YIELDS ARE CLIMBING ... Bond yields are rising a lot faster than a lot of people expected. And that's starting to worry stock holders. The weekly bars in Chart 1 show the 30-Year Treasury Yield rising over 3.00% for the first time since last March and heading...
READ MORE
MEMBERS ONLY

Weekly Market Review & Outlook (with Video) - Disconnects Could Raise the VIX Range
by Arthur Hill,
Chief Technical Strategist, TrendInvestorPro.com
* Turn of the Month Turns Negative.
* SPY Holds the Gap.
* Is the VIX Returning to Normal?.
* S&P 500 Correction Targets.
* Watching for Oversold Breadth.
* IBB Corrects from New High.
* Gold Maintains Upswing as Dollar Falls.
* Notes from the Art's Charts ChartList.
* Videos with Interesting Takes.
Turn...
READ MORE
MEMBERS ONLY
AAPL, AMZN And GOOGL Report Results; Futures Tumble
by Tom Bowley,
Chief Market Strategist, EarningsBeats.com
Market Recap for Thursday, February 1, 2018
We saw a lot of bifurcation in the market on Thursday. The more aggressive NASDAQ and Russell 2000 rebounded and finished in positive territory, while both the Dow Jones and S&P 500 fell on the session. Four sectors finished higher, while...
READ MORE
MEMBERS ONLY

Market Roundup With Martin Pring 2018-02-01
by Martin Pring,
President, Pring Research
* Big changes in all four areas
* Equities
* Commodities
* Currencies
* Bonds
This months market roundup has a lot of charts that are breaking out on long term relative strength breakouts.
Market Roundup With Martin Pring 2018-02-01 from StockCharts.com on Vimeo.
Chartcon 2018 registration is now open! Registration kicked off today,...
READ MORE
MEMBERS ONLY
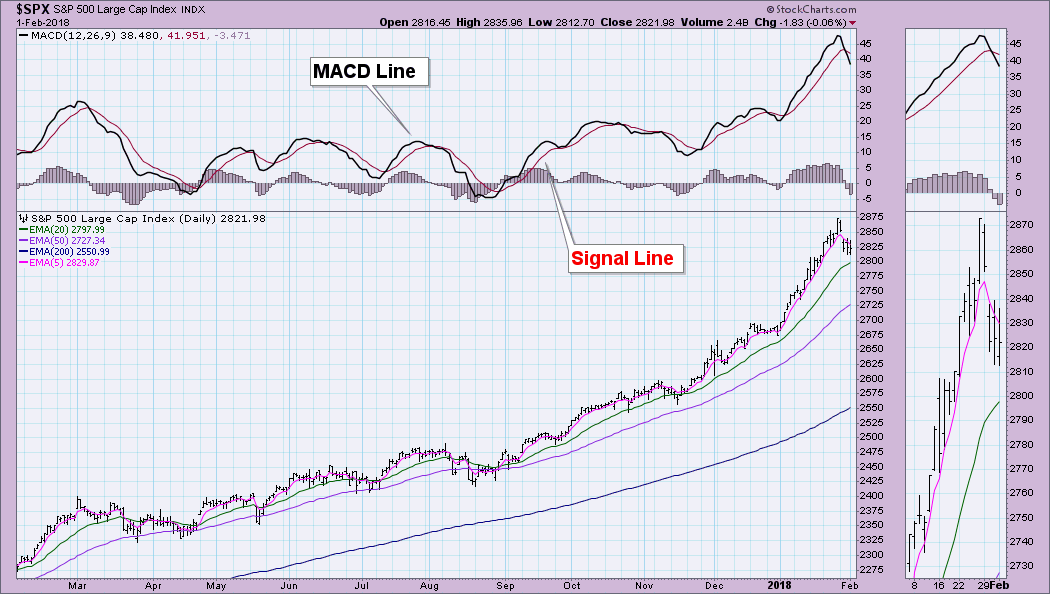
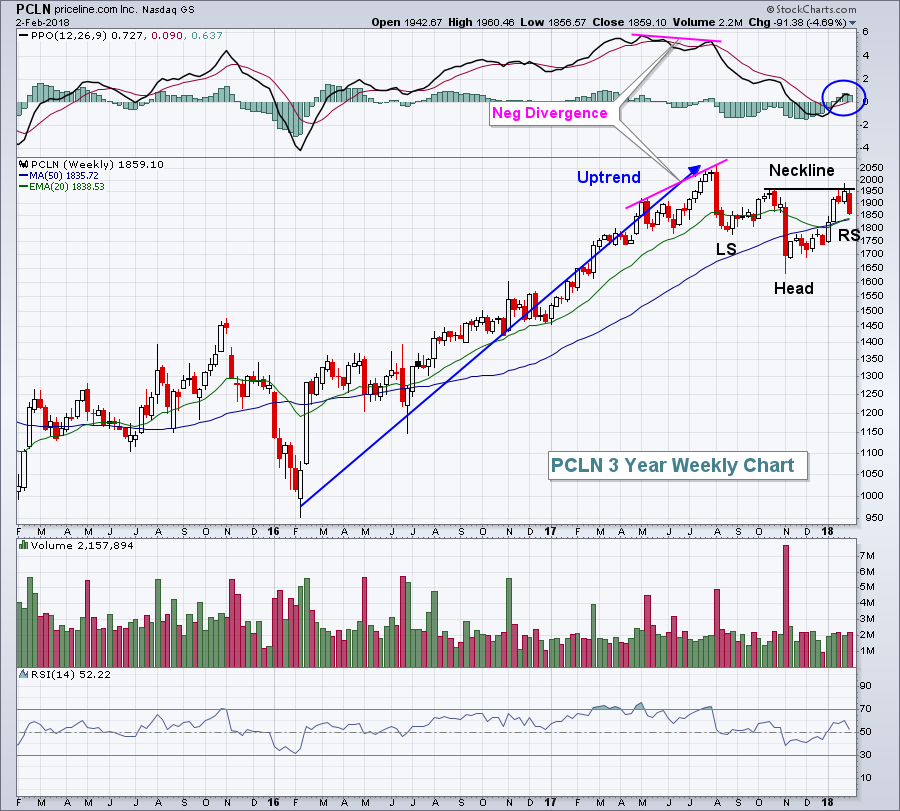
What's the Difference Between the PMO (Price Momentum Oscillator) and MACD/PPO?
by Erin Swenlin,
Vice President, DecisionPoint.com
I am often asked first, "What's the difference between the PMO and the MACD (or PPO)?" which is usually followed by, "Why do you prefer the PMO?". I'll answer the second question right now. As a mother loves her child, so do...
READ MORE
MEMBERS ONLY

Pause In An Ongoing Uptrend?
by Martin Pring,
President, Pring Research
* The underlying trend of improving confidence continues
* Several indicators are pointing to some kind of a correction
* Small caps are lagging
The underlying trend of improving confidence continues
The longer-term indicators monitoring the primary trend of the US stock market continue to point north. So too, do the various confidence...
READ MORE