MEMBERS ONLY
Begin with the Big Trend in Mind - Market, Sector, Industry and Stock

by Arthur Hill,
Chief Technical Strategist, TrendInvestorPro.com
.... Big Winners and Losers During Earnings Season
.... Automatically Charting Sector and Industry Group
.... Follow the Broader Market
.... De-selection is Part of the Selection Process ....
Big Winners and Losers During Earnings Season
Stock picking is a tough game, even in the best of times. Earnings season is still underway and we...
READ MORE
MEMBERS ONLY
Transportation Services Is A Live Case Study In Rotation After A Negative Divergence

by Tom Bowley,
Chief Market Strategist, EarningsBeats.com
Market Recap for Wednesday, November 1, 2017
U.S. stocks jumped higher out of the gates at Wednesday's open, but was unable to hang onto those gains - especially on the NASDAQ. We did see a bit of strength in the final couple hours, though, after the FOMC...
READ MORE
MEMBERS ONLY
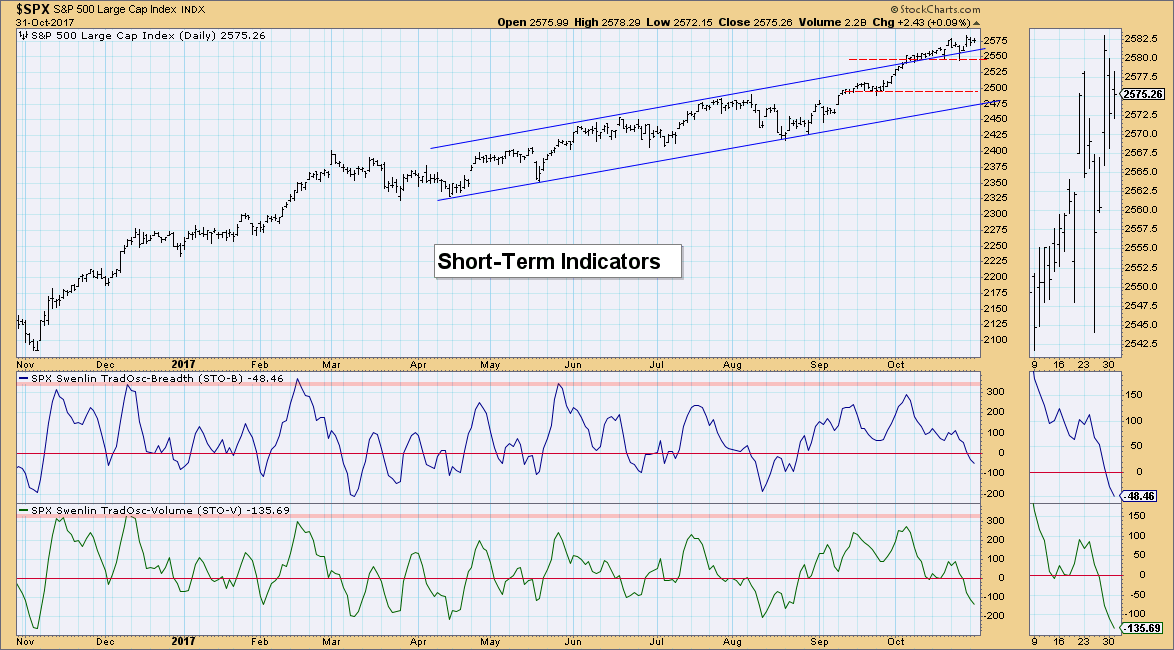
Short-Term Indicators Bottom Quickly - IT Indicators Still Moving Lower

by Erin Swenlin,
Vice President, DecisionPoint.com
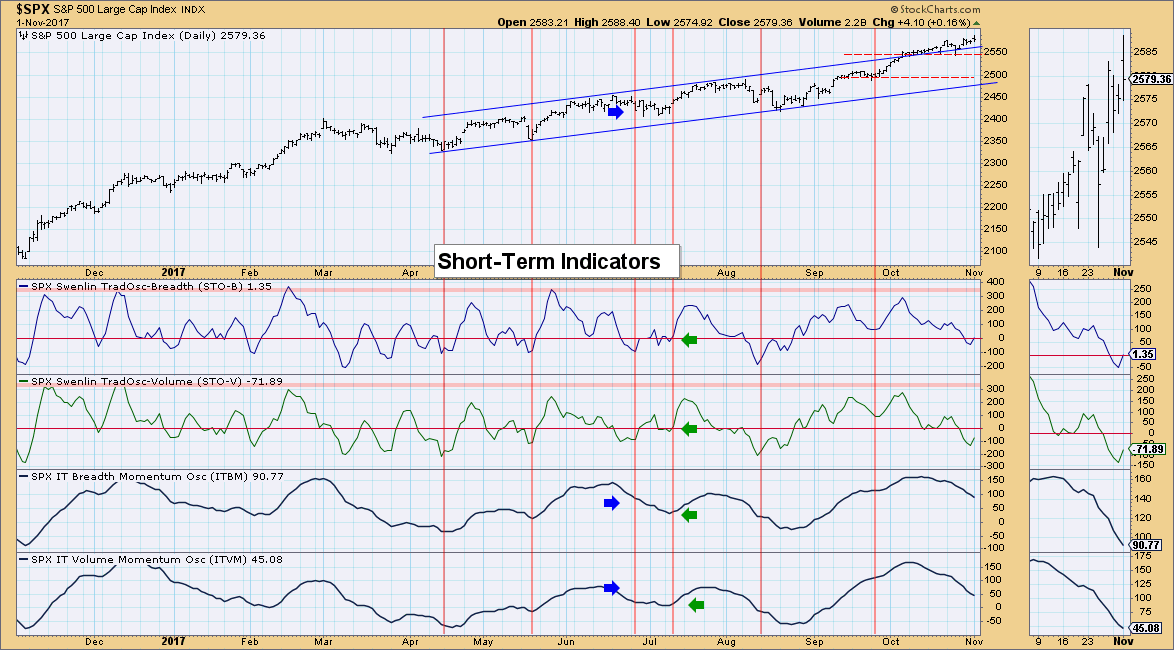
I promised to inform you when the Swenlin Trading Oscillators bottom in a concerted move to the upside and it happened already today. I pointed out in yesterday's blog article that the Swenlin Trading Oscillators (STOs) were now hitting oversold territory. This is exactly what we want to...
READ MORE
MEMBERS ONLY

Zahorchak Revisited

by Greg Morris,
Veteran Technical Analyst, Investor, and Author
A couple of years ago I introduced a trend following technique which I first learned in the late 1970s. I thought this would be a good time to review it; especially since this technique is now available in StockCharts.com’s symbol catalog.
A trend follower’s lament:
“Only the...
READ MORE
MEMBERS ONLY

BLOOMBERG COMMODITY INDEX RISES TO EIGHT MONTH HIGH -- BASE METALS ETF REACHES HIGHEST LEVEL IN FOUR YEARS -- BRENT CRUDE OIL EXCEEDS $60 FOR FIRST TIME IN TWO YEARS

by John Murphy,
Chief Technical Analyst, StockCharts.com
BLOOMBERG COMMODITY INDEX REACHES EIGHT-MONTH HIGH... With all of the attention focused on daily stock market records, it may be going unnoticed that commodity prices are starting to show some decent gains. The weekly bars in Chart 1 show the Bloomberg Commodity Index ($BCOM) rising to the highest level in...
READ MORE
MEMBERS ONLY
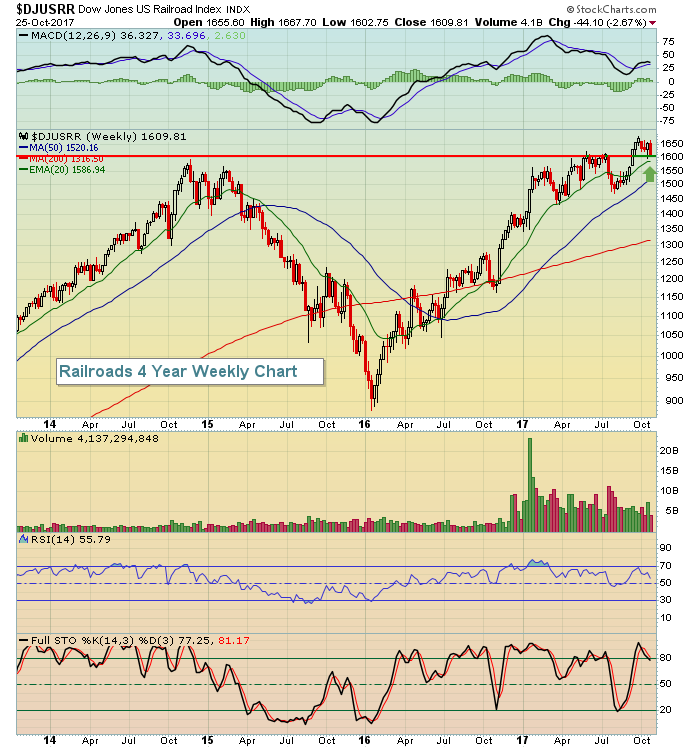
Crude Oil Threatening Break Above $55 Per Barrel; A Look At Transports
by Tom Bowley,
Chief Market Strategist, EarningsBeats.com
Market Recap for Tuesday, October 31, 2017
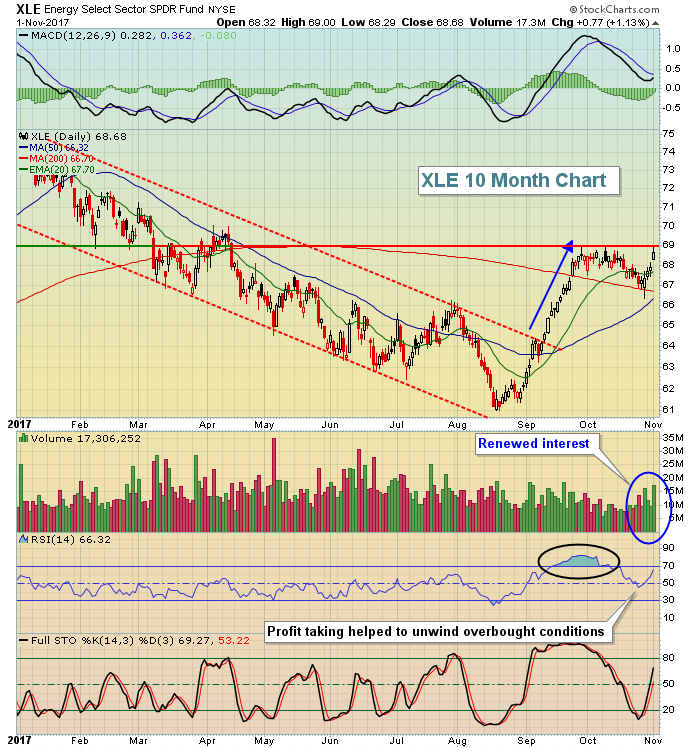
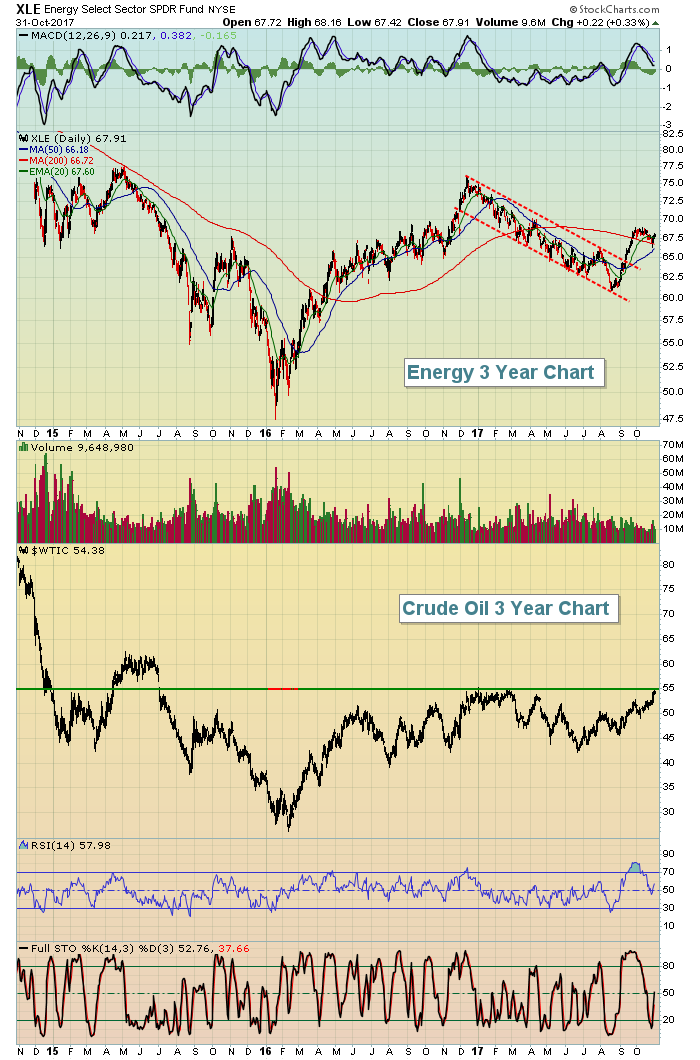
Don't look now, but crude oil prices ($WTIC) are on the verge of moving to a 2 1/2 year high. Energy (XLE, +0.33%) has shown life since ending its downtrend that began back in December 2016. Rising prices in...
READ MORE
MEMBERS ONLY
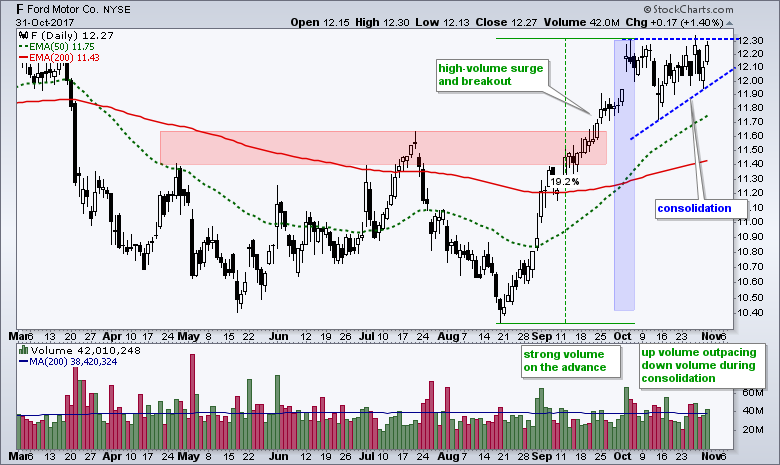
Ford Stalls before Making Next Move
by Arthur Hill,
Chief Technical Strategist, TrendInvestorPro.com
Ford (F) consolidated after a big advance and this consolidation looks like a bullish continuation pattern. First, industry group strength and the long-term uptrend are in Ford’s favor. Ford is part of the red-hot Global Auto ETF (CARZ), which is up over 20% from its April low and trading...
READ MORE
MEMBERS ONLY
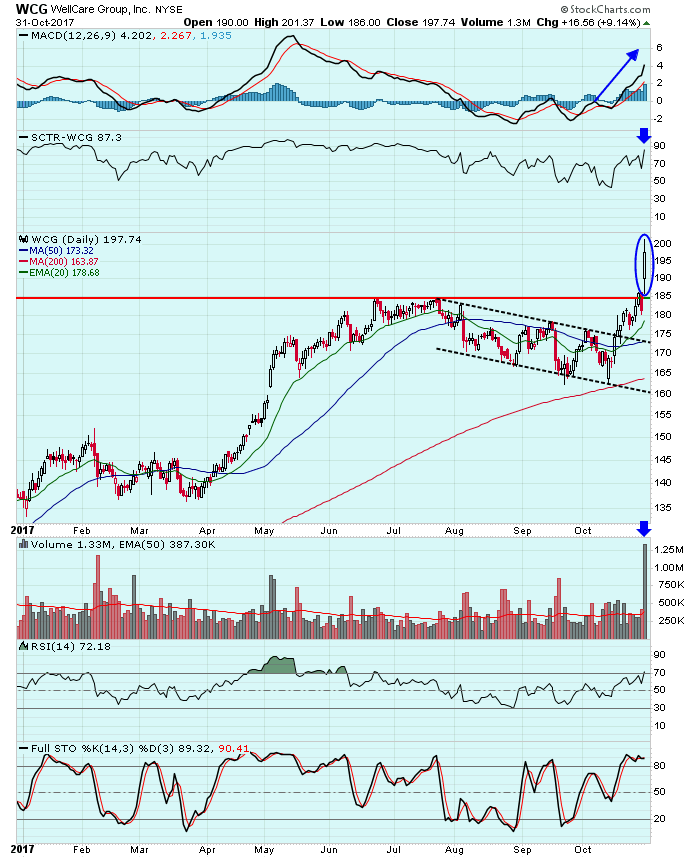
Volume Confirms Breakout For WellCare Group
by Tom Bowley,
Chief Market Strategist, EarningsBeats.com
WellCare Group (WCG) posted quarterly earnings that beat Wall Street consensus estimates and the stock soared above recent price resistance. Volume surged as traders accumulated the healthcare provider. The Dow Jones U.S. Health Care Providers Index ($DJUSHP) broke out recently and WCG has performed exceptionally well on a relative...
READ MORE
MEMBERS ONLY
Swenlin Trading Oscillators Reaching Oversold Levels
by Erin Swenlin,
Vice President, DecisionPoint.com
The Swenlin Trading Oscillator (STO) is an overbought/oversold indicator that can assist in identifying short-term tops and bottoms. There are two versions, one using advances and declines (STO-B), and one using advancing and declining volume (STO-V). DecisionPoint analysis considers these to be short-term indicators. Right now they are quickly...
READ MORE
MEMBERS ONLY
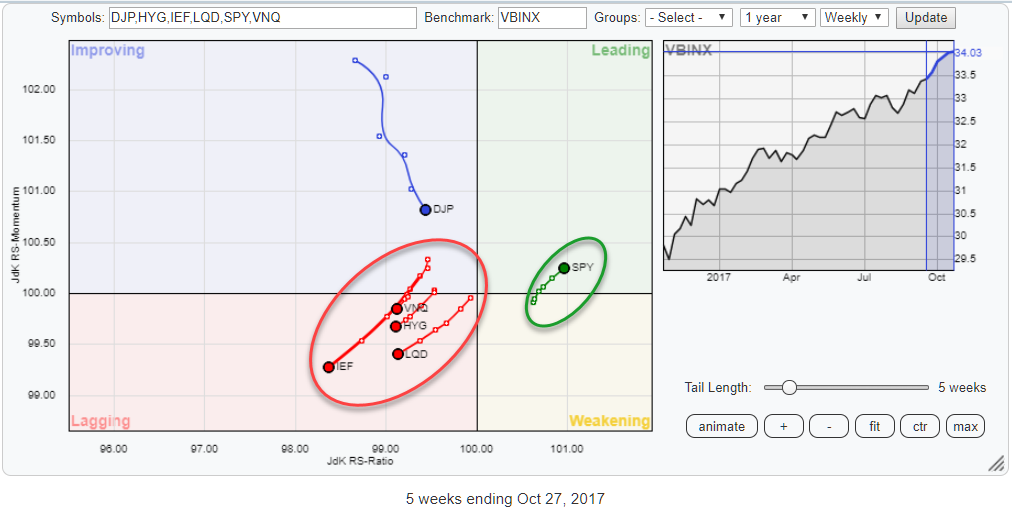
Once again, strong rotation for SPY vs other asset classes on RRG

by Julius de Kempenaer,
Senior Technical Analyst, StockCharts.com
The Relative Rotation Graph above holds six ETF that represent various asset classes.
The picture gives you the big picture of what is going on at asset class level on a relative basis against VBINX which is a Vanguard balanced index fund (60% equity / 40% bonds).
This one frame immediately...
READ MORE
MEMBERS ONLY
Watching Junk Bonds for Clues on Stocks - Two Bad Picks, Two Discount Brokers and Four Cyber Security Plays
by Arthur Hill,
Chief Technical Strategist, TrendInvestorPro.com
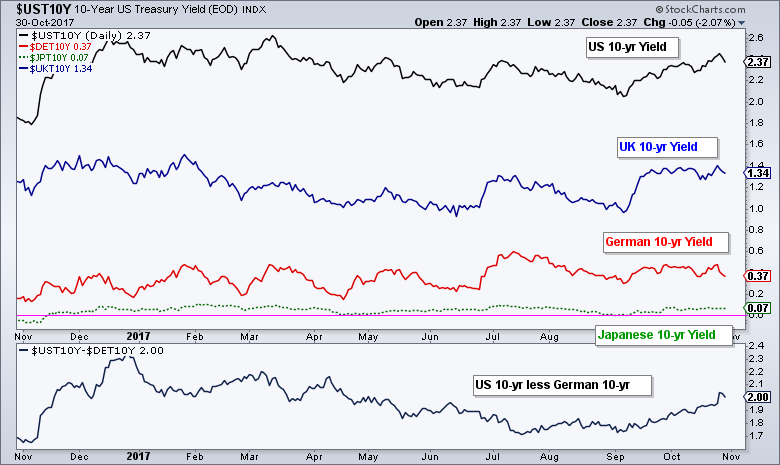
.... Comparing Global Treasury Yields
.... Watch Junk Bonds as a Leading Indicator
.... T-Mobile Fails to Hold Breakout
.... Merck Plunges to Potential Support
.... Two Discount Brokers with Bullish Charts
.... HACK and three Cyber Security Stocks ....
Today we will start with a view of global Treasury yields and show how the US remains...
READ MORE
MEMBERS ONLY
Small Caps And Healthcare Take Brunt Of Monday's Selling
by Tom Bowley,
Chief Market Strategist, EarningsBeats.com
Market Recap for Monday, October 30, 2017
Weakness permeated the U.S. stock market on Monday with the small cap Russell 2000 losing more than 17 points, or 1.15%. Other U.S. indices mostly followed suit, although the NASDAQ gave back very little from Friday's massive gains...
READ MORE
MEMBERS ONLY
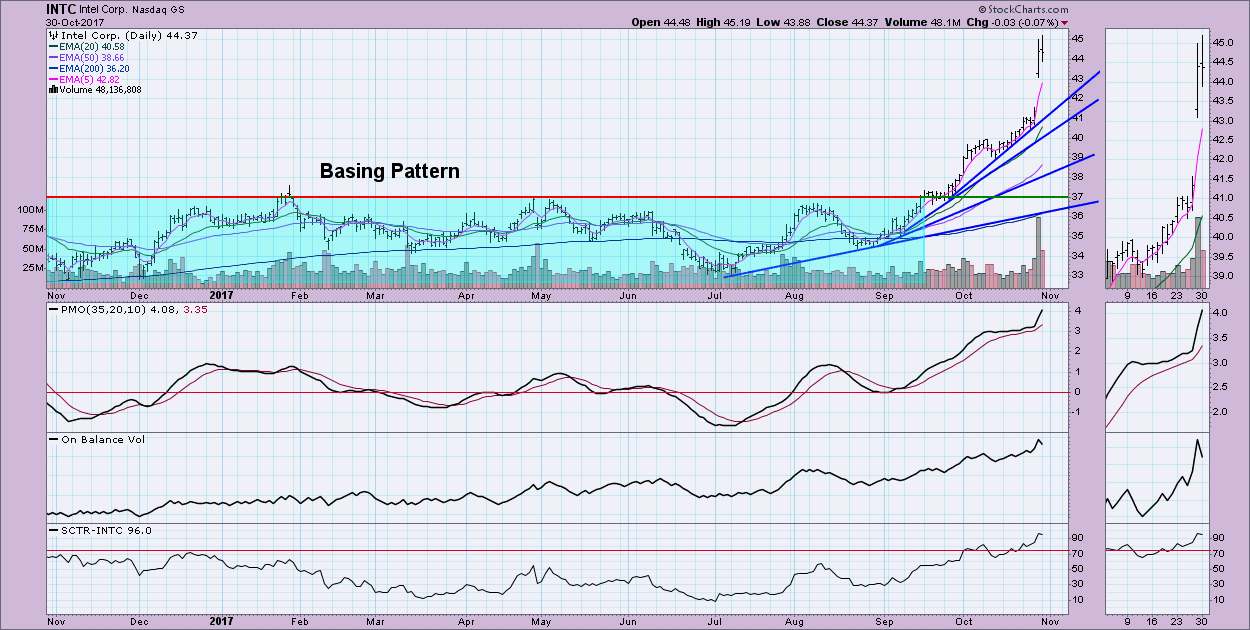
Beware of the Parabolic Price Move - Intel (INTC) Example
by Erin Swenlin,
Vice President, DecisionPoint.com
As I was preparing for today's MarketWatchers LIVE broadcast this morning, Tom asked me to take a look at a handful of large cap breakout charts. The one that jumped out at me was that of Intel Corp (INTC). The chart pattern is worrisome. The recent move from...
READ MORE
MEMBERS ONLY
BroadCom Gets a Squeeze and Makes a Move $BRCM
by Arthur Hill,
Chief Technical Strategist, TrendInvestorPro.com
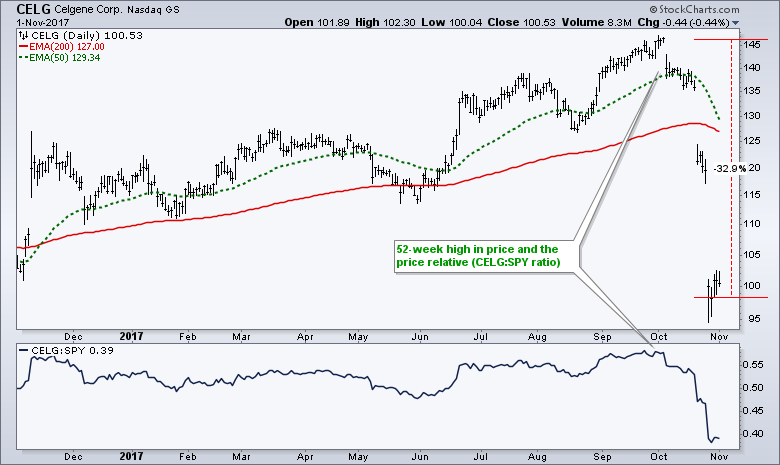
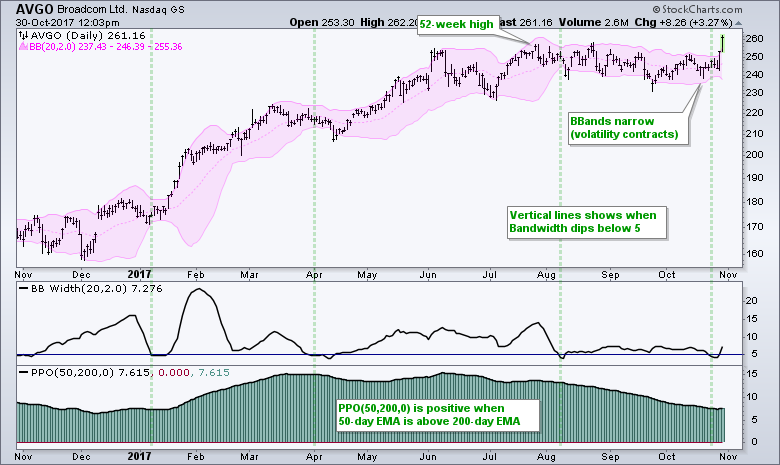
BroadCom looks set to continue its long-term uptrend with a breakout and fresh 52-week high. The chart shows BroadCom (AVGO) with Bollinger Bands, the Bandwidth indicator and the Percentage Price Oscillator (PPO). First, notice that the stock hit a 52-week high in July and the PPO(50,200,0) has...
READ MORE
MEMBERS ONLY
Seven Fresh Monday Setups As We Approach The Seasonally Bullish Month Of November
by Tom Bowley,
Chief Market Strategist, EarningsBeats.com
Special Note
Every Monday, I provide possible short-term trade setups (today's featured setup is reflected below in the Monday Setups section). All of these setups, along with setups from the past few weeks, can be accessed by CLICKING HERE. If you'd like to review these setups...
READ MORE
MEMBERS ONLY

NASDAQ Composite. Trick or Treat?

by Bruce Fraser,
Industry-leading "Wyckoffian"
Recently we studied the NASDAQ Composite ($COMPQ) as it appeared to be on the verge of jumping into an uptrend after building a Cause. Now the $COMPQ is within one box of the minimum PnF count of our prior study ‘$COMPQ Up Close’ (click here). We evaluated two trading counts...
READ MORE
MEMBERS ONLY
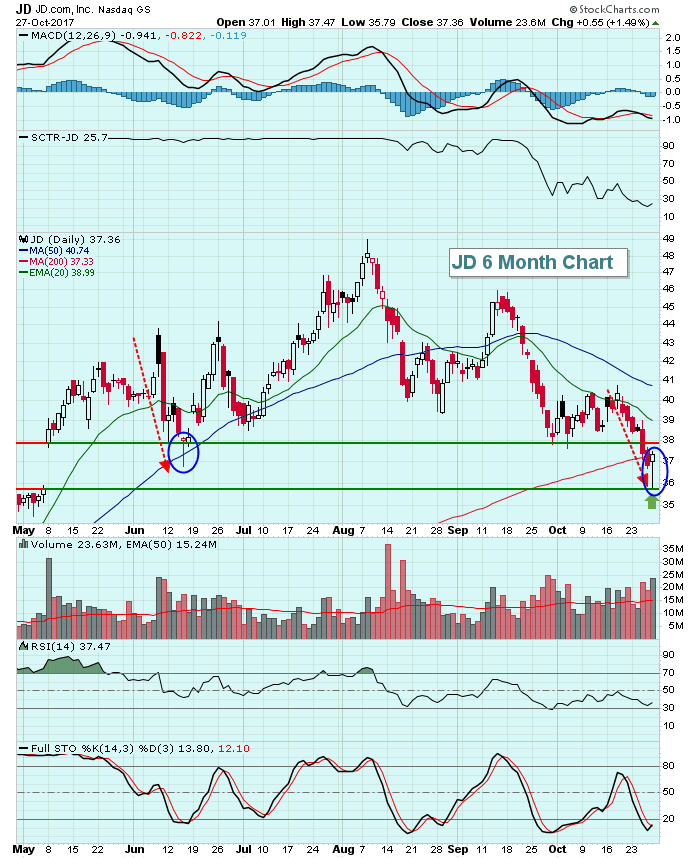
When A Hammer Meets Gap Support
by Tom Bowley,
Chief Market Strategist, EarningsBeats.com
I'm a big fan of candlesticks, particularly reversing candlesticks as they many times signal that a short-term downtrend has ended in an overall uptrending stock. One of my favorite trading strategies is to trade strong stocks off gap support. So what happens when both strategies meet? Well, JD....
READ MORE
MEMBERS ONLY

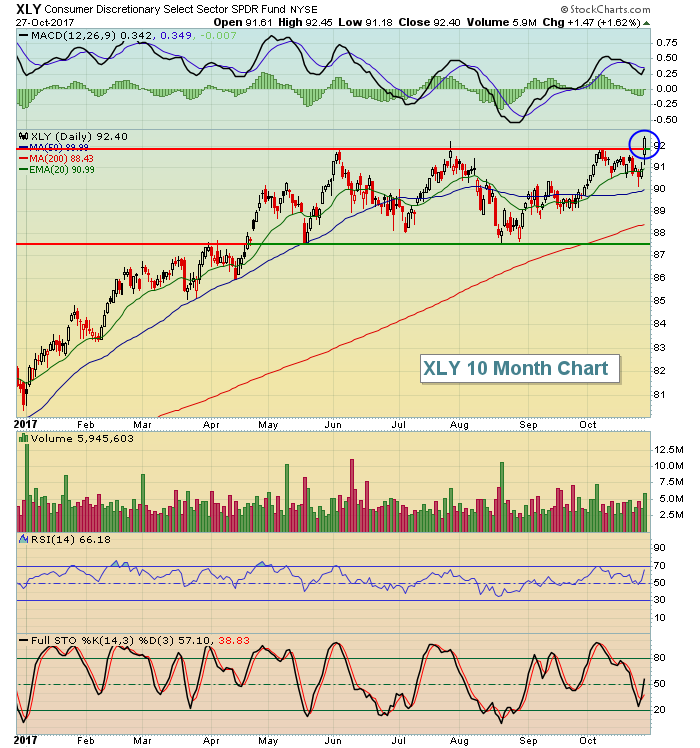
BIG GAINS IN AMAZON, INTEL, MICROSOFT, GOOGLE, AND FACEBOOK PUSH NASDAQ 100 TO NEW RECORD -- AMAZON'S 13% GAIN HELPS LEAD CONSUMER CYCLICALS TO UPSIDE BREAKOUT -- INTEL AND MICROSOFT LEAD TECHNOLOGY SECTOR HIGHER
by John Murphy,
Chief Technical Analyst, StockCharts.com
NASDAQ 100 GAPS TO NEW RECORD ON FRIDAY... It started after the market closed on Thursday when a raft of big internet and technology stocks reported huge earnings which pushed their stock prices higher in after-market trading. It continued on Friday when those stocks scored explosive gains on strong volume....
READ MORE
MEMBERS ONLY
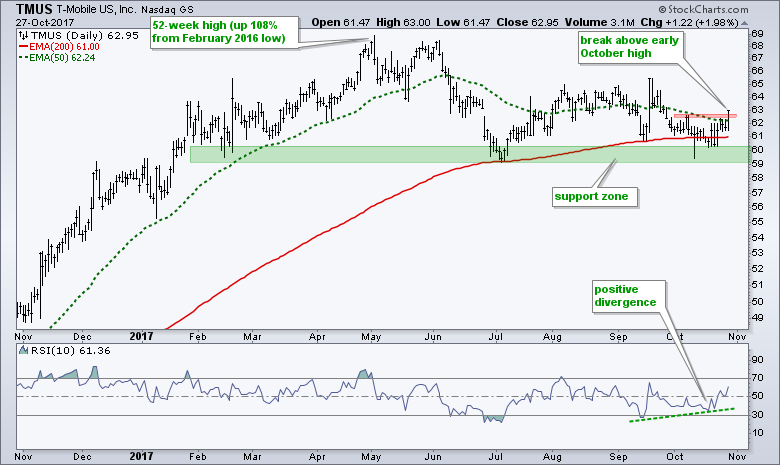
The Divergence is Just Icing on the Cake for T-Mobile $TMUS
by Arthur Hill,
Chief Technical Strategist, TrendInvestorPro.com
T-Mobile is showing signs of life with an upturn off support and a positive divergence in RSI. As always, lets review the bigger picture before trying to make sense of current conditions. TMUS basically doubled from February 2016 to April 2017 with a 108% advance. This massive advance gave way...
READ MORE
MEMBERS ONLY
DP Weekly Wrap: Another Blink Moment

by Carl Swenlin,
President and Founder, DecisionPoint.com
Last week there was a one-day decline that didn't actually last a whole day. On Wednesday this week there was a rather more robust decline, but it didn't last a full day either, and the market took back a good chunk of its losses by the...
READ MORE
MEMBERS ONLY
DP Bulletin: NDX Whipsaws Back to PMO BUY Signal
by Erin Swenlin,
Vice President, DecisionPoint.com
Just a quick headline! NDX whipsawed back into a PMO BUY signal after two days on a SELL. After today's brilliant move by the technology sector, the PMO was yanked back up above its signal line.
This was a beautiful breakout today with a gap up to form...
READ MORE
MEMBERS ONLY

Now Is the Time to Brush Up on Your Selling Disciplines

by Gatis Roze,
Author, "Tensile Trading"
We’ve all heard the cliche that “shutting the barn door after the horse has bolted” means one is late to action after the damage is done. Yes, it’s human nature not to dwell on negatives when the stock market ride since March, 2009 has been so exhilarating. Consider...
READ MORE
MEMBERS ONLY

Weekly Market Review & Outlook (w/ video) - Broad Sector Participation Supports the Bulls
by Arthur Hill,
Chief Technical Strategist, TrendInvestorPro.com
.... Amazon and Google Fool Billy Bear
.... SPY and QQQ Edge Lower after New Highs
.... QQQ Joins the Small-cap Dip
.... IJR Falls Back into Flag Pattern
.... 5 Sectors Hit New Highs - Tech Leads
.... XLB Jumps to Fresh High
.... XLF Breaks out of Flag
.... XLK and XLI Extend with New Highs...
READ MORE
MEMBERS ONLY
U.S. Markets Rebound; Tokyo's Nikkei Surges Above 22000
by Tom Bowley,
Chief Market Strategist, EarningsBeats.com
Market Recap for Thursday, October 26, 2017
U.S. indices spent Thursday attempting to bounce back from losses earlier in the week. Based on that goal, it was mostly a successful day as most major indices finished with fractional gains. The NASDAQ lagged, ending the session with a loss of...
READ MORE
MEMBERS ONLY
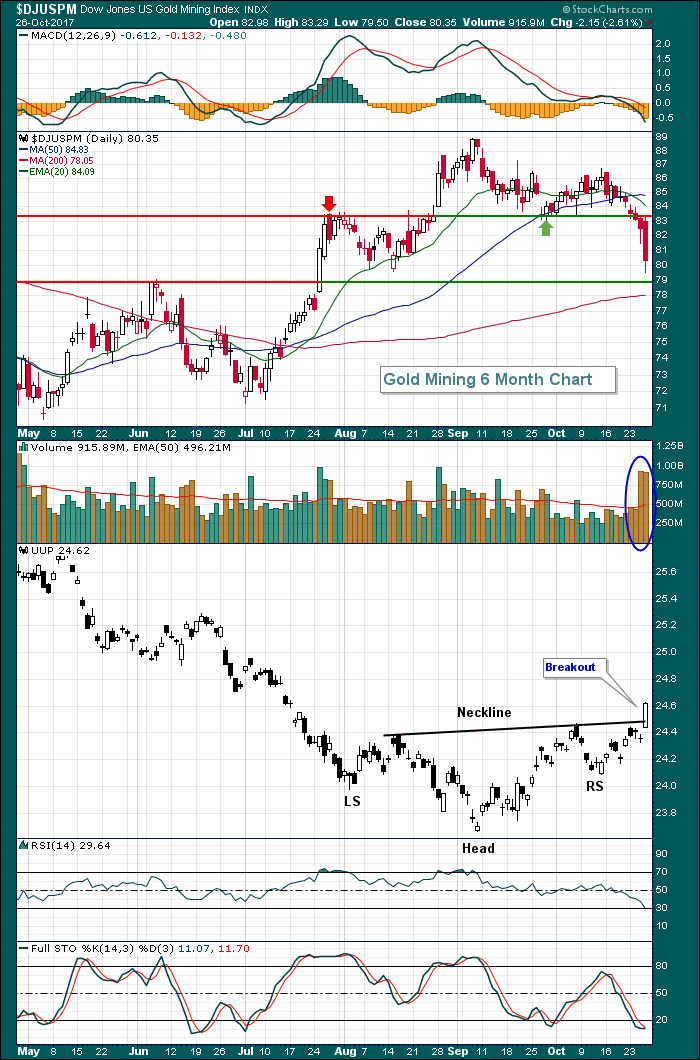
Gold Miners Lose Price Support On Heavy Volume
by Tom Bowley,
Chief Market Strategist, EarningsBeats.com
The Dow Jones U.S. Gold Mining Index ($DJUSPM) held price support on its late-September swoon, but that was not the case with the recent selling. The reason? It's probably the reverse head & shoulders breakout on the U.S. Dollar (UUP). A rising dollar normally sends gold...
READ MORE
MEMBERS ONLY
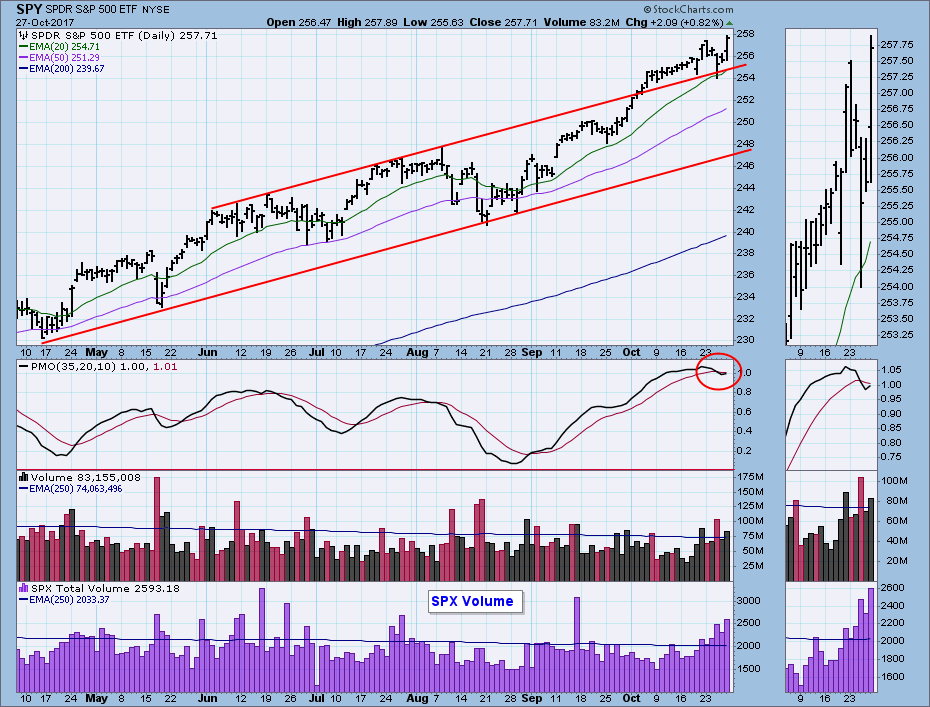
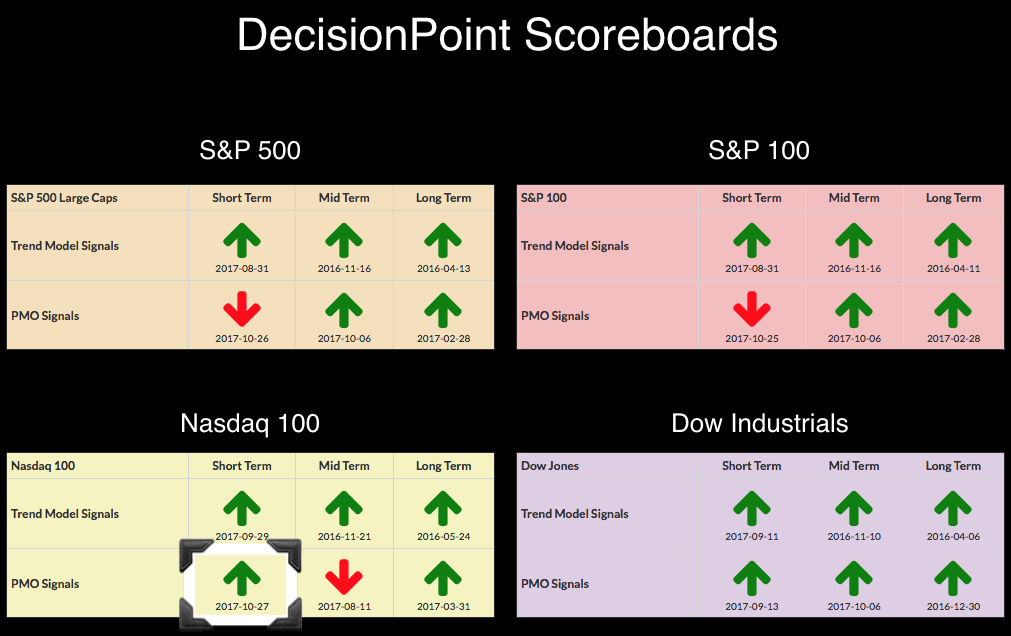
Momentum Failing on SPX - New PMO SELL Signal - Dow Holds PMO BUY Signal
by Erin Swenlin,
Vice President, DecisionPoint.com
I updated the DecisionPoint Scoreboards yet again today. Yesterday saw the new PMO SELL signals on the NDX and OEX and today the SPX has followed suit by generating its own PMO SELL signal. You'll note that "one of these things is not like the others"...
READ MORE
MEMBERS ONLY
Selling Engulfs Wall Street, S&P 500 Posts Largest Decline In Nearly Two Months
by Tom Bowley,
Chief Market Strategist, EarningsBeats.com
Market Recap for Wednesday, October 25, 2017
It's difficult to know what to expect after U.S. equities posted their largest decline since September 5th. I don't recall the last time we saw all nine sectors lower, but that's exactly what we saw on...
READ MORE
MEMBERS ONLY
Creating a ChartList of High-Octane Stocks
by Arthur Hill,
Chief Technical Strategist, TrendInvestorPro.com
.... Active Management Comes at a Cost
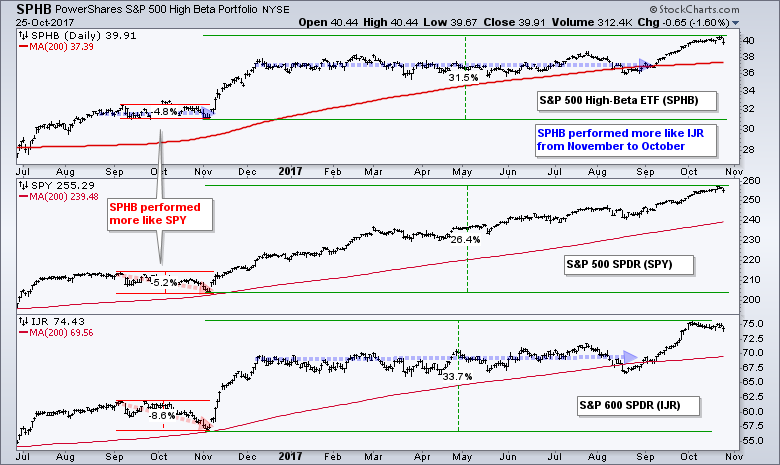
.... Add Some Beta with the S&P 500 High-Beta ETF
.... Get Serious Beta from the IBD 50 List
.... Creating a ChartList of the IBD 50 ....
Today I am going to step back and show how we can set up a ChartList to focus...
READ MORE
MEMBERS ONLY

Short-term Indicators Signaling Trouble Ahead?

by Martin Pring,
President, Pring Research
* Global short-term indicators start to go bearish near-term
* VIX and other US oscillators showing signs of vulnerability
Global short-term indicators start to go bearish near-term
A couple of weeks ago I suggested that several short-term indicators were hinting at a near-term downside or range bound correction. Usually, I put in...
READ MORE
MEMBERS ONLY

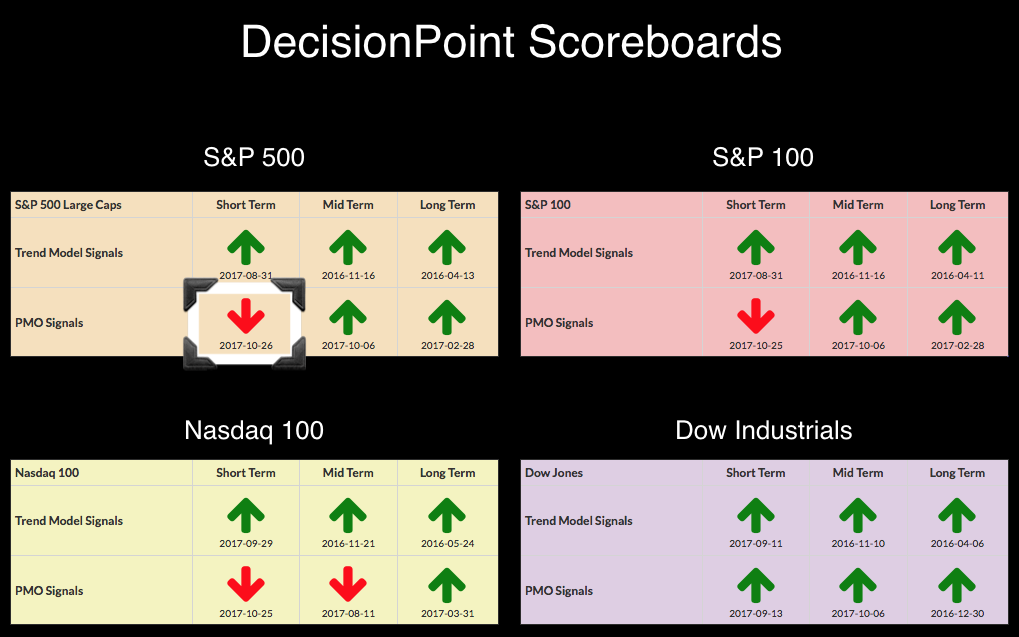
DP Alert: PMO SELL Signals on SPY, OEX and NDX - Climactic Indicators Suggest "Rally Pop"
by Erin Swenlin,
Vice President, DecisionPoint.com
Two important changes occurred on our DP Scoreboards today. The OEX and NDX both logged new PMO SELL signals as their PMOs crossed below their signal lines. I had expected the SPX to follow suit, but by an incredibly thin margin, its PMO BUY signal survived. The SPY wasn'...
READ MORE
MEMBERS ONLY

10-YEAR BOND YIELD HITS FIVE-MONTH HIGH -- UK AND GERMAN BOND YIELDS ALSO TURN UP -- 3% UK INFLATION INCREASES ODDS FOR RATE HIKE AND BOOSTS POUND -- ECB IS EXPECTED TO REDUCE BOND PURCHASES
by John Murphy,
Chief Technical Analyst, StockCharts.com
TEN-YEAR TREASURY YIELD REACHES SEVEN-MONTH HIGH ... Treasury bond yields are leading an upturn in global bond yields. Chart 1 shows the 10-Year Treasury Yield ($TNX) rising to the highest level since March. Part of the reason for the upside breakout in the TNX is that foreign yields are also rising....
READ MORE
MEMBERS ONLY
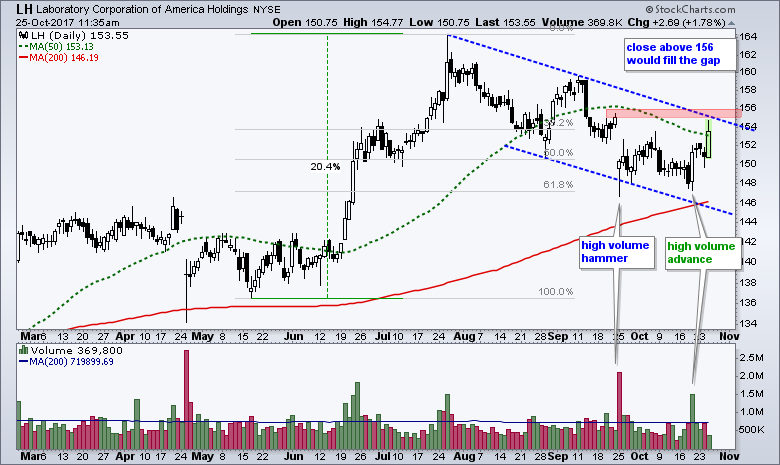
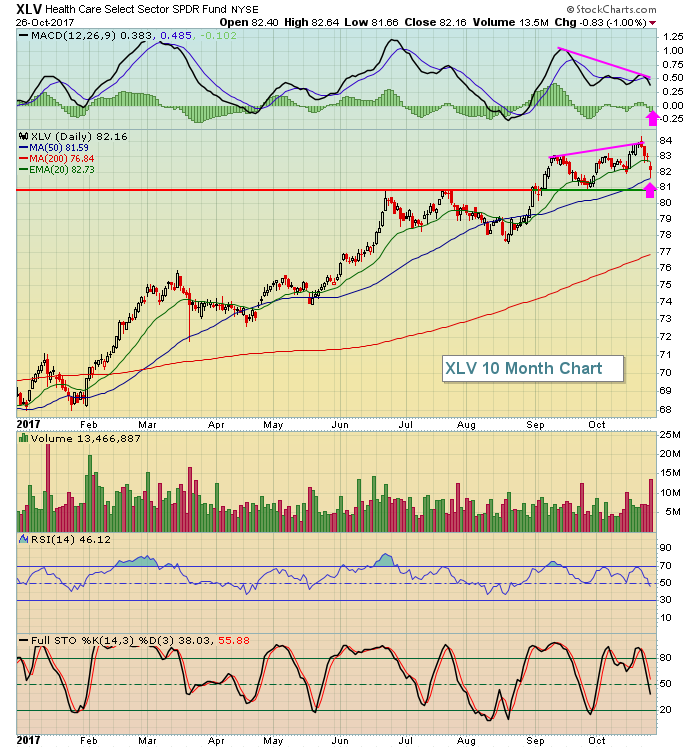
A Healthy Reaction to Earnings Reinforces Support in LH
by Arthur Hill,
Chief Technical Strategist, TrendInvestorPro.com
Laboratory Corporation of America (LH) reported earnings today and surged above the 50-day moving average on the results. The trend since late July remains down, but recent price action is constructive and a breakout could be in the offing. The stock surged around 20% and hit a 52-week high in...
READ MORE
MEMBERS ONLY
Narrow Advance Led By Dow Jones Components 3M And Caterpillar
by Tom Bowley,
Chief Market Strategist, EarningsBeats.com
Market Recap for Tuesday, October 24, 2017
The Dow Jones powered to another record high close on Tuesday, finishing the session higher by 167.80 points. Gains on the other major indices were much more modest as the Dow Jones pushed to record levels behind the strength of two components,...
READ MORE
MEMBERS ONLY
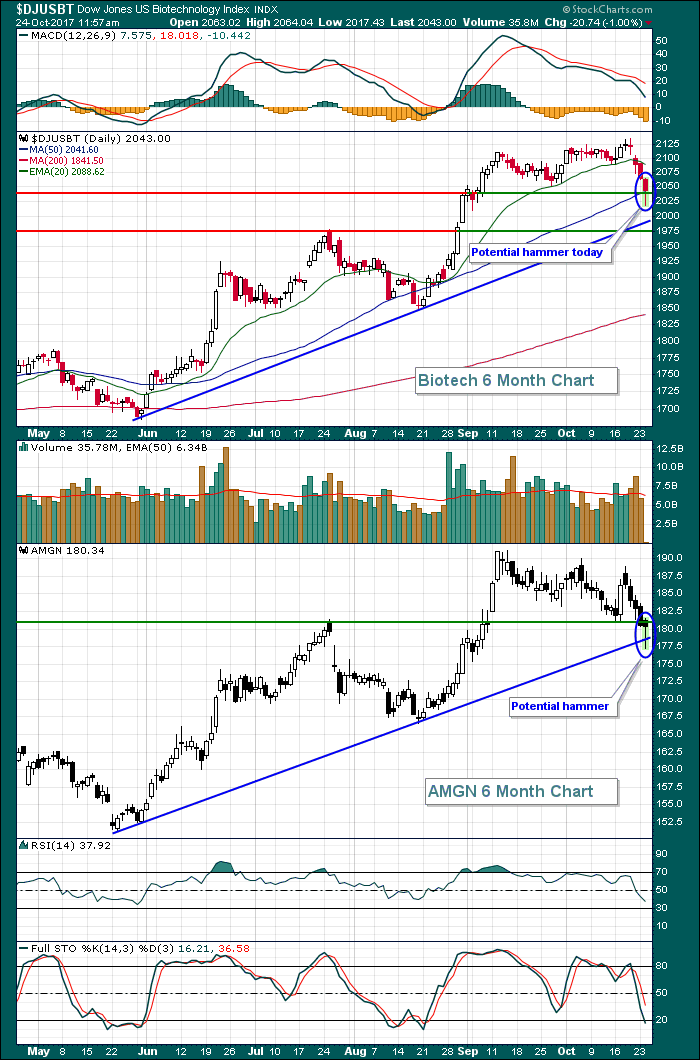
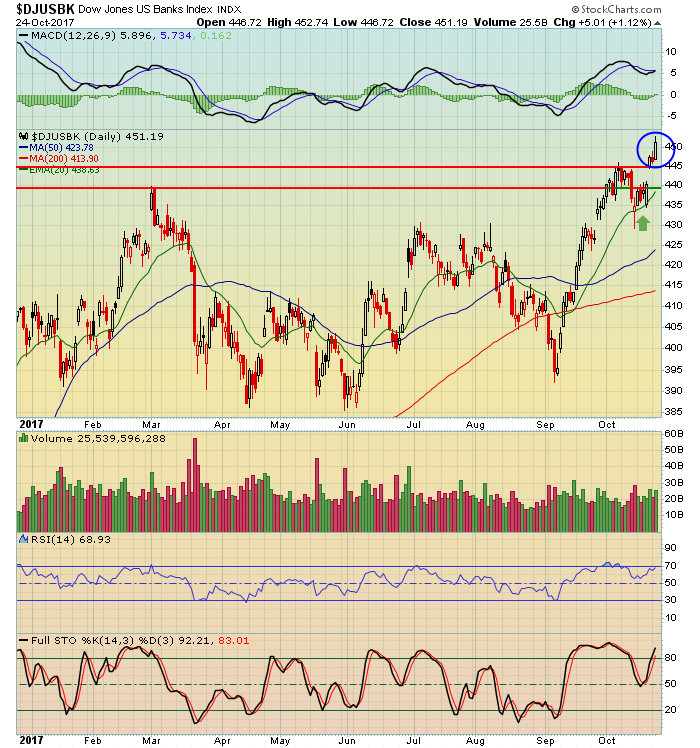
Biotechs Weak This Morning But Look To Be Reversing At Key Support
by Tom Bowley,
Chief Market Strategist, EarningsBeats.com
The Dow Jones U.S. Biotechnology Index ($DJUSBK) broke out of serious longer-term consolidation when it cleared 1800 price resistance in mid-June. Since then, we've seen a nice uptrend, characterized by rapid advances and steady pullbacks. The group lost nearly 120 points from Friday's intraday high...
READ MORE
MEMBERS ONLY
The S&P 500's Reversal On Monday Suggests It's Topped Near-Term
by Tom Bowley,
Chief Market Strategist, EarningsBeats.com
Market Recap for Monday, October 23, 2017
After early strength, Monday was a seller's market. As you might expect on one of the more bearish days of late, defensive sectors showed renewed relative strength with utilities (XLU, +0.05%) and consumer staples (XLP, -0.07%) the two top...
READ MORE
MEMBERS ONLY
Metals&Mining ETF Forms Small Continuation Pattern - A Selling Climax for Medical Device Maker - Old School Tech Leads
by Arthur Hill,
Chief Technical Strategist, TrendInvestorPro.com
.... Bonds, Gold and the Dollar
.... XME Holds Breakout with Bullish Pattern
.... Medtronic Hits Reversal Zone with Selling Climax
.... Old School Tech Stocks Take the Lead
.... Facebook and Amazon Stall
.... Uptrends in Alphabet and Apple Slow
.... Palo Alto Forms Bull Flag ....
The short-term uptrend in the Dollar and short-term downtrend in...
READ MORE
MEMBERS ONLY

Dollar Greening Up - IT Trend Model BUY Signal and Inverse H&S
by Erin Swenlin,
Vice President, DecisionPoint.com
On Friday, Gold minted a new IT Trend Model Neutral signal, so it isn't surprising to see the opposite occur for the Dollar. Looking at the chart of UUP, there are plenty of bullish characteristics. This new IT Trend Model BUY signal is a great confirmation of the...
READ MORE
MEMBERS ONLY
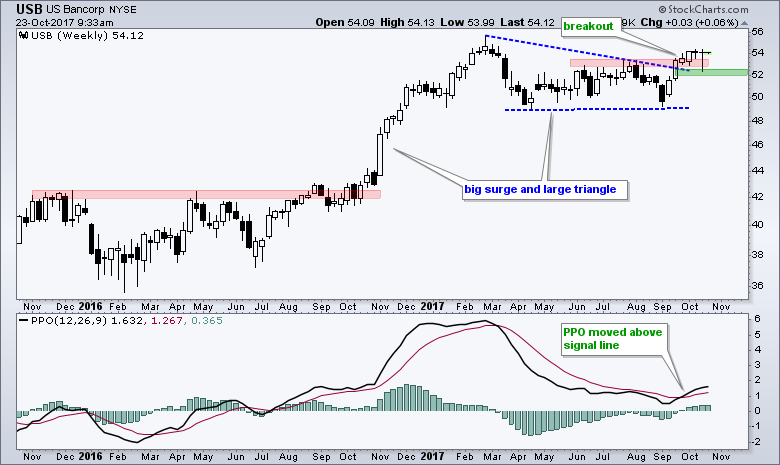
US Bancorp Breaks out of Long Consolidation
by Arthur Hill,
Chief Technical Strategist, TrendInvestorPro.com
US Bancorp (USB) ended a long corrective period with an upside breakout and this breakout is holding. Note that USB is part of the Financials SPDR (XLF) and the Regional Bank SPDR (KRE). These two are up double digits over the last six weeks and this puts has sector and...
READ MORE
MEMBERS ONLY
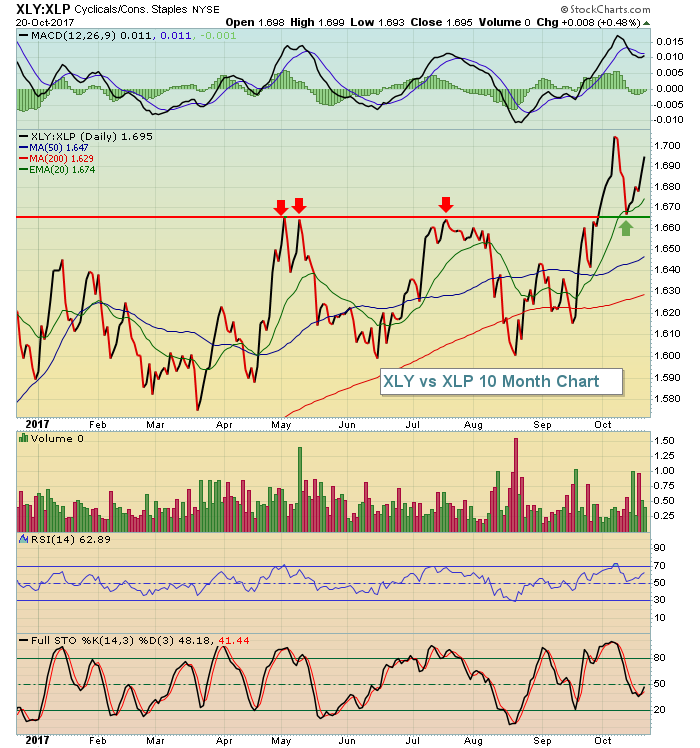
What Happens When A Raging Bull Market Meets Hurricane-Force Historical Headwinds?
by Tom Bowley,
Chief Market Strategist, EarningsBeats.com
Market Recap for Friday, October 20, 2017
Friday was a day of more all-time high closes. It's been quite redundant, but the bulls certainly don't mind. This time we saw leadership from aggressive areas of the market - a very bullish sign indeed. Financials (XLF, +1....
READ MORE
MEMBERS ONLY
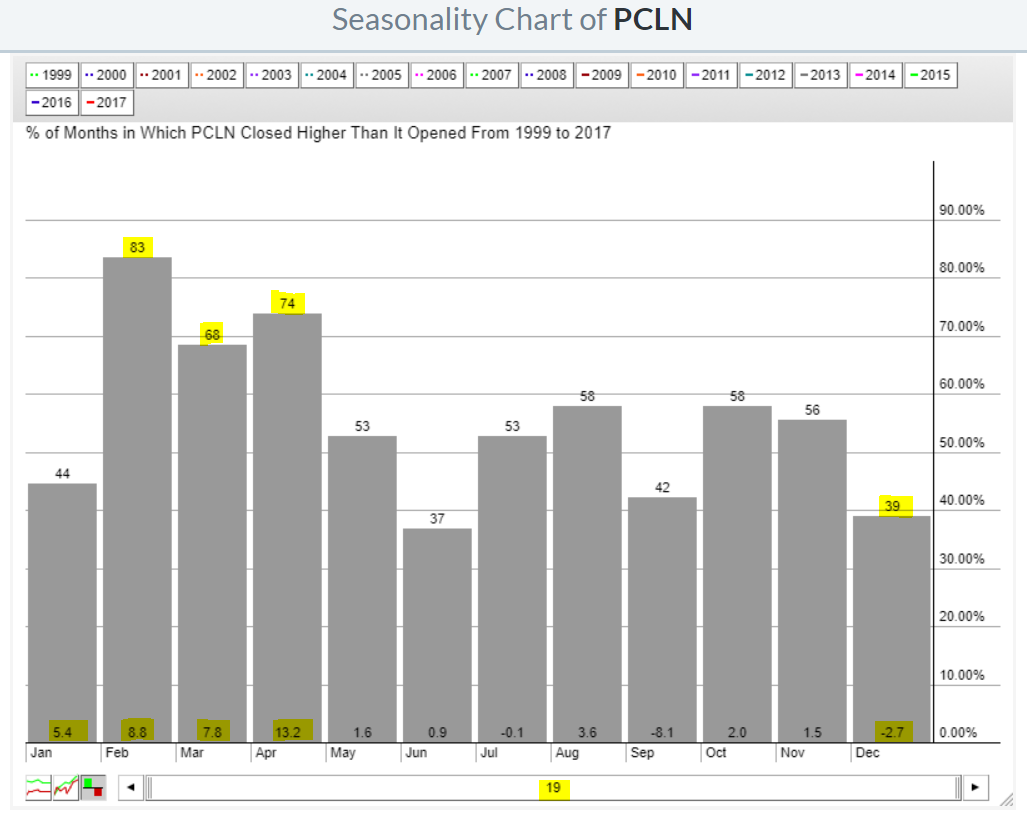
This Popular NASDAQ 100 Stock Has A Horrendous Track Record Through December
by Tom Bowley,
Chief Market Strategist, EarningsBeats.com
Let me start by stating that the NASDAQ 100 has earned 61.9% of its gains over the past 20 years during the fourth quarter. Yep, October through December has accounted for nearly two thirds of the gains on the NASDAQ 100. So you would think that most of its...
READ MORE