MEMBERS ONLY
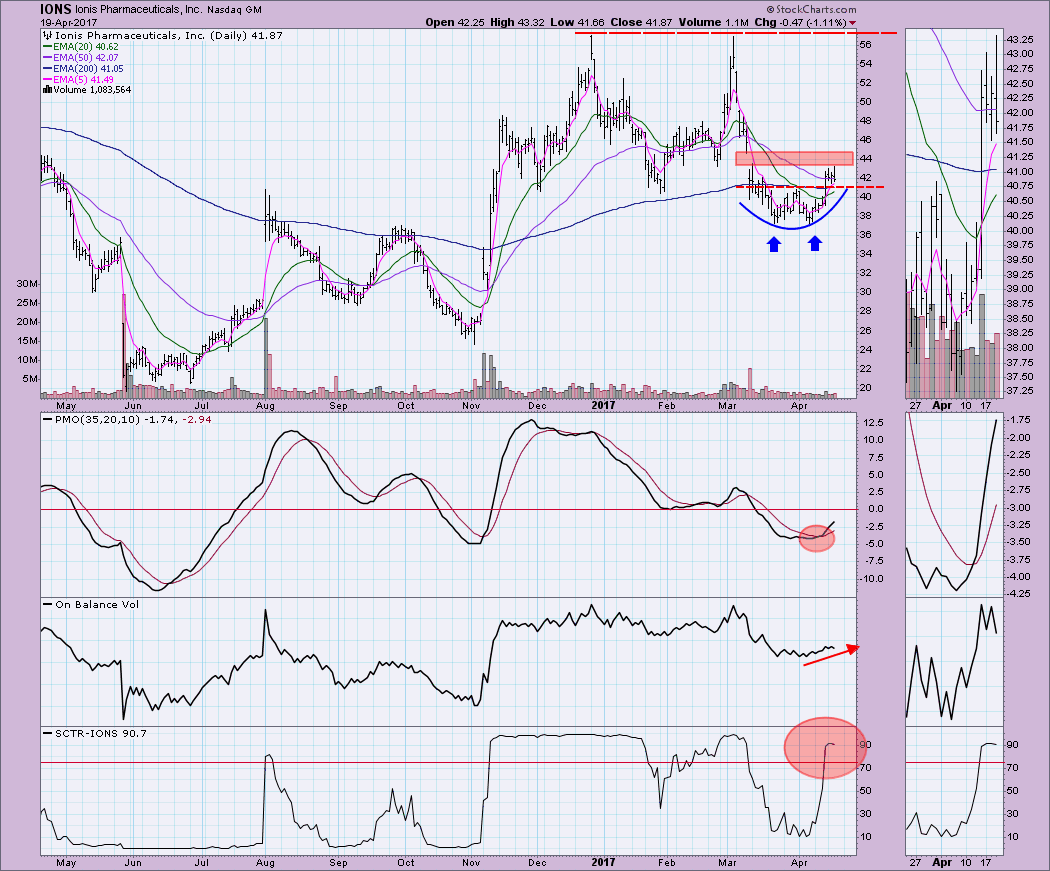
Ionis Pharmaceuticals (IONS) Shows Promise

by Erin Swenlin,
Vice President, DecisionPoint.com
During today's MarketWatchers LIVE show (12:00p - 1:30p EST MWF), Tom will review and annotate ten charts in ten minutes at ten minutes to one. We call it the "Ten in Ten to One". One of the first charts he reviewed was Ionis Pharmaceuticals...
READ MORE
MEMBERS ONLY

ENERGY SHARES LEAD MARKET LOWER AS CRUDE OIL DROPS TO TWO-WEEK LOW -- TWO ENERGY ETFS FALL TO NEW 2017 LOW -- DOW INDUSTRIALS CLOSE AT TWO-MONTH LOW -- S&P 500 REMAINS ON THE DEFENSIVE -- ON BALANCE VOLUME LOOKS WEAK

by John Murphy,
Chief Technical Analyst, StockCharts.com
CLIMB IN GASOLINE SUPPLIES HURTS CRUDE... A surprising jump in gasoline supplies caused heavy selling in the price of crude oil and gasoline. Chart 1 shows the United States Oil Fund (USO) falling nearly 4% today to the lowest level in two weeks. The USO also fell back below its...
READ MORE
MEMBERS ONLY
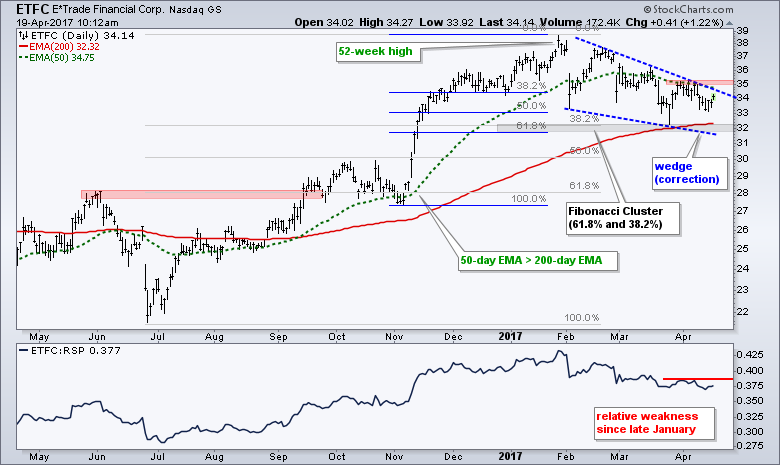
Etrade Corrects into Fibonacci Cluster

by Arthur Hill,
Chief Technical Strategist, TrendInvestorPro.com
It has been a rough year for small-caps because the Russell 2000 iShares is up just 1.34% year-to-date and severely trailing the S&P 500 SPDR, which is up around 5.5%. Chartists looking for clues of a small-cap revival may want to watch E-Trade Financial (ETFC) and...
READ MORE
MEMBERS ONLY
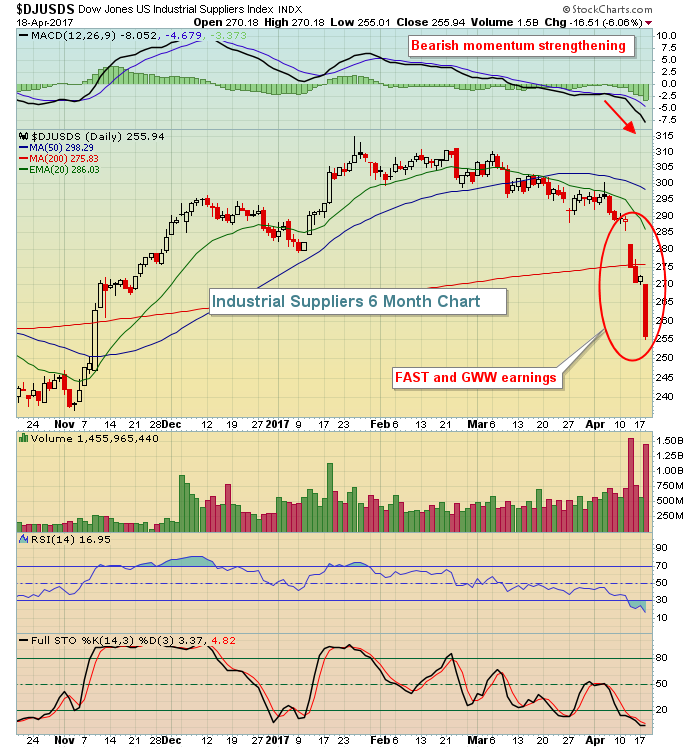
Industrial Suppliers Have Had A Rough Week

by Tom Bowley,
Chief Market Strategist, EarningsBeats.com
Market Recap for Tuesday, April 18, 2017
The Dow Jones U.S. Industrial Suppliers Index ($DJUSDS) tumbled more than 6% on Tuesday as the group absorbed its second earnings shock in the past week. W.W. Grainger (GWW) came up short of its earnings expectations, then lowered guidance and traders...
READ MORE
MEMBERS ONLY
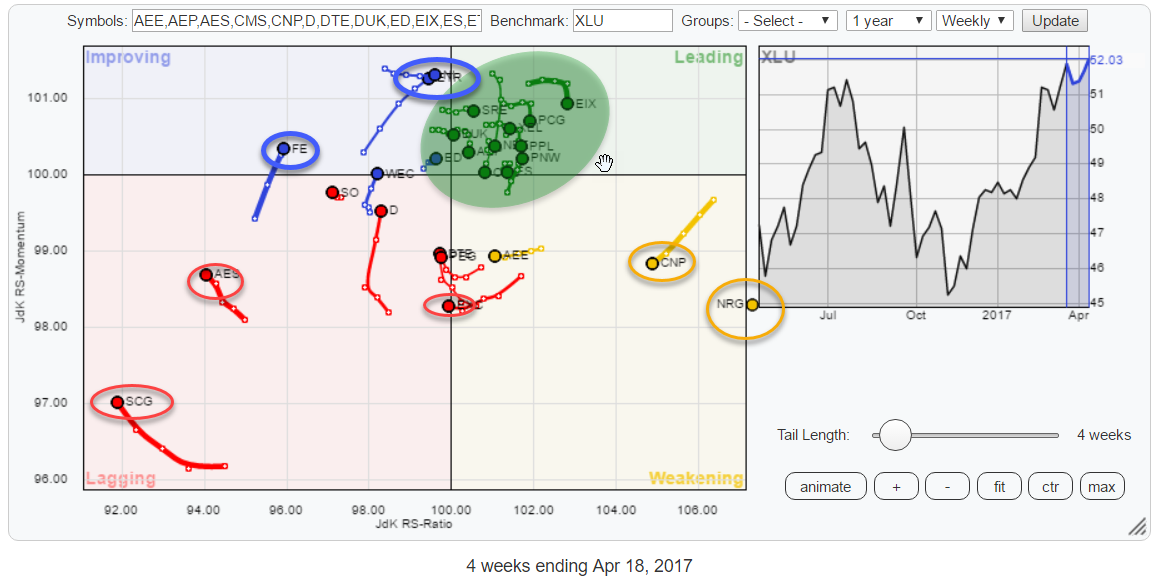
Utilities (XLU) moving into leading quadrant, what are the strongest (and the weakest) stocks for this sector?

by Julius de Kempenaer,
Senior Technical Analyst, StockCharts.com
The Relative Rotation Graph above holds the stocks that, together, make up the Utilities sector index (XLU).
The keen observer may notice that there is one stock, NRG, positioned in the "gutter" of the chart. This is done on purpose as NRG is so far out to the...
READ MORE
MEMBERS ONLY

DP Alert: Indicators Turn South - UUP New PMO SELL Signal
by Erin Swenlin,
Vice President, DecisionPoint.com
A look at the DecisionPoint Scoreboards reminds us that the short term is weak. Don't be fooled by the IT PMO BUY signals on the boards right now, I happen to know we have negative crossovers showing up on the weekly charts for three of these indexes. It&...
READ MORE
MEMBERS ONLY

The Big AAPL

by Bruce Fraser,
Industry-leading "Wyckoffian"
Wyckoffians are always on the search for Causes being built. A trend will end and a Cause will start. A Cause will end and a trend will start. The Wyckoff Method is centered around the interpretation of these conditions and the appropriate tactics. The Composite Operator (C.O.) is our...
READ MORE
MEMBERS ONLY
Financials And Transports Lead U.S. Rally
by Tom Bowley,
Chief Market Strategist, EarningsBeats.com
Market Recap for Monday, April 17, 2017
If you're in the bullish camp, you have to be breathing a sigh of relief following yesterday's action. It was only one day, but after the bulls' grip on the market really seemed to be slipping at the...
READ MORE
MEMBERS ONLY
Conflicting Bollinger Band Signals for SPY and QQQ - Stocks to Watch
by Arthur Hill,
Chief Technical Strategist, TrendInvestorPro.com
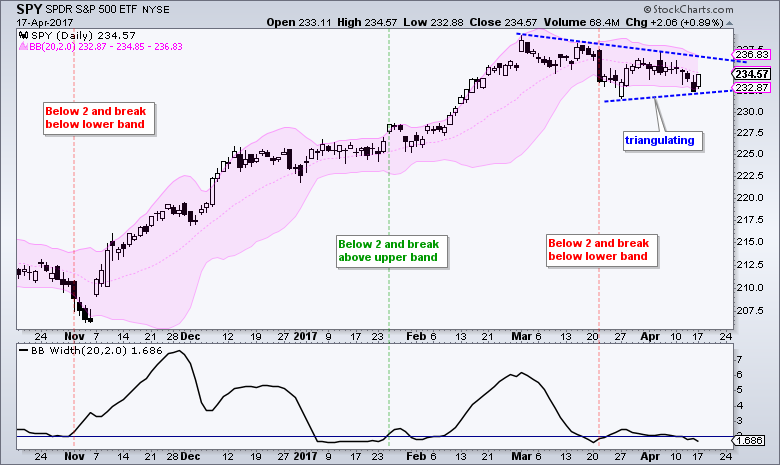
.... SPY Remains with Bearish Bollinger Band Signal
.... QQQ Counters with Bullish Band Signal
.... GOOGL Springs to Life - Plus FB, AMZN, AAPL, MSFT
.... A Year of Frustration for IJR
.... Airlines Remain Strong Overall
.... Stocks: CTRL, FEYE, SQ, TDC, MDT and MRK ....
The major stock indices are downright boring right now...
READ MORE
MEMBERS ONLY
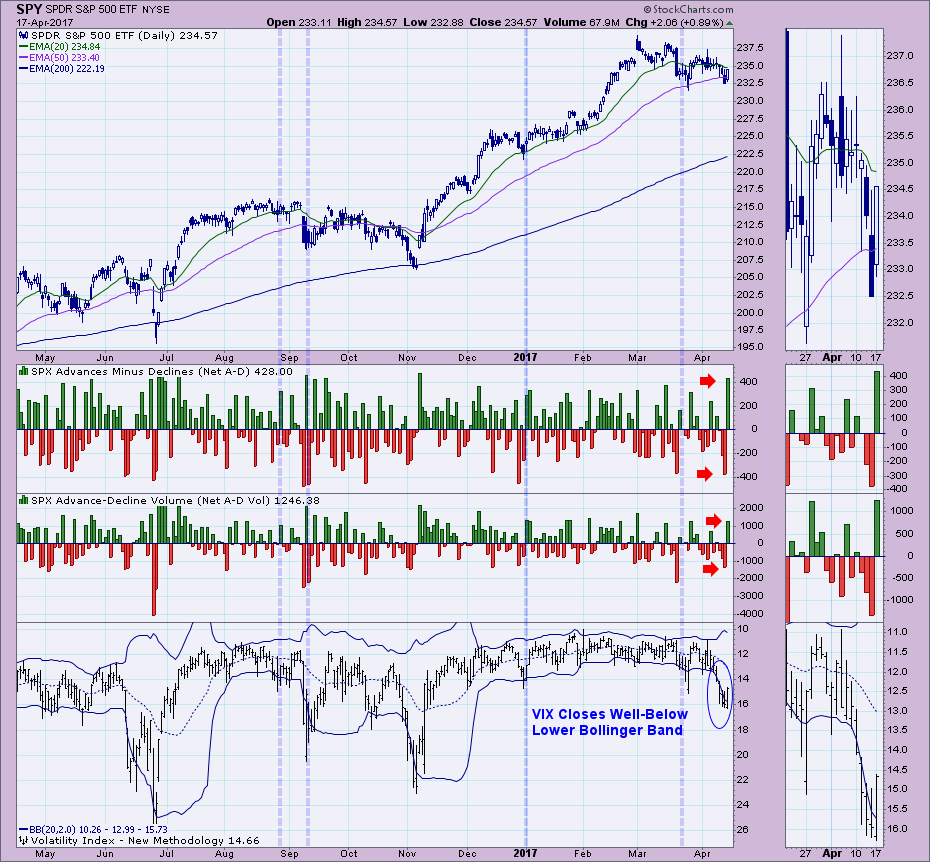
Possible Selling Exhaustion Lining Up on Breadth and VIX Indicators
by Erin Swenlin,
Vice President, DecisionPoint.com
Tom Bowley and I host the MarketWatchers LIVE webcast M/W/F 12:00p - 1:30p EST. During Monday's second market update, I like to review the DecisionPoint indicators to look at indicator expectations for the week. The chart that really stood out to me was the...
READ MORE
MEMBERS ONLY
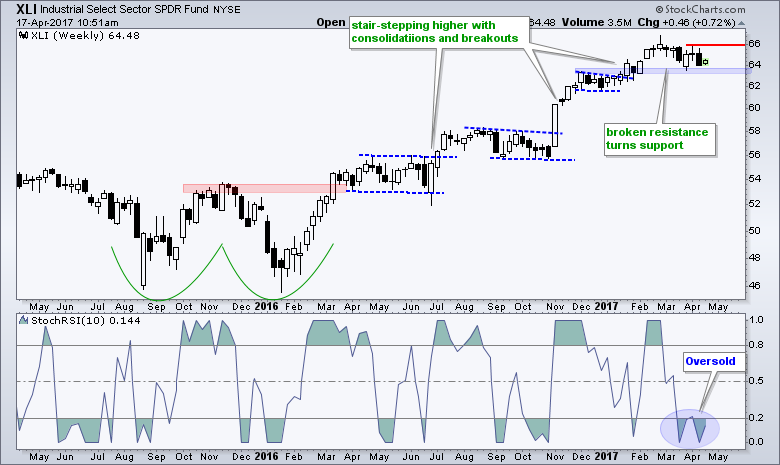
Industrials SPDR Becomes Oversold and Finds Support
by Arthur Hill,
Chief Technical Strategist, TrendInvestorPro.com
The Industrials SPDR (XLI) is at an interesting juncture because the long-term trend is up and it is testing the January breakout. After hitting a 52-week high in February, the ETF fell back to the breakout zone in the 63.50 area and firmed with a long white candlestick four...
READ MORE
MEMBERS ONLY
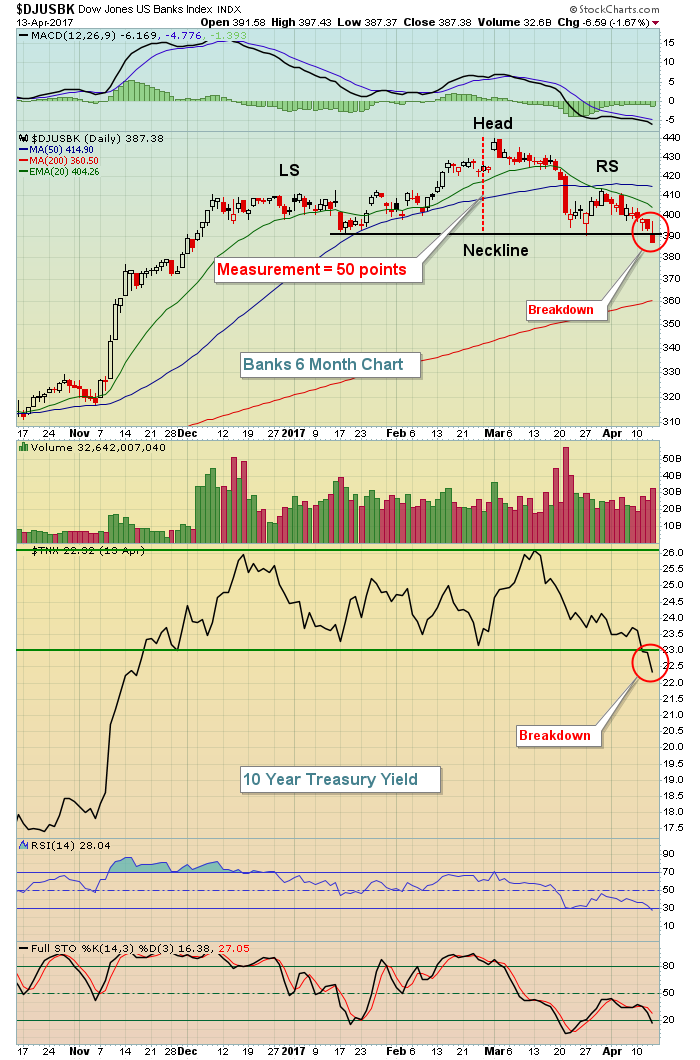
10 Year Treasury Breaks Down, Signals Potential Economic Weakness Ahead
by Tom Bowley,
Chief Market Strategist, EarningsBeats.com
Market Recap for Thursday, April 13, 2017
The big news on Thursday - at least technically - was the breakdown in the 10 year treasury yield ($TNX) to its lowest close since early November. Most traders have been expecting continuing economic strength based on wisdom from the Federal Reserve. However,...
READ MORE
MEMBERS ONLY

Filtering the Noise II

by Greg Morris,
Veteran Technical Analyst, Investor, and Author
The first article of Filtering the Noise dealt with smoothing the data with moving averages. Here I want to discuss a really popular concept popularized by an indicator called Moving Average Convergence Divergence or MACD. MACD is a concept using two exponential averages developed by Gerald Appel. It was originally...
READ MORE
MEMBERS ONLY

Bull Market Correction Looks Likely To Continue

by Martin Pring,
President, Pring Research
* Recent technical deterioration
* Bonds and the recent false upside breakout
* Gold’s false breakout also turned out to be “false”
The long-term indicators for the equity market continue to look positive, as the major averages are comfortably above their key moving averages. Pretty well all measures of long-term smoothed momentum...
READ MORE
MEMBERS ONLY
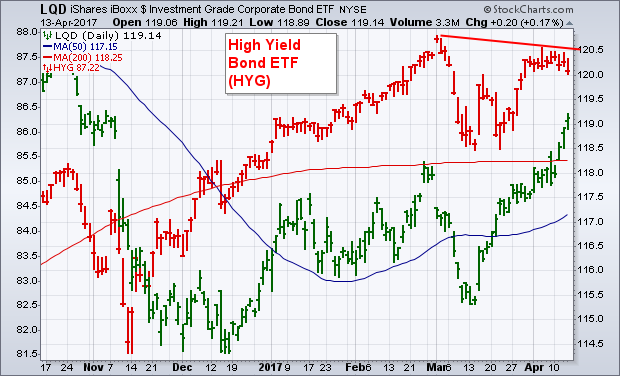
Investment Grade Corporates Outperform Junk Bonds
by John Murphy,
Chief Technical Analyst, StockCharts.com
The green bars in the chart below show the iBoxx Investment Grade Corporate Bond iShares (LQD) trading at a new five-month high after clearing its 200-day average. The red bars, however, show the iBoxx High Yield Corporate Bond iShares (HYG) backing off from its early March high. The fact that...
READ MORE
MEMBERS ONLY

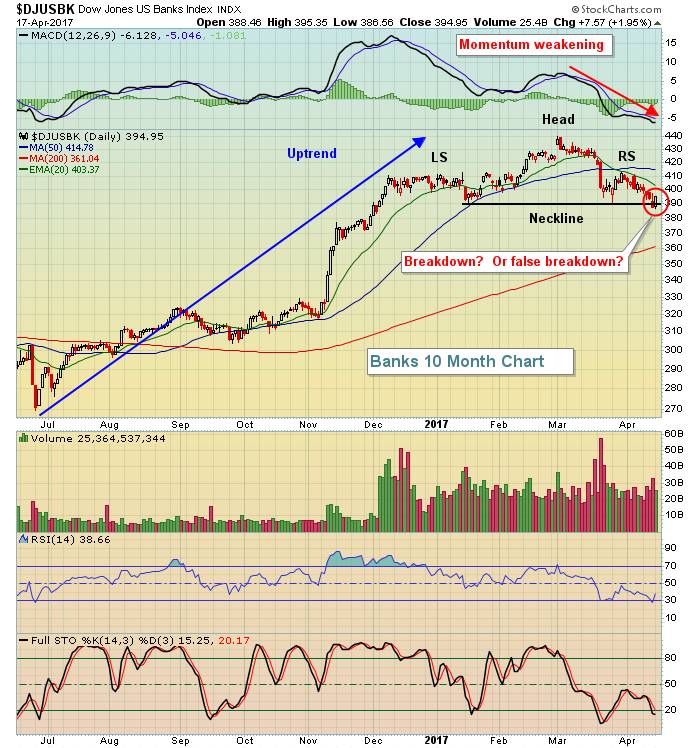
Bank Profits Soar But Bank Stocks Sour
by Tom Bowley,
Chief Market Strategist, EarningsBeats.com
At the time of the last ChartWatchers article, I didn't really see a whole lot to be nervous about. However, the bullish picture certainly is getting a bit murkier based on developments since then. After a very strong ADP employment report on April 5th, most everyone was expecting...
READ MORE
MEMBERS ONLY
Earnings Take Center Stage

by John Hopkins,
President and Co-founder, EarningsBeats.com
It's that time of the year, a time when all attention is turned to the bottom line of corporate America. It happens every quarter and it always has a major impact on the direction of the market. And the bottom line almost always trumps everything else.
Of course...
READ MORE
MEMBERS ONLY

How to Track ETF Tracking Errors - Examples for USO and GLD
by Arthur Hill,
Chief Technical Strategist, TrendInvestorPro.com
Most of us are aware of the tracking error between oil and the US Oil Fund. There is indeed a tracking error, but a few charts reveal that this tracking error is subject to fluctuations and can even remain stable for extended periods. Today I will show how to measure...
READ MORE
MEMBERS ONLY
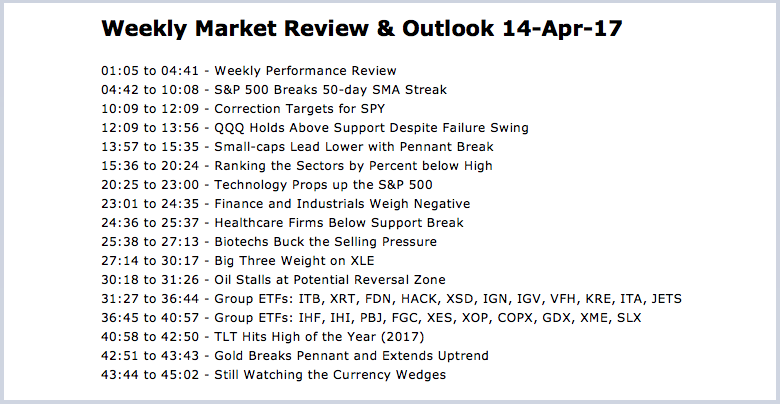
Weekly Market Review & Outlook - Correction Extends but Sectors Remain Mixed (with Video)
by Arthur Hill,
Chief Technical Strategist, TrendInvestorPro.com
----- Video Link ----- Art's Charts ChartList (updated 14-Apr) -----
Note that the Art's Charts ChartList has been updated with 30 annotated charts covering the industry group ETFs. Not all of these charts are covered in the written commentary. See the video timeline (above) for details....
READ MORE
MEMBERS ONLY
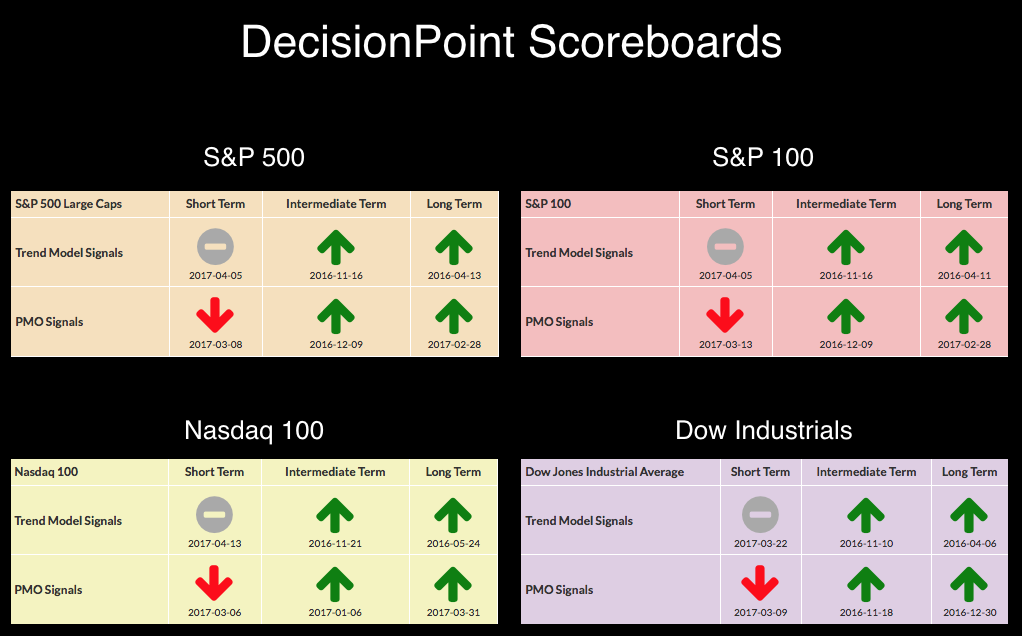
Scoreboard Weekly PMO SELL Signals Approaching Fast!
by Erin Swenlin,
Vice President, DecisionPoint.com
One look at the DP Scoreboards and it is apparent there are problems in the short term. It appears that the intermediate term is sitting comfortably on BUY signals. That is true for the IT Trend Models (20/50-EMA crossover signals on daily chart), but momentum had already starting waining...
READ MORE
MEMBERS ONLY

How I Deal With Investment Losses (And How Not To)

by Gatis Roze,
Author, "Tensile Trading"
Financial investment losses are the markets’ way of telling you to make adjustments and to correct your present course of action. The parallels between how American investors deal with financial pain and how individuals deal with physical pain is illuminating.
According to a recent article in Consumer Reports, 80% of...
READ MORE
MEMBERS ONLY
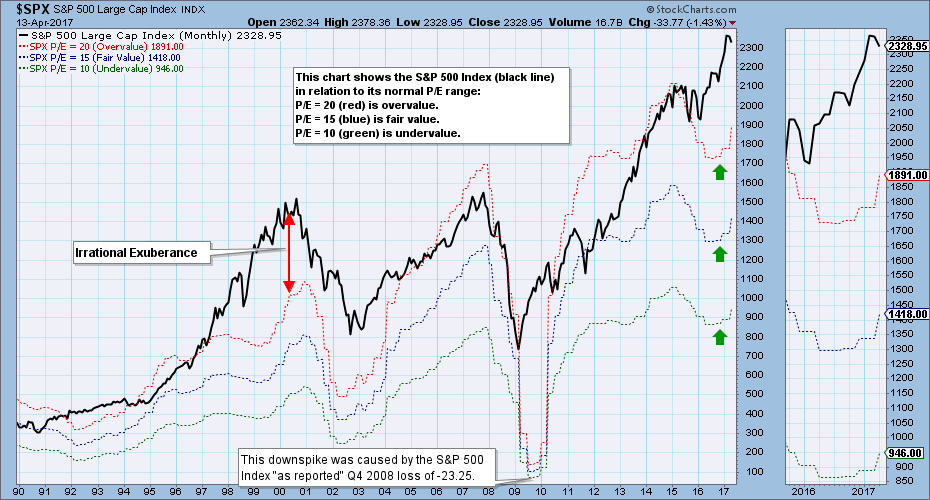
DecisionPoint Weekly Wrap 4/13/2017 -- Market Overvalued

by Carl Swenlin,
President and Founder, DecisionPoint.com
S&P 500 earnings results for 2016 Q4 are in, and the market is still grossly overvalued. The chart below shows the S&P 500 Index (black line) in relation to where it would be if it were undervalued (green line), fair value (blue line), or overvalued (red...
READ MORE
MEMBERS ONLY

BOND YIELD FALLS TO FIVE MONTH LOW -- RELATIVE WEAKNESS IN HIGH YIELD BONDS IS BAD FOR STOCKS -- FINANCIALS AND SMALL CAPS LEAD MARKET LOWER -- S&P 500 CLOSES BELOW 50-DAY AVERAGE -- SAFE HAVEN BUYING PUSHES GOLD TO FIVE MONTH HIGH
by John Murphy,
Chief Technical Analyst, StockCharts.com
10-YEAR TREASURY YIELD FALLS TO FIVE-MONTH LOW... Bond yields have been slipping since March as investors have had second thoughts about the so-called Trump bump in stocks and the economy. Geopolitical concerns may also be causing profit-taking in stocks and buying of safe havens like bonds and gold. That risk-off...
READ MORE
MEMBERS ONLY
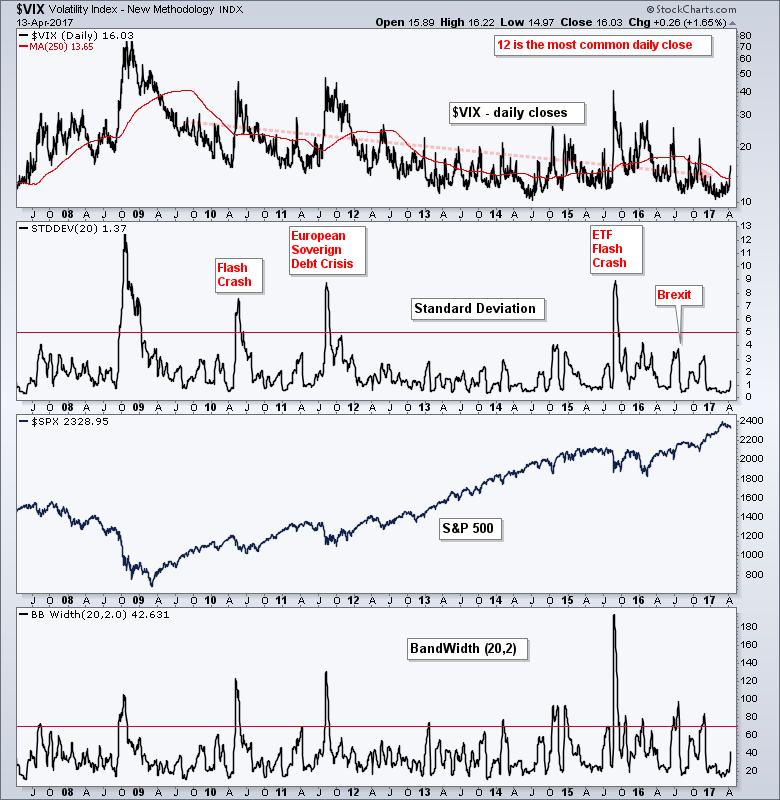
Measuring VIX Contractions and Expansions - Charting the Fear and Greed Index
by Arthur Hill,
Chief Technical Strategist, TrendInvestorPro.com
.... Applying Standard Deviation and BandWidth to the VIX
.... Trade XIV Instead of SPY
.... Combining Technicals and Fundamentals
.... Monthly MACD for Long-term Trend
.... Charting the Fear & Greed Index
.... Machines Dominate the Bond Market ....
I will post the Weekly Market Review & Outlook on Friday with a video. Instead of the...
READ MORE
MEMBERS ONLY
10 Year Treasury Yield Closes At Lowest Level Since November
by Tom Bowley,
Chief Market Strategist, EarningsBeats.com
Market Recap for Wednesday, April 13, 2017
It was another day of not-so-great action in the U.S. stock market on Wednesday as our major indices finished lower as this lengthy period of frustrating consolidation continues. A problem is definitely brewing, though, as the Volatility Index ($VIX) pushes higher and...
READ MORE
MEMBERS ONLY
New Long-Term Trend Model BUY Signal for Gold
by Erin Swenlin,
Vice President, DecisionPoint.com
A new Long-Term Trend Model signal triggered on Gold today. This occurs when the 50-EMA crosses above the 200-EMA. When this happens, DecisionPoint theory is that any stock, ETF, index, etc. with a 50-EMA above the 200-EMA is in a technical bull market. What does this mean? If you are...
READ MORE
MEMBERS ONLY
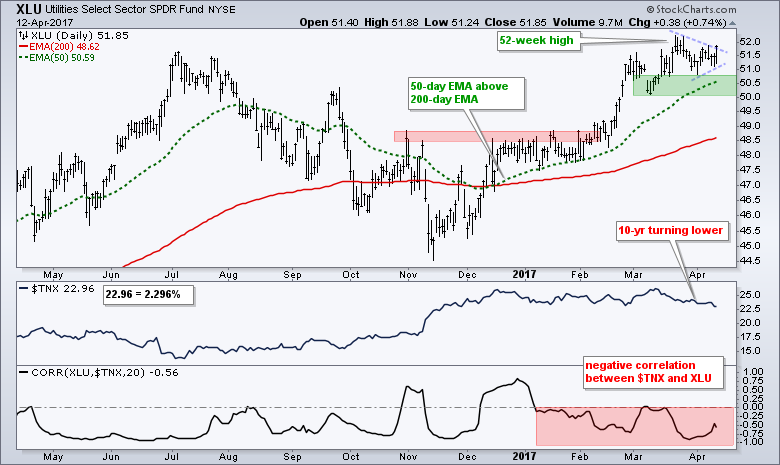
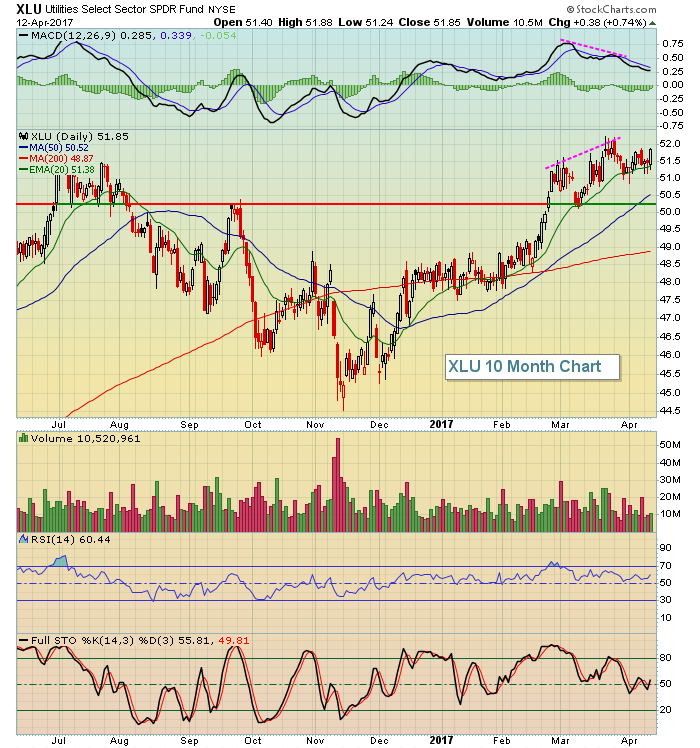
Utilities Surge as 10-yr T-Yield Drops below 2.3%
by Arthur Hill,
Chief Technical Strategist, TrendInvestorPro.com
The Utilities SPDR (XLU) surged as the S&P 500 fell below its 50-day SMA on Wednesday. Overall, notice that the 50-day EMA crossed the 200-day EMA in mid December and the ETF hit a 52-week high in late March. XLU is the strongest of the nine sectors since...
READ MORE
MEMBERS ONLY

DOW AND S&P 500 ARE THREATENING THEIR 50-DAY AVERAGES -- TECHNOLGY SELLING WEAKENS THE NASDAQ -- FINANCIALS AND TRANPORTS CONTINUE TO UNDERPERFORM -- VIX HITS FIVE-MONTH HIGH
by John Murphy,
Chief Technical Analyst, StockCharts.com
DOW AND S&P 500 MAY BE SLIPPING BELOW 50-DAY LINES... The short-term trend for the market continues to weaken. Chart 1 shows the Dow Jones Industrial SPDR (DIA) trading below its 50-day average in early afternoon trading. The DIA hasn't closed below that support line since...
READ MORE
MEMBERS ONLY
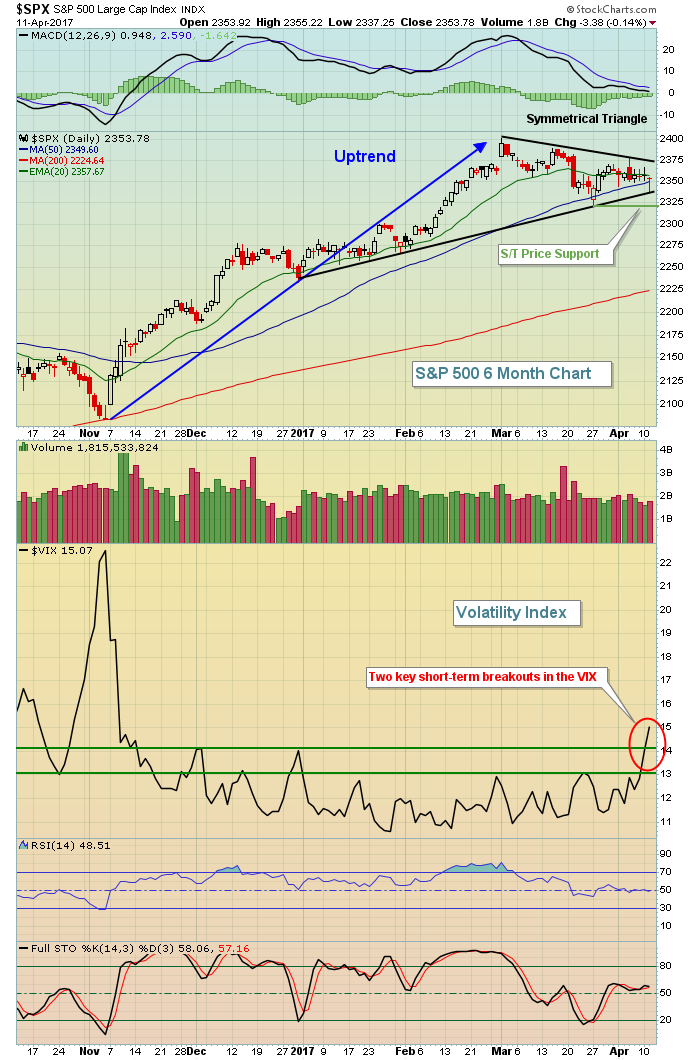
Fear Is Rising As Gold Breaks Out
by Tom Bowley,
Chief Market Strategist, EarningsBeats.com
Market Recap for Tuesday, April 11, 2017
The Volatility Index ($VIX) hit its lowest level since mid-November on Tuesday, nearly reaching 16 before backing off and closing at 15.07 and up 7.26% on the session. That development is significant because the S&P 500 has remained above...
READ MORE
MEMBERS ONLY
DP Alert: Volume Indicators Mixed - SPY Finds Support...For Now - ITTM Neutral Signal on RYF
by Erin Swenlin,
Vice President, DecisionPoint.com
No changes on the DecisionPoint Scoreboards. You'll find these boards in the DP Chart Gallery. However, we did get a new Intermediate-Term Trend Model (ITTM) Neutral signal on the equal-weight Financials ETF (RYF).
The purpose of the DecisionPoint Alert Daily Update is to quickly review the day'...
READ MORE
MEMBERS ONLY
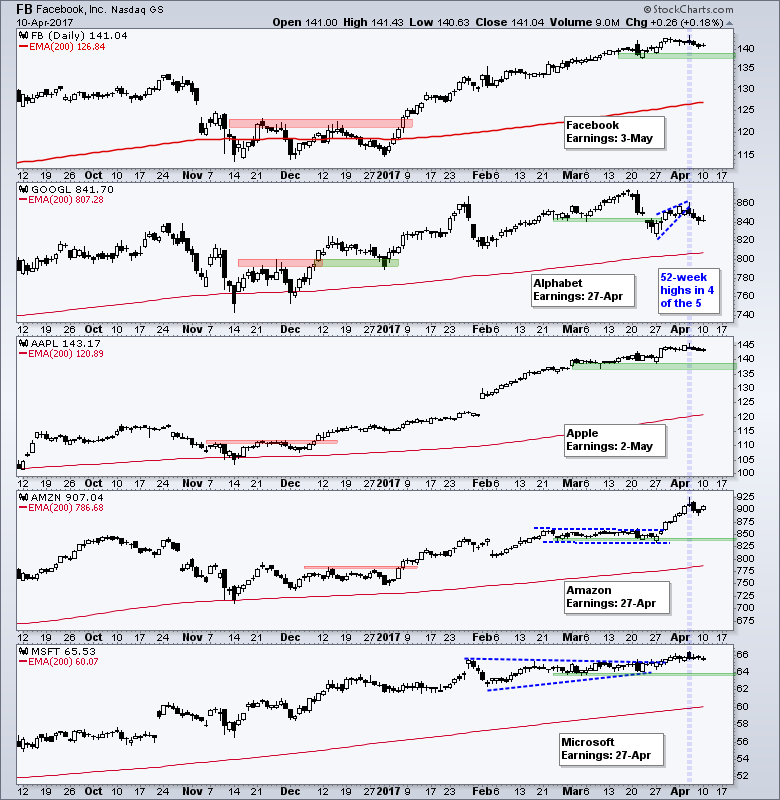
Alphabet Lags within the Fab Five - Celgene and Illumina Lead Biotechs
by Arthur Hill,
Chief Technical Strategist, TrendInvestorPro.com
.... Alphabet Lags within the Fab Five
.... Banks Hold Support, but Fail to Follow Through on Reversal
.... UAL Bounces on Seemingly Bad News
.... Celgene and Illumina Lead Biotechs (XBI)
.... Measured Move Target for NVDA ....
QQQ remains one of the strongest major index ETFs because four of the five top stocks hit...
READ MORE
MEMBERS ONLY
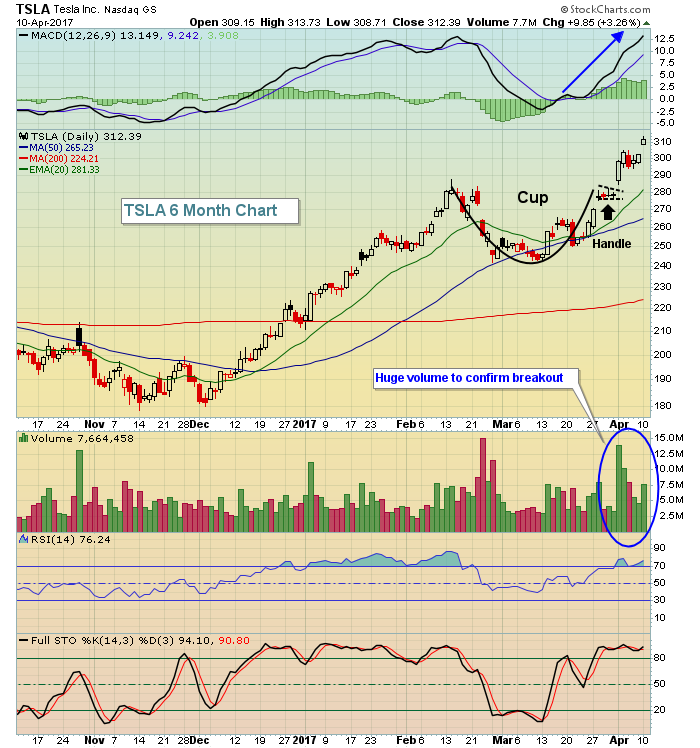
The VIX Signals No Bear Market On The Horizon......Yet
by Tom Bowley,
Chief Market Strategist, EarningsBeats.com
Market Recap for Monday, April 10, 2017
It was a back and forth kinda day on Wall Street with the finish coming up fairly flat with minor gains across the board. Tesla (TSLA) and Harley Davidson (HOG) were winners and helped lead automobiles ($DJUSAU) to leadership in the consumer discretionary...
READ MORE
MEMBERS ONLY

Uranium Looking Good - Excerpt from MarketWatchers LIVE
by Erin Swenlin,
Vice President, DecisionPoint.com
I'm really enjoying myself co-hosting the MarketWatchers LIVE webcasts Monday/Wednesday/Fridays at 12:00p - 1:30p EST. On Mondays and Wednesdays in this blog, I'll pick up an interesting topic or chart to elaborate on. I have to thank one of our Twitter followers...
READ MORE
MEMBERS ONLY
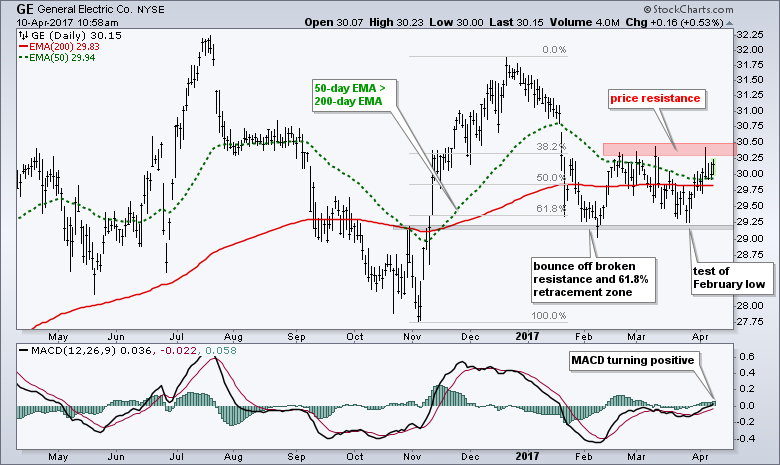
General Electric Finds Support, but Remains Short of a Breakout
by Arthur Hill,
Chief Technical Strategist, TrendInvestorPro.com
It has been a rough year for General Electric (GE) because the stock is down around 4% and underperforming the S&P 500 SPDR (SPY), which is up around 6% this year. Despite relative weakness, momentum is improving as MACD edges into positive territory and the stock is bouncing...
READ MORE
MEMBERS ONLY

Filtering the Noise
by Greg Morris,
Veteran Technical Analyst, Investor, and Author
I have mentioned many times I that I basically only work with daily market data. I do not have the personality to deal with intraday data and weekly data is only good for long term use. I do have a few weekly data indicators that I use as overlays to...
READ MORE
MEMBERS ONLY
Biotechs Consolidating But Technicals Improving
by Tom Bowley,
Chief Market Strategist, EarningsBeats.com
Market Recap for Friday, April 7, 2017
Consumer staples (XLP, +0.27%) and healthcare (XLV, +0.18%) were the sector leaders on Friday as our major indices finished near the flat line. Money rotated a bit towards defensive stocks, although utilities (XLU, -0.43%) failed to follow its defensive counterparts...
READ MORE
MEMBERS ONLY
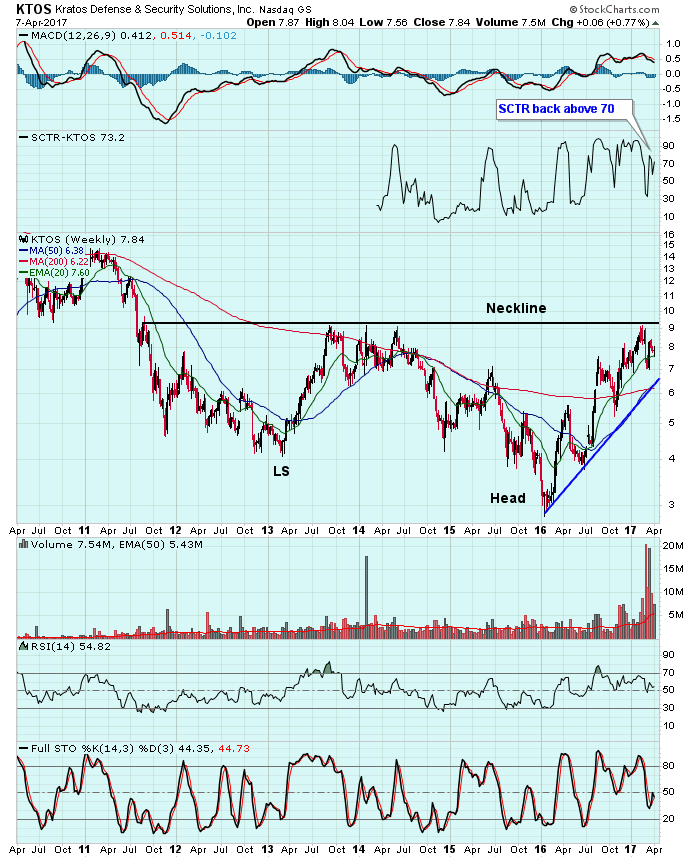
Looking For A Bottoming Reverse Head & Shoulder Breakout
by Tom Bowley,
Chief Market Strategist, EarningsBeats.com
Kratos Defense & Security Solutions (KTOS) has been in a steady uptrend for the past 15 months and its SCTR (StockCharts Technical Rank) has risen back above 70, suggesting that KTOS is becoming more attractive relative to its peers. It does still have plenty of technical work to do as...
READ MORE
MEMBERS ONLY

Friday's Trading Action Offers More False Signals
by Martin Pring,
President, Pring Research
1. False moves in the precious metal pits
2. Outside day in silver tips the near-term balance to the bears
3. More false breaks in the bond pits
Late last week I wrote that several markets had recently experienced false moves, known as whipsaws. It seems that Friday saw this...
READ MORE
MEMBERS ONLY
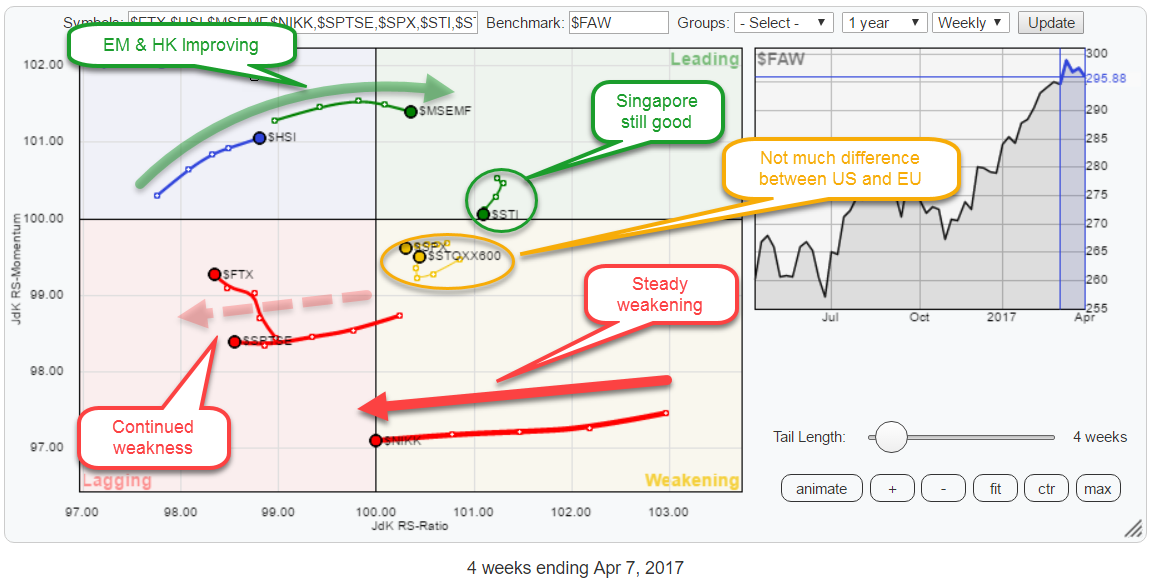
RRG suggests favoring Europe over US and Hong Kong over Japan
by Julius de Kempenaer,
Senior Technical Analyst, StockCharts.com
The Relative Rotation Graph above holds some the major world market indices and compares them to the FTSE all world index ($FAW) as the benchmark.
Straight from the RRG above we can make a few interesting observations.
Starting in the lagging quadrant, we find continued weakness for China ($FTX) and...
READ MORE
MEMBERS ONLY

Weekly Market Review & Outlook - Stocks and Bonds Yawn as Oil Wakes Up
by Arthur Hill,
Chief Technical Strategist, TrendInvestorPro.com
.... Broad Market Breadth Remains Weak
.... SPY Stalls within Pullback
.... Bearish Failure Swing forms in QQQ
.... IJR Tests Consolidation Lows
.... Tech, Discretionary and Staples Hold Up
.... Utilities and Materials Stay Strong
.... Finance, Industrials and Healthcare Correct
.... XLE Attempts a Channel Breakout (plus XOM)
.... Oil Holds Uptrend with Surge
.... TLT Challenges Consolidation...
READ MORE