MEMBERS ONLY
Two-Year Treasury Yield Reaches Seven-Year High, Dollar Turns Up

by John Murphy,
Chief Technical Analyst, StockCharts.com
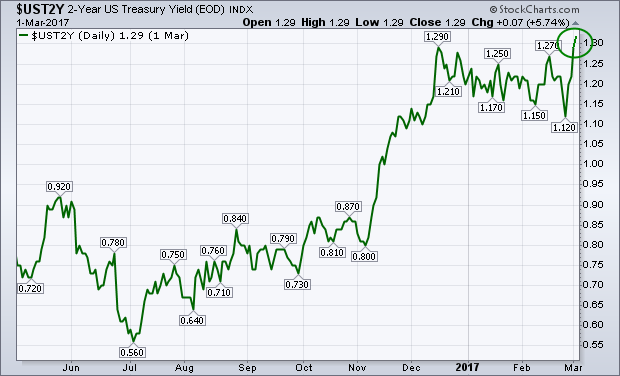
Chart 1 shows the 2-Year Treasury yield climbing above 1.30% on Thursday, for the first time in seven years. That shorter term yield is more sensitive to the potential for a rate hike than longer-range maturities. That suggests that fixed income traders are taking expectations for a March rate...
READ MORE
MEMBERS ONLY
Get to the Point and Figure

by Bruce Fraser,
Industry-leading "Wyckoffian"
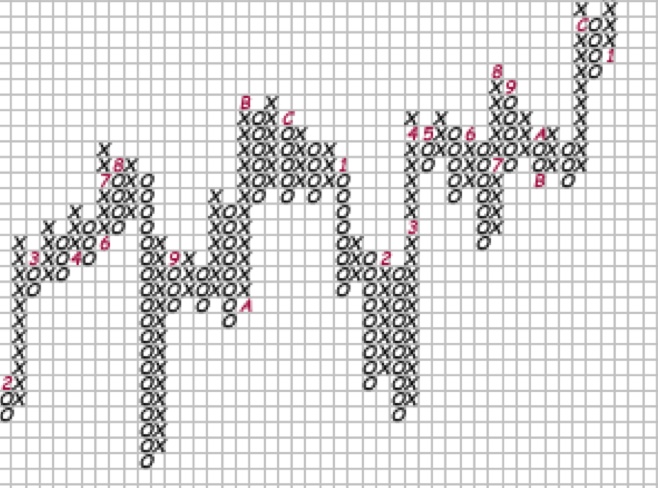
Sector activity can illuminate important thematic trends unfolding within the market. Point and Figure studies identify large Accumulation and Distribution Structures related to these themes poised to be campaigned over many months and years. The Sector can be campaigned using Exchange Traded Funds (ETFs). Also, by drilling down into the...
READ MORE
MEMBERS ONLY
Treasury Yields Rising As Home Construction Breaks To 10 Year High

by Tom Bowley,
Chief Market Strategist, EarningsBeats.com
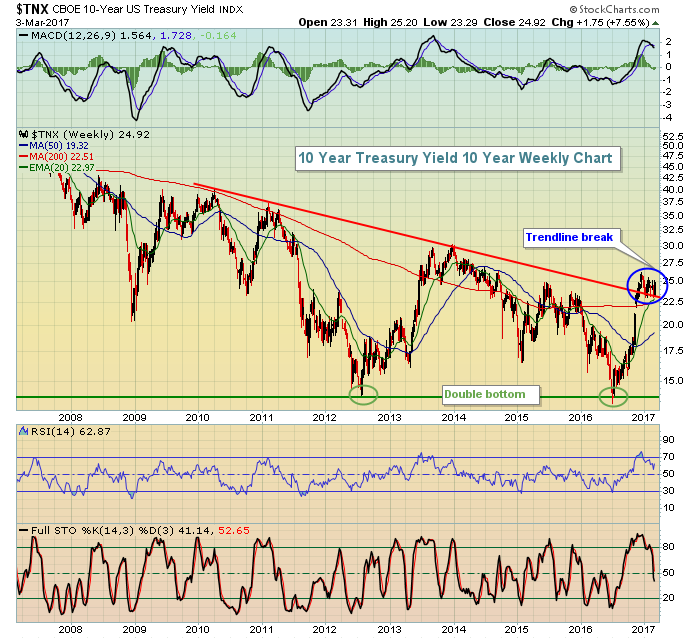
The FOMC will be meeting to discuss a potential rate hike in less than two weeks. A hike would continue the hawkish tone that began when the FOMC increased interest rates in December 2015 for the first time in nine years. It was about six months later that the 10...
READ MORE
MEMBERS ONLY
Special Home Construction Review - Stocks To Consider
by Tom Bowley,
Chief Market Strategist, EarningsBeats.com
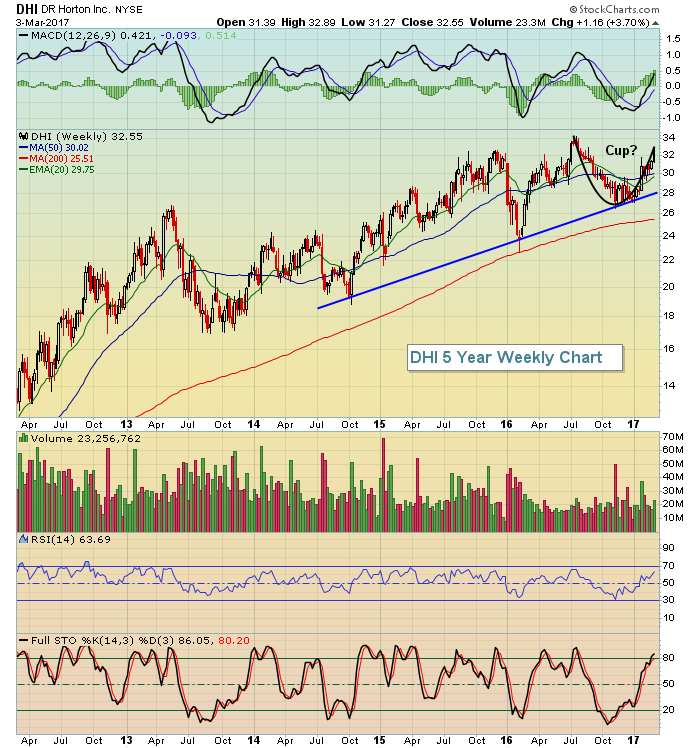
I'm providing this special Saturday edition of Trading Places as a result of a very significant breakout in the home construction index ($DJUSHB). One way to participate in this breakout is to buy an ETF that tracks home construction stocks. One example is the ITB. The latest disclosure...
READ MORE
MEMBERS ONLY

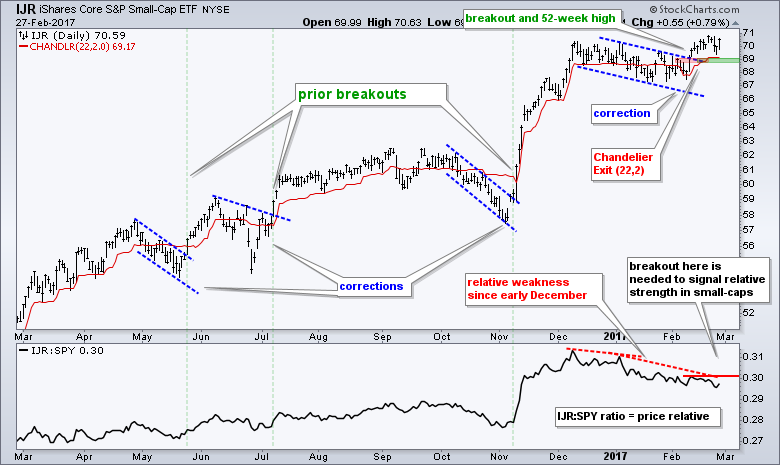
Actual Price Action versus Relative Price Action

by Arthur Hill,
Chief Technical Strategist, TrendInvestorPro.com
The price relative tells us how a stock is performing relative to a market benchmark, such as the S&P 500. Even though this relative performance indicator is good for measuring relative momentum, it does not always tell the entire story. A stock can show weakness in relative momentum,...
READ MORE
MEMBERS ONLY
Weekly Market Review & Outlook 4-Mar-17 (w/ video) - Breadth is Strong Enough
by Arthur Hill,
Chief Technical Strategist, TrendInvestorPro.com
----- Video Link ----- Art's Charts ChartList (updated 4-Mar) -----
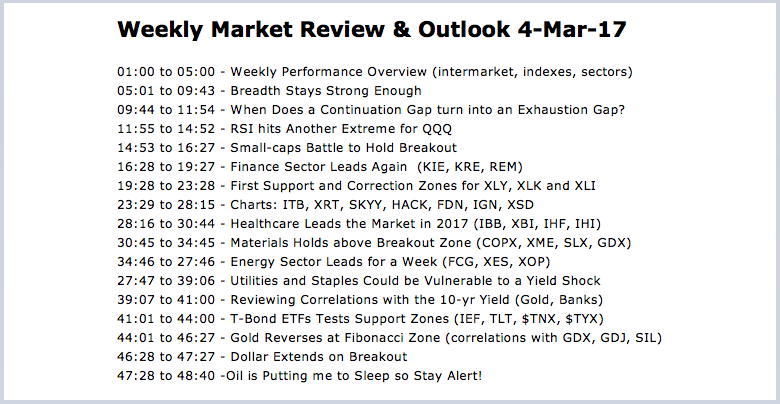
Weekly Market Review & Outlook 4-Mar-17
Financials, healthcare and energy stocks led the stock market higher this week with the S&P 500 SPDR, Nasdaq 100 ETF and S&P MidCap SPDR hitting new highs. The...
READ MORE
MEMBERS ONLY
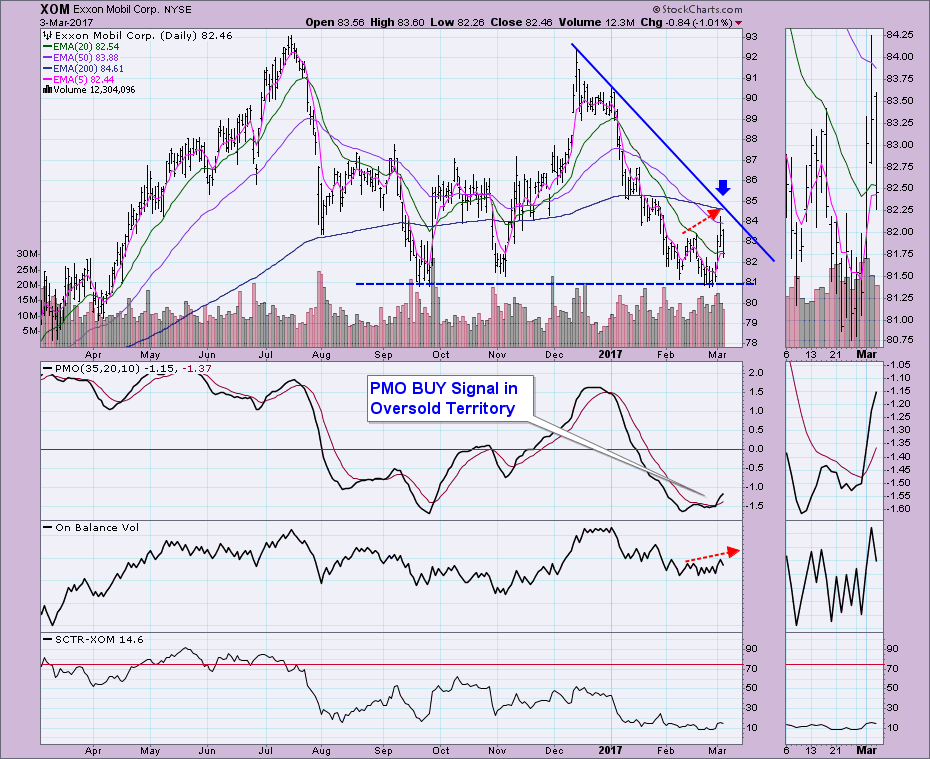
Chart Spotlight: Exxon-Mobil (XOM) Reveals Possibilities

by Erin Swenlin,
Vice President, DecisionPoint.com
During the DecisionPoint Report webinars I've added a "chart spotlight". For those of you who were members of the original DecisionPoint website, you probably remember Carl's "Chart Spotlight" on Fridays. Viewers and readers offer up some symbol suggestions via Twitter (@_DecisionPoint) and...
READ MORE
MEMBERS ONLY
Patience in an Overbought Market

by John Hopkins,
President and Co-founder, EarningsBeats.com
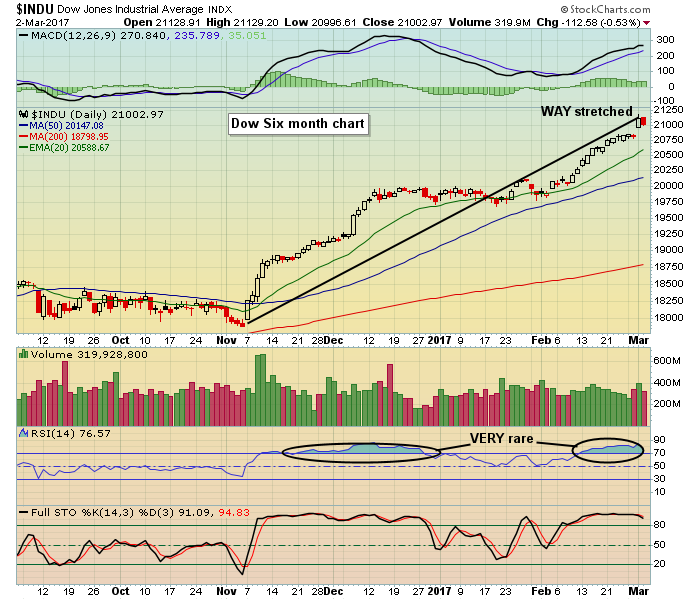
The rise in the major indexes since the election has been stunning. The S&P alone is up over 15% in just over 3 months. That would be a terrific year by any measure. The Dow was up 18% since the election at its all time high on Wednesday,...
READ MORE
MEMBERS ONLY
Heavy Construction Ready To Do Some Heavy Lifting
by Tom Bowley,
Chief Market Strategist, EarningsBeats.com
Market Recap for Thursday, March 2, 2017
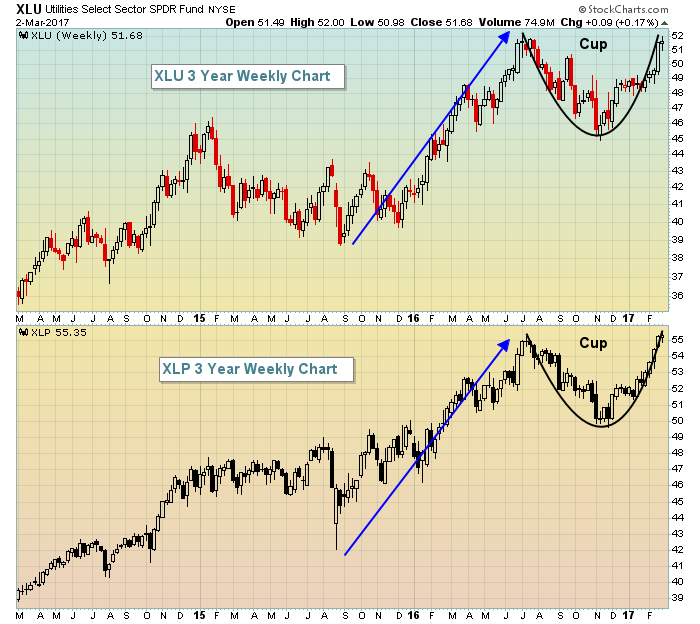
Thursday was a day of profit taking as all of our major indices retreated with the small cap Russell 2000 taking the biggest hit, falling 1.27%. Every sector finished lower with the exception of the defensive utilities sector (XLU), which actually gained...
READ MORE
MEMBERS ONLY

SystemTrader - Testing a 58-ETF Portfolio using Trend-Timing and Momentum-Rotation
by Arthur Hill,
Chief Technical Strategist, TrendInvestorPro.com
.... Introduction
.... Review of the Testing Period
.... Universe, Timeframe and Data
.... Stock Market and Portfolio Benchmark
.... Trend-Timing System using the PPO
.... Different Faces of Momentum
.... Market Filter, Trend Filter and Momentum
.... Scanning Code Sample
.... Testing Four Momentum Indicators
.... Equity Line and Drawdown Chart
.... Conclusions
Introduction
Last week I presented a trend-timing...
READ MORE
MEMBERS ONLY
Energy SPDR Showing No Improvement - XLE Reaching a Decision Point
by Erin Swenlin,
Vice President, DecisionPoint.com
Every Wednesday and Friday, I review the DecisionPoint Market/Sector Summary with my webinar viewers. It is actually only one table that is taken from the full Market/Sector Summary found in the "DP Reports" blog. This table shows us the DecisionPoint Intermediate-Term Trend Model (ITTM) "posture&...
READ MORE
MEMBERS ONLY
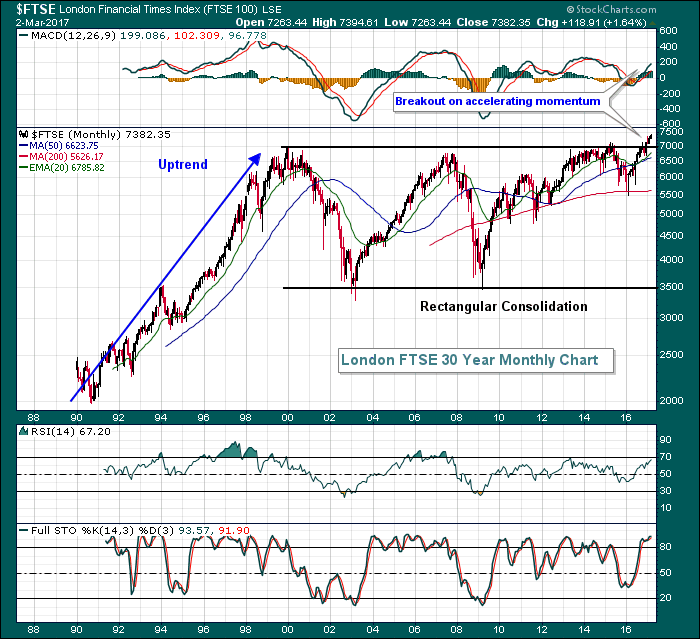
This Part Of Europe Just Made A Major Long-Term Breakout
by Tom Bowley,
Chief Market Strategist, EarningsBeats.com
The London Financial Times Index ($FTSE) had sideways consolidated for 17 years after topping back in 2000. That consolidation period has ended in a big way in 2017 and this index appears poised for a very significant rise. Despite how you might feel about Brexit, the market has casted its...
READ MORE
MEMBERS ONLY

The Secret of Making an Investment Methodology Produce Consistent Profits

by Gatis Roze,
Author, "Tensile Trading"
“I have heard many men talk intelligently, even brilliantly, about something – only to see them proven powerless when it comes to acting on what they believe. Investors must act in time.” -- Bernard Baruch
There is a fine line between embracing your methodology, trading it, trusting it, understanding all its...
READ MORE
MEMBERS ONLY

TWO-YEAR TREASURY YIELD HITS SEVEN -YEAR HIGH ON INCREASED ODDS FOR MARCH RATE HIKE -- THAT'S BOOSTING THE DOLLAR WHICH MAY BE ENDING ITS 2017 CORRECTION -- GOLD ETF STALLS AT 200-DAY LINE -- GOLD MINERS ARE EVEN WEAKER
by John Murphy,
Chief Technical Analyst, StockCharts.com
TWO-YEAR TREASURY YIELD REACHES SEVEN-YEAR HIGH... Chart 1 shows the 2-Year Treasury yield climbing above 1.30% today for the first time in seven years. That shorter term yield is more sensitive to the potential for a rate hike than longer-range maturities. That suggests that fixed income traders are taking...
READ MORE
MEMBERS ONLY

Article Summaries - 11-2016 to 2-2017

by Greg Morris,
Veteran Technical Analyst, Investor, and Author
Periodically I write an article that reviews the past few months of articles. Why on Earth would I do this? Primarily for two reasons. One is that many new readers are involved and often they do not go back and look at the past articles. Two is that my articles...
READ MORE
MEMBERS ONLY
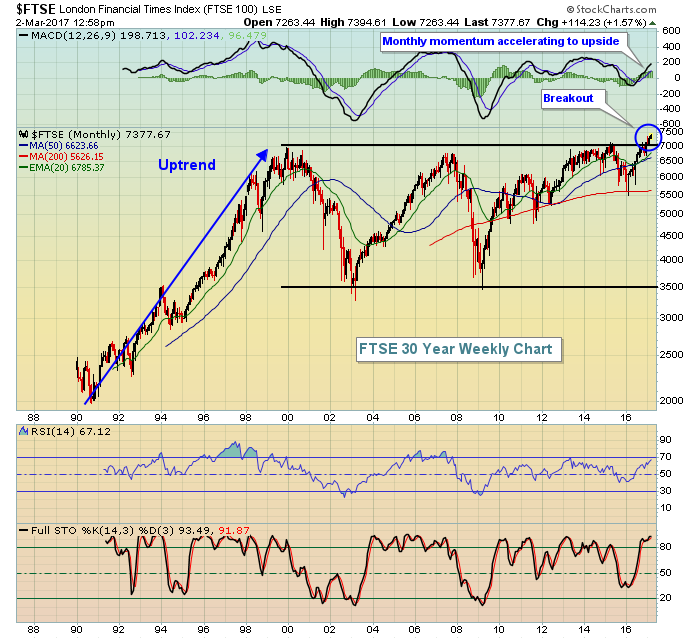
Dow Jones Soars 300 Points, Breaks 21000; FTSE Very Bullish
by Tom Bowley,
Chief Market Strategist, EarningsBeats.com
Market Recap for Wednesday, March 1, 2017
U.S. equities surged on Wednesday, with the Dow Jones and S&P 500 gaining 1.46% and 1.37%, respectively. The small cap Russell 2000 rebounded big time after its Tuesday drubbing, spiking 27 points, or 1.94%, to 1413 -...
READ MORE
MEMBERS ONLY

STOCKS HIT NEW RECORDS AS BOND YIELDS AND THE DOLLAR CLIMB -- FINANCIALS, INDUSTRIALS, AND MATERIALS LEAD RALLY -- SO DO SMALL CAPS AND TRANSPORTS -- GOLD AND OTHER SAFE HAVENS WEAKEN
by John Murphy,
Chief Technical Analyst, StockCharts.com
STOCKS SURGE TO NEW RECORDS ... Last night's presidential speech appears to have re-energized the reflation trade that favors stocks over bonds, and economically-sensitive stocks in particular. The first three charts show ETFs of the three major U.S. stock indexes gapping into new highs. Their RSI lines remain...
READ MORE
MEMBERS ONLY
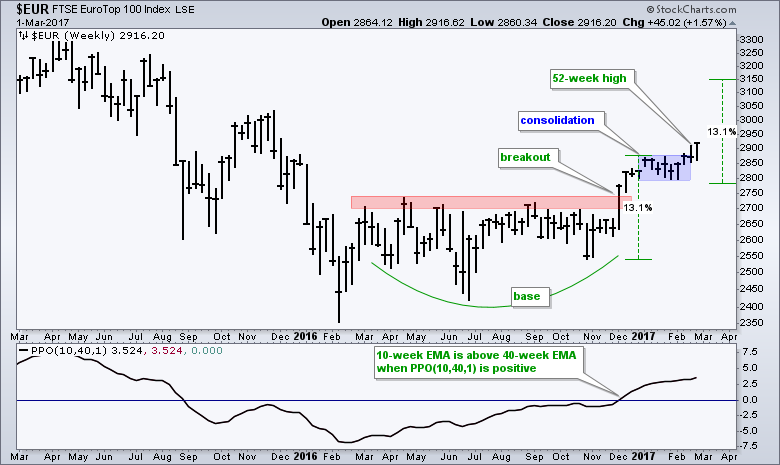
EuroTop 100 Index Ends Consolidations and Resumes Uptrend $EUR
by Arthur Hill,
Chief Technical Strategist, TrendInvestorPro.com
The EuroTop 100 ($EUR) has further room to run after breaking out of a bullish continuation pattern. The price chart shows the index basing from March until November and then breaking above a major resistance zone in early December. After a 13.1% advance in nine weeks, the index paused...
READ MORE
MEMBERS ONLY
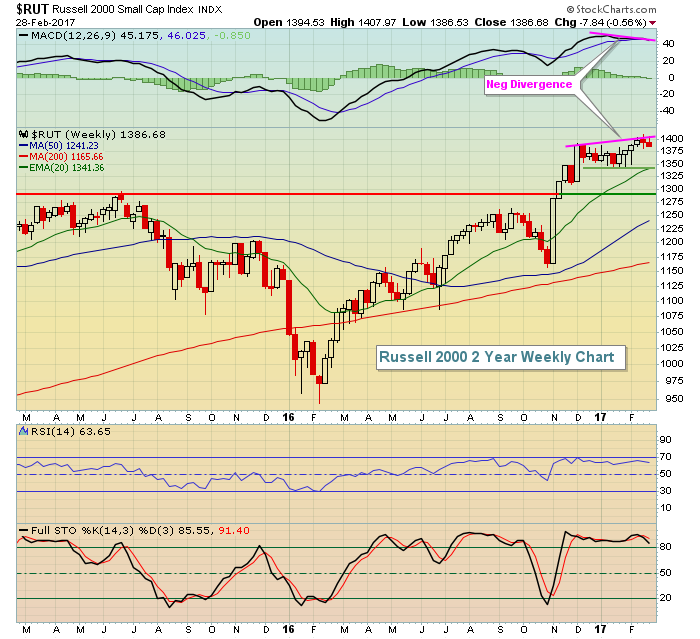
Overbought Aggressive Sectors Lead Decline In U.S. Equities
by Tom Bowley,
Chief Market Strategist, EarningsBeats.com
Market Recap for Tuesday, February 28, 2017
It was a day of profit taking on Tuesday. All of our major indices declined, although the selling was certainly contained. The S&P 500, for instance, dropped just 0.26% and remains near its all-time high. Weakness in consumer discretionary (XLY,...
READ MORE
MEMBERS ONLY
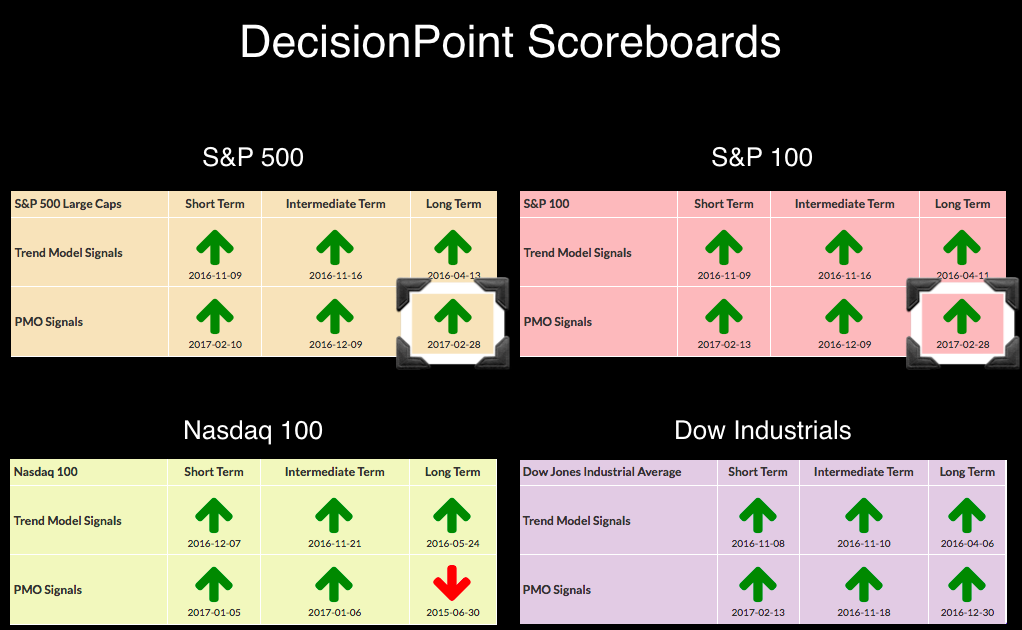
SPX and OEX - Two New Long-Term PMO BUY Signals - Monthly Chart Review of DP Scoreboards
by Erin Swenlin,
Vice President, DecisionPoint.com
The DecisionPoint Scoreboards in the DP Chart Galleries are now almost completely bullish. Two new Long-Term Price Momentum Oscillator (PMO) BUY signals appeared for the S&P 500 and S&P 100 when the monthly charts went final today. We don't tally up our Long-Term PMO...
READ MORE
MEMBERS ONLY

$GOLD : A Bear Market Rally Or A New Bull Market?

by Martin Pring,
President, Pring Research
* The all-important trading range
* The short-term trend for Gold
* What’s going on with those Gold shares?
* Hail Silver?
$GOLD has been rallying of late and the question naturally arises as to whether this advance is for real or is a normal bear market counter-cyclical advance. The answer is not...
READ MORE
MEMBERS ONLY

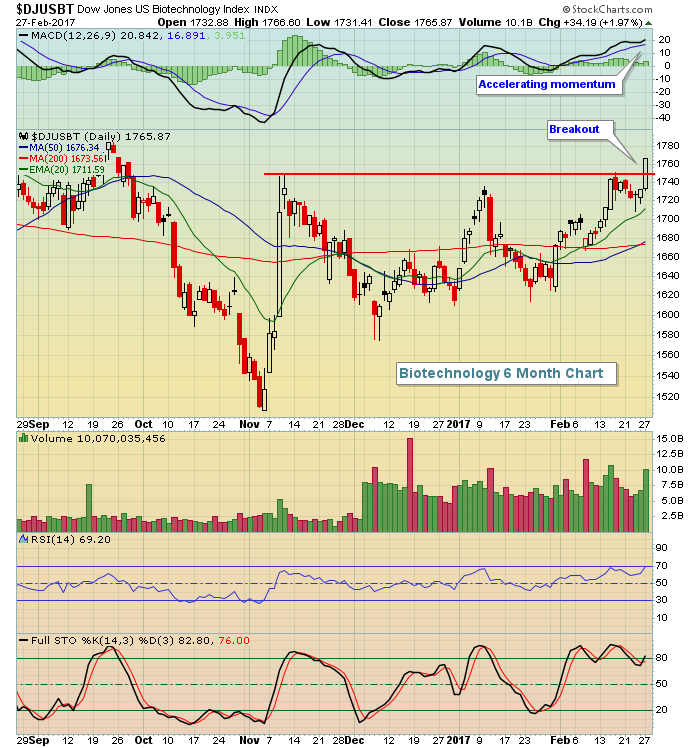
BIOTECH ISHARES NEAR UPSIDE BREAKOUT -- TWO SMALLER BIOTECH ETFS HAVE ALREADY BROKEN OUT -- TEN YEAR TREASURY YIELD THREATENS 2017 LOW -- SMALL CAPS ARE STARTING TO WEAKEN
by John Murphy,
Chief Technical Analyst, StockCharts.com
BIOTECH ISHARES NEAR SEPTEMBER HIGH... I've been writing about the recent upturn in the healthcare sector. And that the rally was being led higher medical device and equipment stocks, as well as health insurers. Biotechs and pharmaceuticals have lagged behind. Chart 1, however, shows the Nasdaq Biotechnology iShares...
READ MORE
MEMBERS ONLY
History Suggests Energy, Financials And Industrials Are Poised To Lead U.S. Stocks
by Tom Bowley,
Chief Market Strategist, EarningsBeats.com
Market Recap for Monday, February 27, 2017
Energy (XLE, +0.86%) led the market advance on Monday and that hasn't happened much over the past few months. But as I have shown below in the Sector/Industry Watch section, I believe there are several technical signs that we...
READ MORE
MEMBERS ONLY
Fibonacci Retracements are Not Science and 17 Stocks to Watch
by Arthur Hill,
Chief Technical Strategist, TrendInvestorPro.com
.... Small-caps Hold Breakout, but Still Lag
.... A Classic Throwback for Nucor
.... Oil Remains Stuck in Consolidation
.... Watch the Big Three (XOM, CVX, SLB) for Clues on XLE
.... Two Oil Refiner Stocks (MPC, VLO)
.... Four Oil & Gas Equipment and Services Stocks (NE, NOV, RDC, RIG)
.... Fibonacci Retracements are Not Science...
READ MORE
MEMBERS ONLY
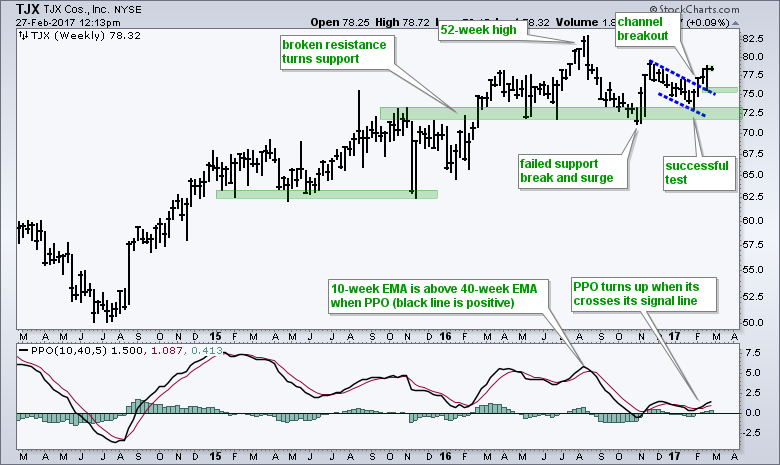
TJX Companies Looks Poised to Extend Uptrend $TJX
by Arthur Hill,
Chief Technical Strategist, TrendInvestorPro.com
TJX Companies (TJX), which operates TJ Maxx and Marshalls, recently broke out of a corrective pattern and this argues for a continuation of the bigger uptrend. It has been a rough year for most retail stocks with the Retail SPDR (XRT) down around 1% year-to-date. In contrast, TJX is up...
READ MORE
MEMBERS ONLY
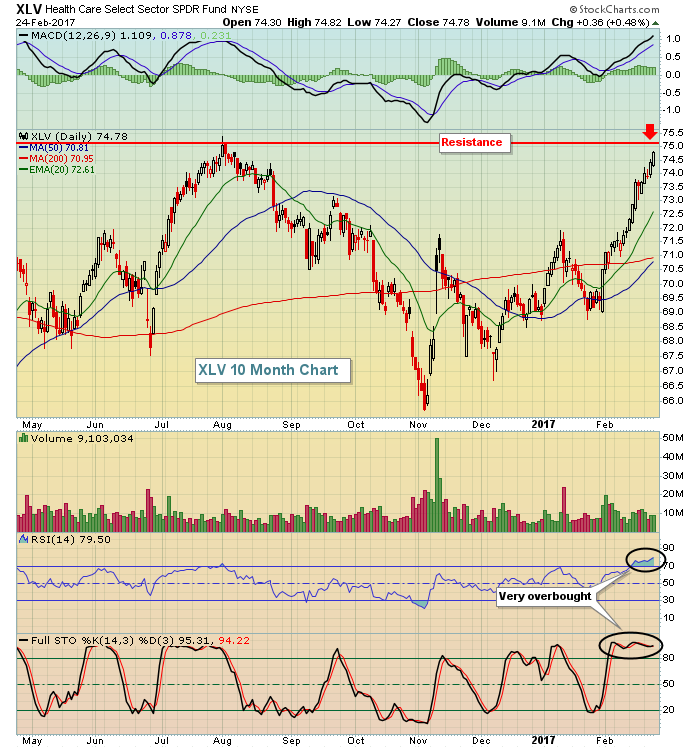
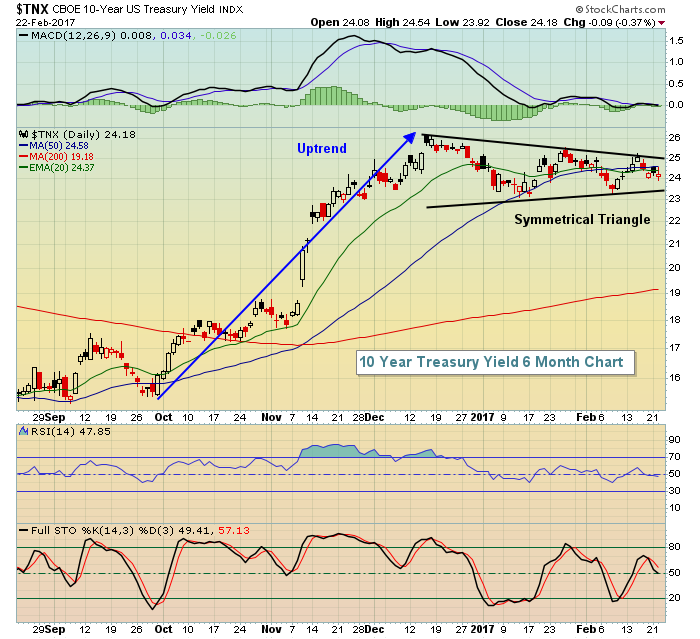
Utilities Taking Advantage Of Tumbling Treasury Yields
by Tom Bowley,
Chief Market Strategist, EarningsBeats.com
Market Recap for Friday, February 24, 2017
The 10 year treasury yield ($TNX) tumbled 7 basis points on Friday and that continued the recent string of solid days for utilities (XLU, +1.52%). Healthcare (XLV, +0.48%) is also benefiting from the rotation to defensive areas of the market as...
READ MORE
MEMBERS ONLY
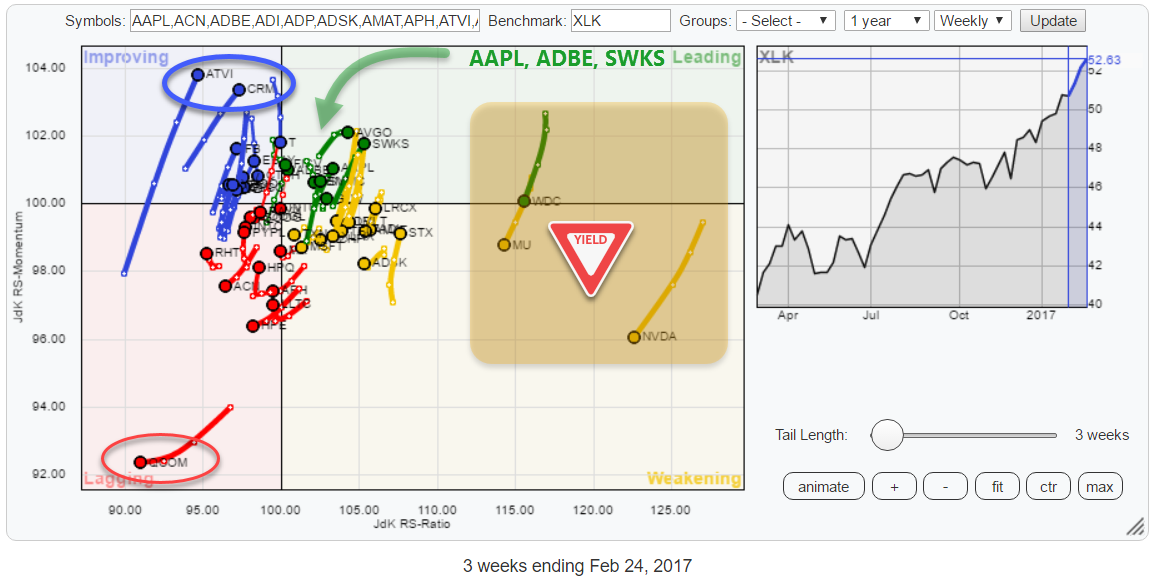
Bye bye NVDA, WDC, MU and Hello, ADBE, AAPL, SWKS

by Julius de Kempenaer,
Senior Technical Analyst, StockCharts.com
Summary
* XLK only sector inside leading quadrant for S&P 500 universe
* QCOM nosediving inside Lagging quadrant
* NVDA rapidly losing its top position within the sector
* WDC tracking MU lower into the weakening quadrant
* GLW providing excellent example of stable uptrend (price and relative)
* ADBE pushing into leading from...
READ MORE
MEMBERS ONLY
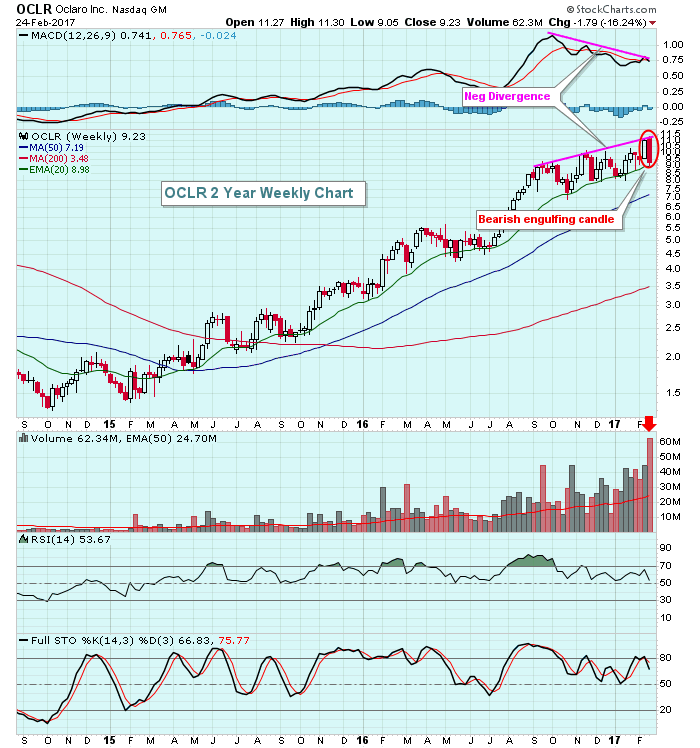
Weekly Candle Argues For Further Weakness Ahead For Oclaro
by Tom Bowley,
Chief Market Strategist, EarningsBeats.com
Oclaro Inc (OCLR) is printing several warning signals as it appears to be topping after a stellar advance. OCLR has nearly quadrupled since the beginning of 2016, but it's difficult to ignore the heavy volume reversal last week - especially when you consider that a negative divergence has...
READ MORE
MEMBERS ONLY
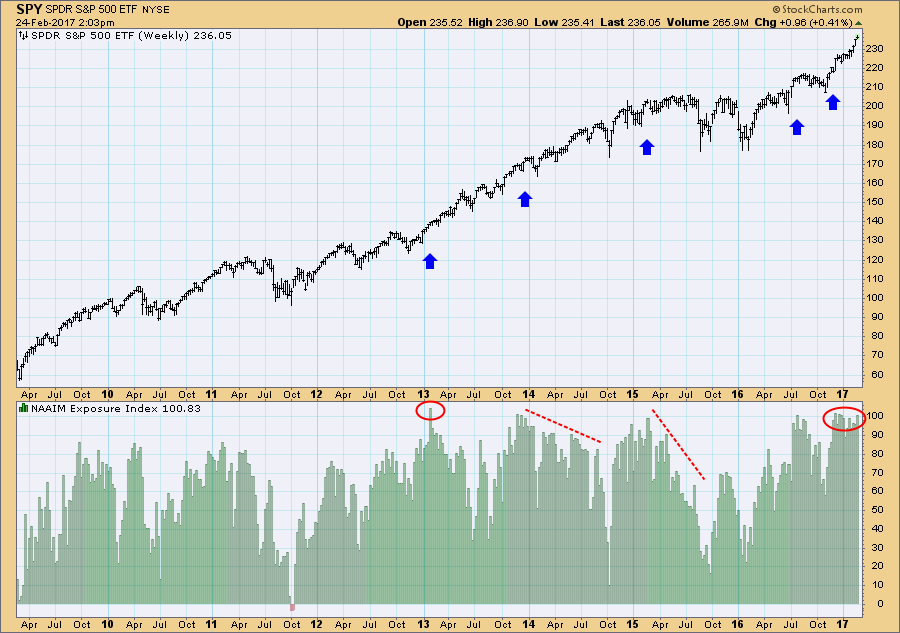
Sentiment: Investment Managers Very Bullish

by Carl Swenlin,
President and Founder, DecisionPoint.com
One of the sentiment indicators we follow is the Exposure Index (EI) for the National Association of Active Investment Managers (NAAIM). It is probably somewhat better than other measures of sentiment because it shows how professionals have actually deployed their assets. The far right of the chart shows a recent...
READ MORE
MEMBERS ONLY

Three Legged Stool
by Bruce Fraser,
Industry-leading "Wyckoffian"
Let’s do an integration case study. We have spent much time on two robust processes; Point and Figure analysis and Vertical Bar Chart analysis. Recently Relative Strength studies have been added to the mix. A stool has three legs, any fewer would make it unstable. Our Wyckoff stool has...
READ MORE
MEMBERS ONLY
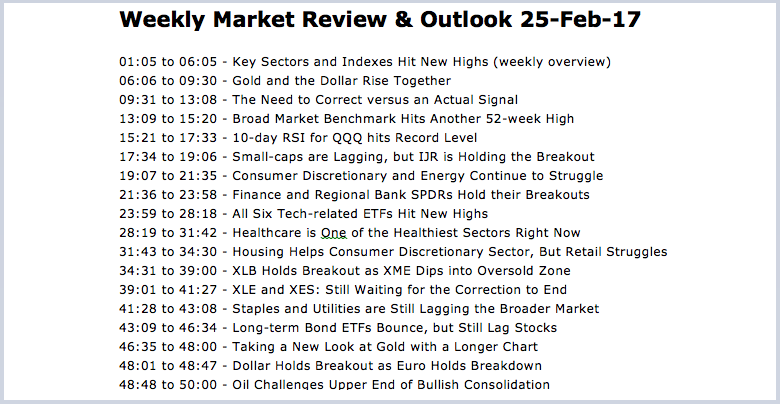
Weekly Market Review & Outlook 25-Feb-17 (w/video) - The Need to Correct versus an Actual Signal
by Arthur Hill,
Chief Technical Strategist, TrendInvestorPro.com
----- Video Link ----- Art's Charts ChartList (updated 25-Feb) -----
Key Sectors and Indexes Hit New Highs
The stock marked notched more new highs this week as the major index ETFs hit new highs during the week (SPY, DIA, IWM, IJR, MDY, QQQ). February is shaping up to...
READ MORE
MEMBERS ONLY

Charts I'm Stalking: Action Practice #12
by Gatis Roze,
Author, "Tensile Trading"
In previous blogs, I’ve sermonized that Asset Allocation is the highest leveraged activity that investors can undertake. We produced an entire two-disc DVD on how to execute what we call our “Methodology Allocation” process which maximizes the benefits of a CORE & EXPLORE approach and then optimizes it by...
READ MORE
MEMBERS ONLY
Lessons To Be Learned From A Consolidating Industry Group (Tires)
by Tom Bowley,
Chief Market Strategist, EarningsBeats.com
Market Recap for Thursday, February 23, 2017
The action on Thursday was not bullish at all. Yes, the Dow Jones and S&P 500 rose again with the Dow setting another all-time high. Great action, right? Wrong. The more aggressive NASDAQ and Russell 2000 both fell again by .43%...
READ MORE
MEMBERS ONLY

SystemTrader - Testing a Trend-Timing System and Momentum-Rotation System for the nine Sector SPDRs
by Arthur Hill,
Chief Technical Strategist, TrendInvestorPro.com
.... Introduction
.... Testing During Two Bear Markets
.... Universe, Timeframe and Data
.... Using S&P 500 as a Market Filter
.... Trend-Timing System using the PPO
.... Scaling into the S&P 500
.... Momentum-Rotation System using Rate-of-Change
.... Testing Different Momentum Periods
.... Riding the Roller Coaster
.... Conclusions
.... Scan Code
Introduction
I presented a...
READ MORE
MEMBERS ONLY
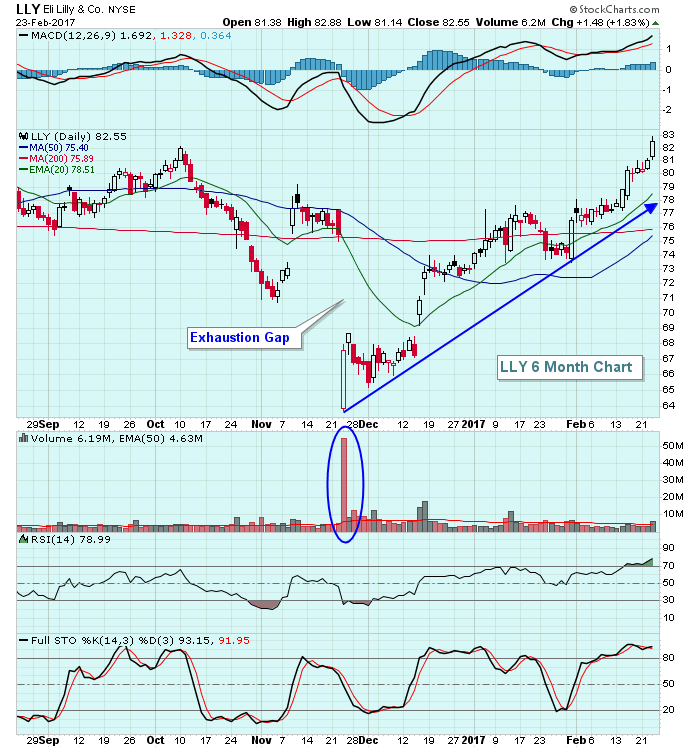
Eli Lilly Breaks 18 Month Downtrend
by Tom Bowley,
Chief Market Strategist, EarningsBeats.com
Eli Lilly (LLY) printed an exhaustion gap in November on massive volume, marking a significant bottom and over recent trading days broke a downtrend line that spanned 18 months of action. Based on this combination and improving momentum, it certainly appears that LLY has seen its worst and has begun...
READ MORE
MEMBERS ONLY

Chart Spotlight on Tesla (TSLA) - Decisive Breakdown
by Erin Swenlin,
Vice President, DecisionPoint.com
I noticed on the StockCharts.com homepage "symbol cloud" that readers were downloading this chart more than Amazon and the SPX (based on size of the font). I decided to take a look. Wow! TSLA dropped more than 6.4% today! There are some real problems with this...
READ MORE
MEMBERS ONLY

A Funny Thing May Be Happening On The Way To The Secular Bull Market In Interest Rates
by Martin Pring,
President, Pring Research
* How to spot a secular reversal
* Not all maturities are created equal
* The near-term technical picture
How to spot a secular reversal
A secular, or very long-term, trend is one that exists over many business cycles or what are usually called primary bull and bear markets. They vary in length...
READ MORE
MEMBERS ONLY

TRANSPORTS DIVERGE FROM INDUSTRIALS -- UTILITY SURGE MAY ALSO SIGNAL DEFENSIVE SHIFT -- UTILITY/TRANSPORTATION RATIO TURNS UP -- CONSUMER STAPLES SPDR NEARS NEW RECORD -- THAT MAY ALSO SIGNAL A MORE DEFENSIVE TONE IN AN OVERBOUGHT MARKET
by John Murphy,
Chief Technical Analyst, StockCharts.com
TRANSPORTS START TO WEAKEN ... A number of short-term caution signals are showing up for stocks which might be hinting that the current rally is due for a pullback. Some of those caution signals are coming from relationships between the three Dow Averages. Let's start with the transports. Chart...
READ MORE
MEMBERS ONLY
Commodity Chemicals Break Out Again, Look Very Bullish
by Tom Bowley,
Chief Market Strategist, EarningsBeats.com
Market Recap for Wednesday, February 22, 2017
Utilities (XLU, +0.42%) showed relative strength again on Wednesday, leading the charge on an otherwise bifurcated kinda day. The Dow Jones was able to finish the session with a gain, but the benchmark S&P 500, NASDAQ and Russell 2000 were...
READ MORE
MEMBERS ONLY
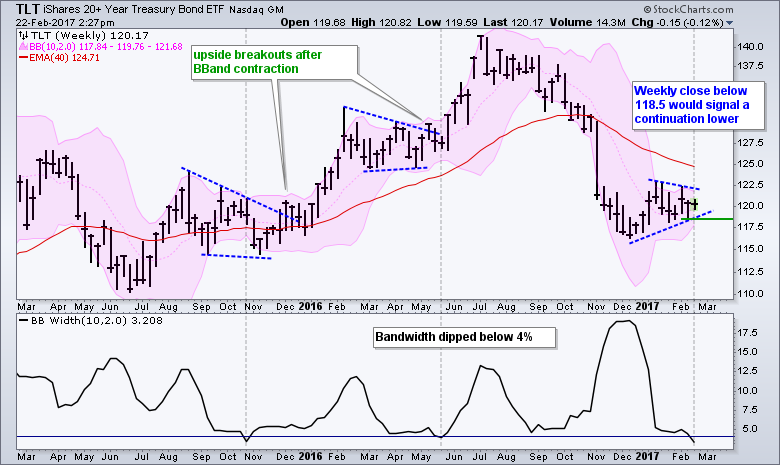
The Noose Tightness as T-Bond ETF Prepares for Next Move
by Arthur Hill,
Chief Technical Strategist, TrendInvestorPro.com
The 20+ YR T-Bond ETF (TLT) is consolidating within a long-term downtrend and this favors a bearish resolution to the current pattern. TLT fell sharply from July to November and broke through its 40-week EMA. The ETF is currently consolidating below the falling EMA and a consolidation within a downtrend...
READ MORE