MEMBERS ONLY

DOW AND S&P 500 ARE THREATENING THEIR 50-DAY AVERAGES -- TECHNOLGY SELLING WEAKENS THE NASDAQ -- FINANCIALS AND TRANPORTS CONTINUE TO UNDERPERFORM -- VIX HITS FIVE-MONTH HIGH

by John Murphy,
Chief Technical Analyst, StockCharts.com
DOW AND S&P 500 MAY BE SLIPPING BELOW 50-DAY LINES... The short-term trend for the market continues to weaken. Chart 1 shows the Dow Jones Industrial SPDR (DIA) trading below its 50-day average in early afternoon trading. The DIA hasn't closed below that support line since...
READ MORE
MEMBERS ONLY
Fear Is Rising As Gold Breaks Out

by Tom Bowley,
Chief Market Strategist, EarningsBeats.com
Market Recap for Tuesday, April 11, 2017
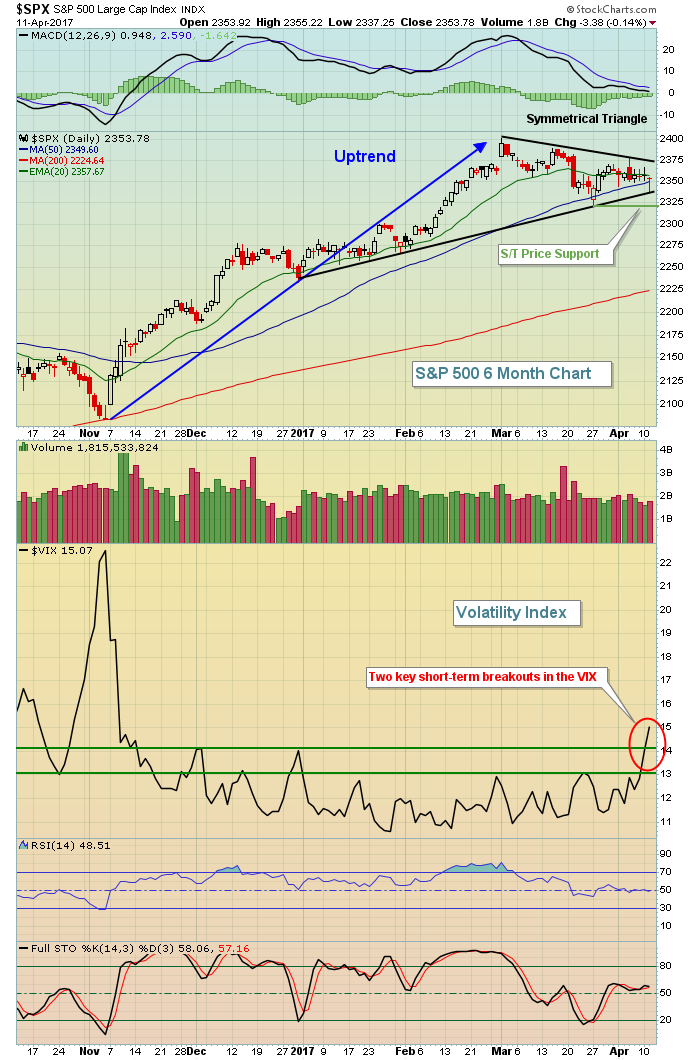
The Volatility Index ($VIX) hit its lowest level since mid-November on Tuesday, nearly reaching 16 before backing off and closing at 15.07 and up 7.26% on the session. That development is significant because the S&P 500 has remained above...
READ MORE
MEMBERS ONLY

DP Alert: Volume Indicators Mixed - SPY Finds Support...For Now - ITTM Neutral Signal on RYF

by Erin Swenlin,
Vice President, DecisionPoint.com
No changes on the DecisionPoint Scoreboards. You'll find these boards in the DP Chart Gallery. However, we did get a new Intermediate-Term Trend Model (ITTM) Neutral signal on the equal-weight Financials ETF (RYF).
The purpose of the DecisionPoint Alert Daily Update is to quickly review the day'...
READ MORE
MEMBERS ONLY
Alphabet Lags within the Fab Five - Celgene and Illumina Lead Biotechs

by Arthur Hill,
Chief Technical Strategist, TrendInvestorPro.com
.... Alphabet Lags within the Fab Five
.... Banks Hold Support, but Fail to Follow Through on Reversal
.... UAL Bounces on Seemingly Bad News
.... Celgene and Illumina Lead Biotechs (XBI)
.... Measured Move Target for NVDA ....
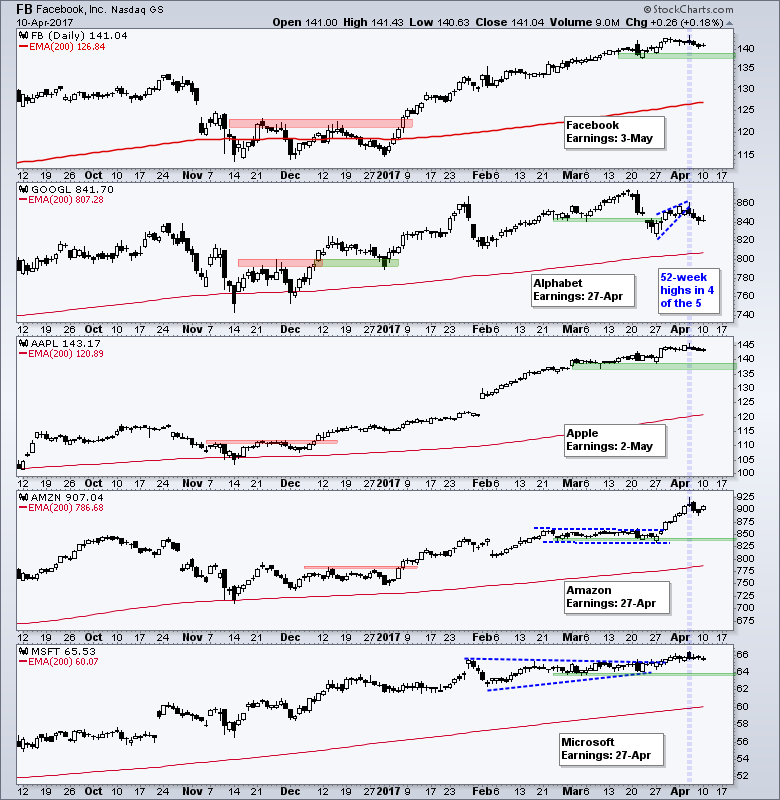
QQQ remains one of the strongest major index ETFs because four of the five top stocks hit...
READ MORE
MEMBERS ONLY
The VIX Signals No Bear Market On The Horizon......Yet
by Tom Bowley,
Chief Market Strategist, EarningsBeats.com
Market Recap for Monday, April 10, 2017
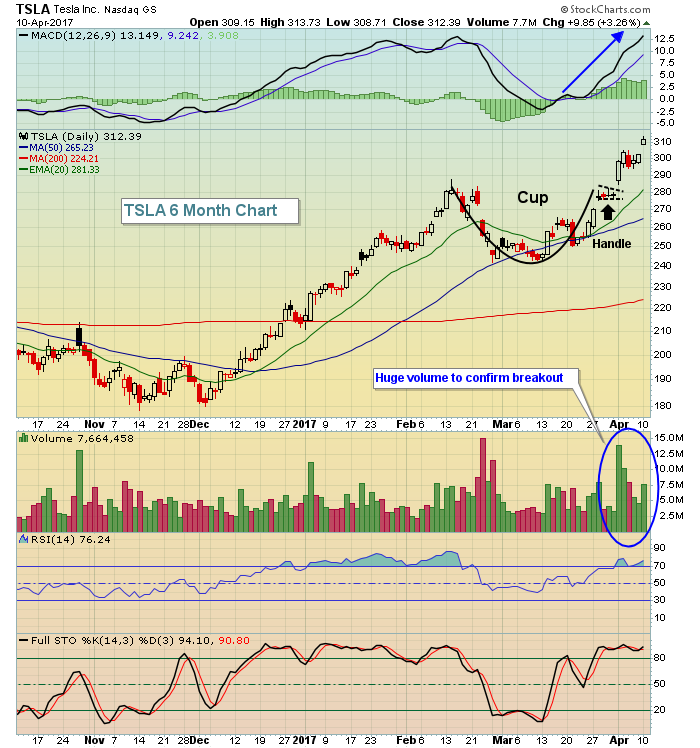
It was a back and forth kinda day on Wall Street with the finish coming up fairly flat with minor gains across the board. Tesla (TSLA) and Harley Davidson (HOG) were winners and helped lead automobiles ($DJUSAU) to leadership in the consumer discretionary...
READ MORE
MEMBERS ONLY

Uranium Looking Good - Excerpt from MarketWatchers LIVE
by Erin Swenlin,
Vice President, DecisionPoint.com
I'm really enjoying myself co-hosting the MarketWatchers LIVE webcasts Monday/Wednesday/Fridays at 12:00p - 1:30p EST. On Mondays and Wednesdays in this blog, I'll pick up an interesting topic or chart to elaborate on. I have to thank one of our Twitter followers...
READ MORE
MEMBERS ONLY
General Electric Finds Support, but Remains Short of a Breakout
by Arthur Hill,
Chief Technical Strategist, TrendInvestorPro.com
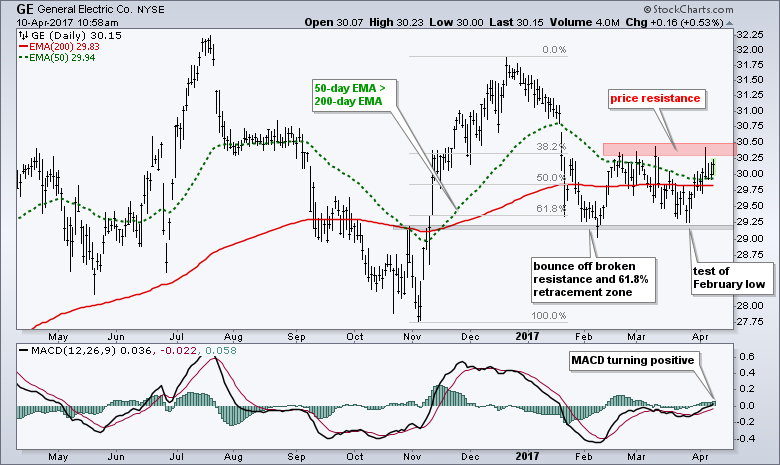
It has been a rough year for General Electric (GE) because the stock is down around 4% and underperforming the S&P 500 SPDR (SPY), which is up around 6% this year. Despite relative weakness, momentum is improving as MACD edges into positive territory and the stock is bouncing...
READ MORE
MEMBERS ONLY

Filtering the Noise

by Greg Morris,
Veteran Technical Analyst, Investor, and Author
I have mentioned many times I that I basically only work with daily market data. I do not have the personality to deal with intraday data and weekly data is only good for long term use. I do have a few weekly data indicators that I use as overlays to...
READ MORE
MEMBERS ONLY
Biotechs Consolidating But Technicals Improving
by Tom Bowley,
Chief Market Strategist, EarningsBeats.com
Market Recap for Friday, April 7, 2017
Consumer staples (XLP, +0.27%) and healthcare (XLV, +0.18%) were the sector leaders on Friday as our major indices finished near the flat line. Money rotated a bit towards defensive stocks, although utilities (XLU, -0.43%) failed to follow its defensive counterparts...
READ MORE
MEMBERS ONLY
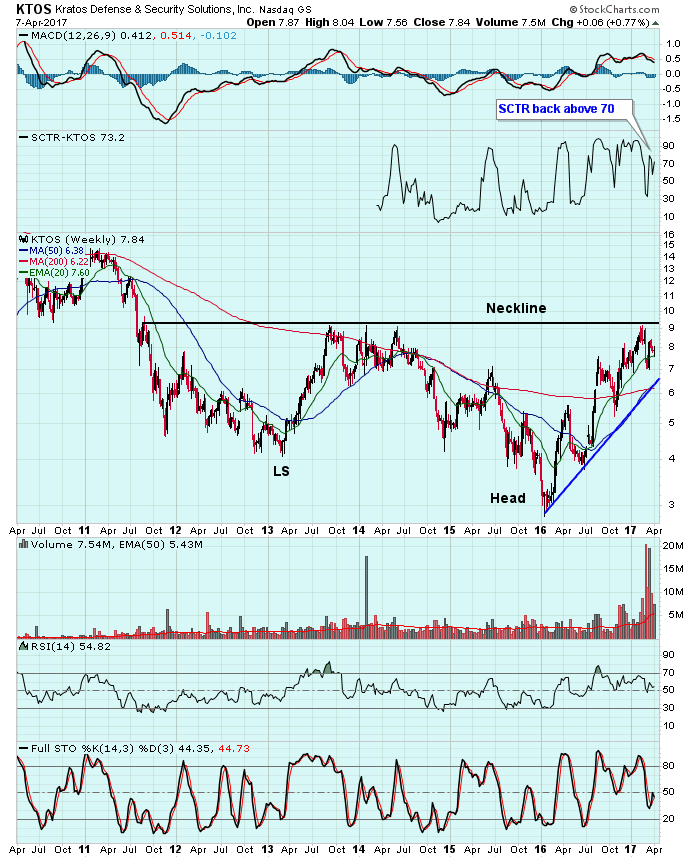
Looking For A Bottoming Reverse Head & Shoulder Breakout
by Tom Bowley,
Chief Market Strategist, EarningsBeats.com
Kratos Defense & Security Solutions (KTOS) has been in a steady uptrend for the past 15 months and its SCTR (StockCharts Technical Rank) has risen back above 70, suggesting that KTOS is becoming more attractive relative to its peers. It does still have plenty of technical work to do as...
READ MORE
MEMBERS ONLY

Friday's Trading Action Offers More False Signals

by Martin Pring,
President, Pring Research
1. False moves in the precious metal pits
2. Outside day in silver tips the near-term balance to the bears
3. More false breaks in the bond pits
Late last week I wrote that several markets had recently experienced false moves, known as whipsaws. It seems that Friday saw this...
READ MORE
MEMBERS ONLY
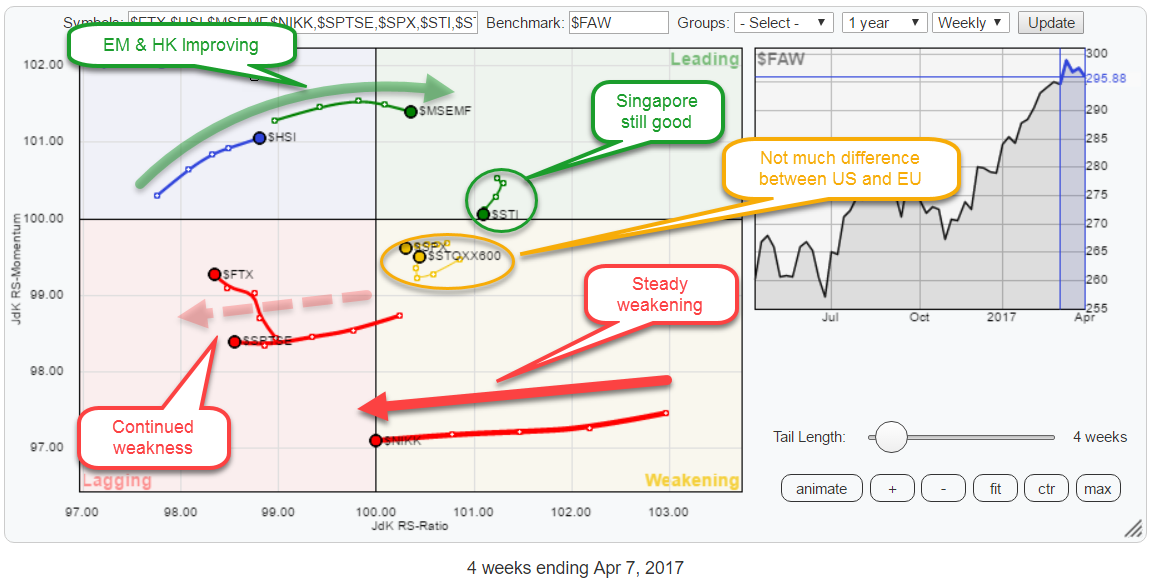
RRG suggests favoring Europe over US and Hong Kong over Japan

by Julius de Kempenaer,
Senior Technical Analyst, StockCharts.com
The Relative Rotation Graph above holds some the major world market indices and compares them to the FTSE all world index ($FAW) as the benchmark.
Straight from the RRG above we can make a few interesting observations.
Starting in the lagging quadrant, we find continued weakness for China ($FTX) and...
READ MORE
MEMBERS ONLY

Weekly Market Review & Outlook - Stocks and Bonds Yawn as Oil Wakes Up
by Arthur Hill,
Chief Technical Strategist, TrendInvestorPro.com
.... Broad Market Breadth Remains Weak
.... SPY Stalls within Pullback
.... Bearish Failure Swing forms in QQQ
.... IJR Tests Consolidation Lows
.... Tech, Discretionary and Staples Hold Up
.... Utilities and Materials Stay Strong
.... Finance, Industrials and Healthcare Correct
.... XLE Attempts a Channel Breakout (plus XOM)
.... Oil Holds Uptrend with Surge
.... TLT Challenges Consolidation...
READ MORE
MEMBERS ONLY

Zim's Group

by Bruce Fraser,
Industry-leading "Wyckoffian"
In 1987 Hank Pruden decided to take a break from teaching the Technical Analysis Courses at Golden Gate University. He offered me the job of teaching these courses during his absence. I was honored by his invitation and accepted. His sabbatical went on for three years and I believe it...
READ MORE
MEMBERS ONLY
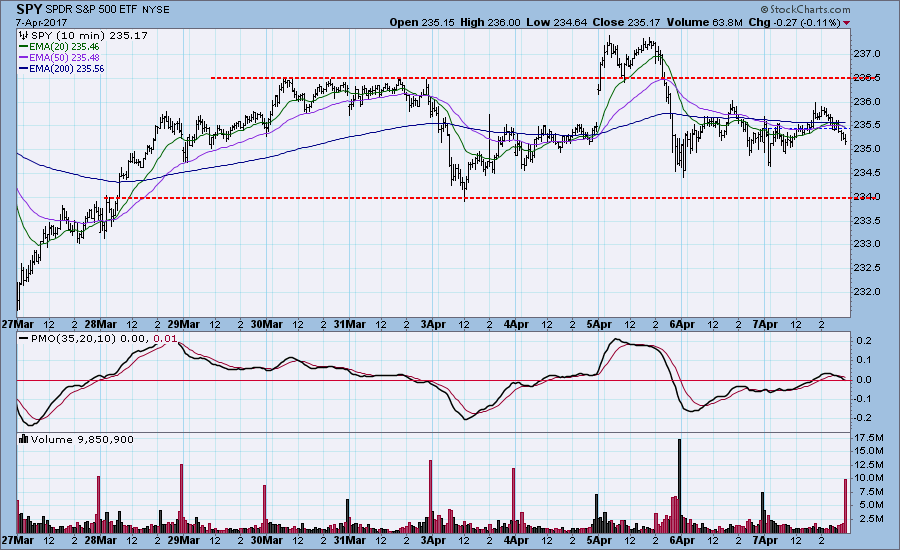
DecisionPoint Weekly Wrap April 7, 2017

by Carl Swenlin,
President and Founder, DecisionPoint.com
*** IMPORTANT NOTE: We are making some changes to our DecisionPoint blogs and webinars starting on April 1st.Click here for more details. ***
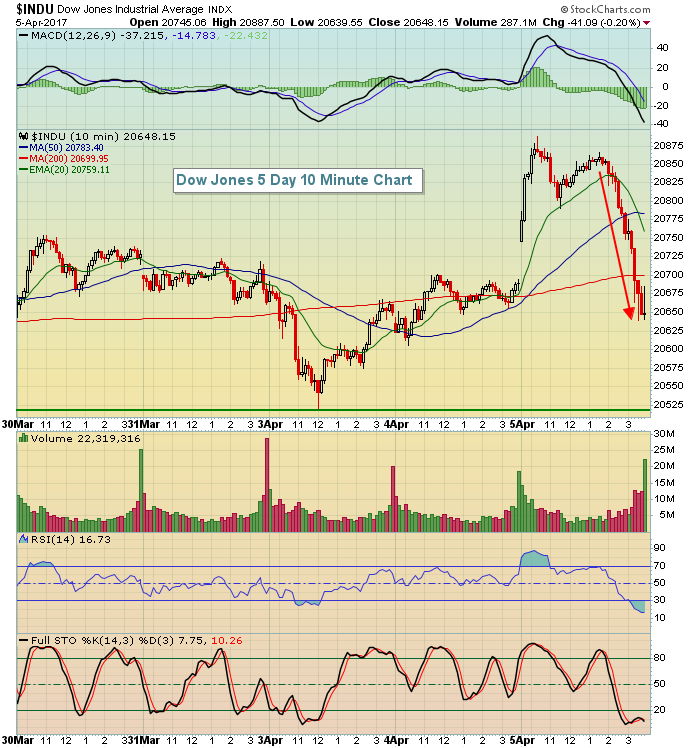
Despite a negative reaction to Fed comments, and the U.S attack on a Syrian air base, the market held steady within the current corrective phase. The 10-minute...
READ MORE
MEMBERS ONLY

STOCK INDEXES STAY ABOVE 50-DAY AVERAGES AFTER MISSILE ATTACK -- SMALL CAPS AND FINANCIALS NEED TO DO BETTER -- BOND YIELDS BOUNCE OFF BOTTOM OF 2017 TRADING RANGE -- DOLLAR RALLIES AS SAFE HAVEN YEN WEAKENS -- GOLD STRUGGLES AT 200-DAY AVERAGE
by John Murphy,
Chief Technical Analyst, StockCharts.com
MAJOR STOCK INDEXES HOLD 50-DAY LINES ... Entering today's trading, stocks were relatively flat on the week. Bond prices, however, were nearing the top of their 2017 trading range. Other safe haven assets like gold and the yen have been bouncing as well. Yesterday's missile attack on...
READ MORE
MEMBERS ONLY

Charts I'm Stalking: Action Practice #14

by Gatis Roze,
Author, "Tensile Trading"
My intent with this Action Practice is not to wax on about the importance of understanding what the markets’ current preferences are. My point is simply that if the markets are favoring growth over value, then as investors, our probabilities are enhanced when we invest with the growth winds at...
READ MORE
MEMBERS ONLY
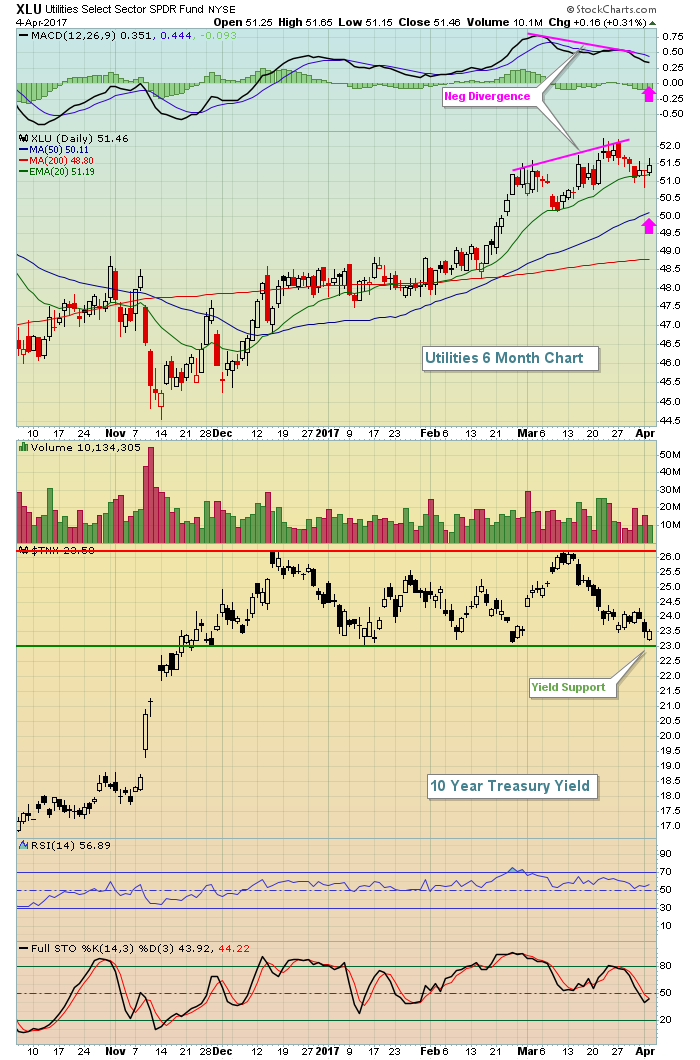
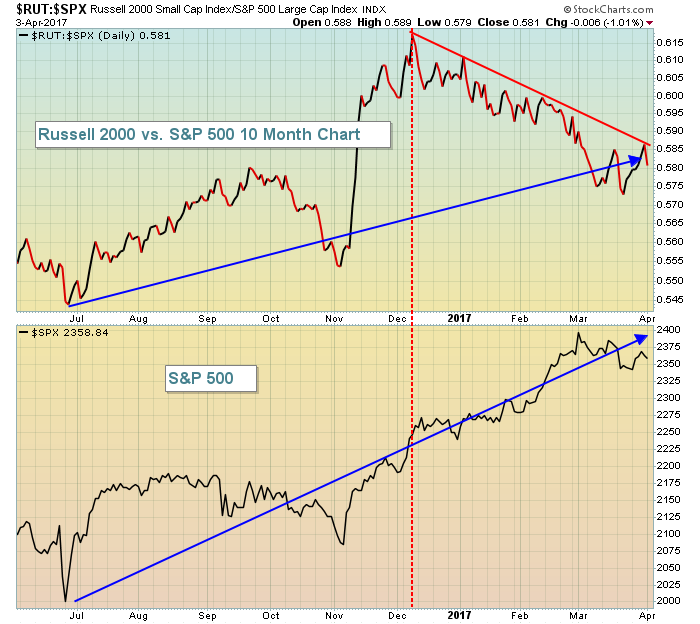
Treasury Yield Nears Support, Financials Wavering
by Tom Bowley,
Chief Market Strategist, EarningsBeats.com
Market Recap for Thursday, April 6, 2017
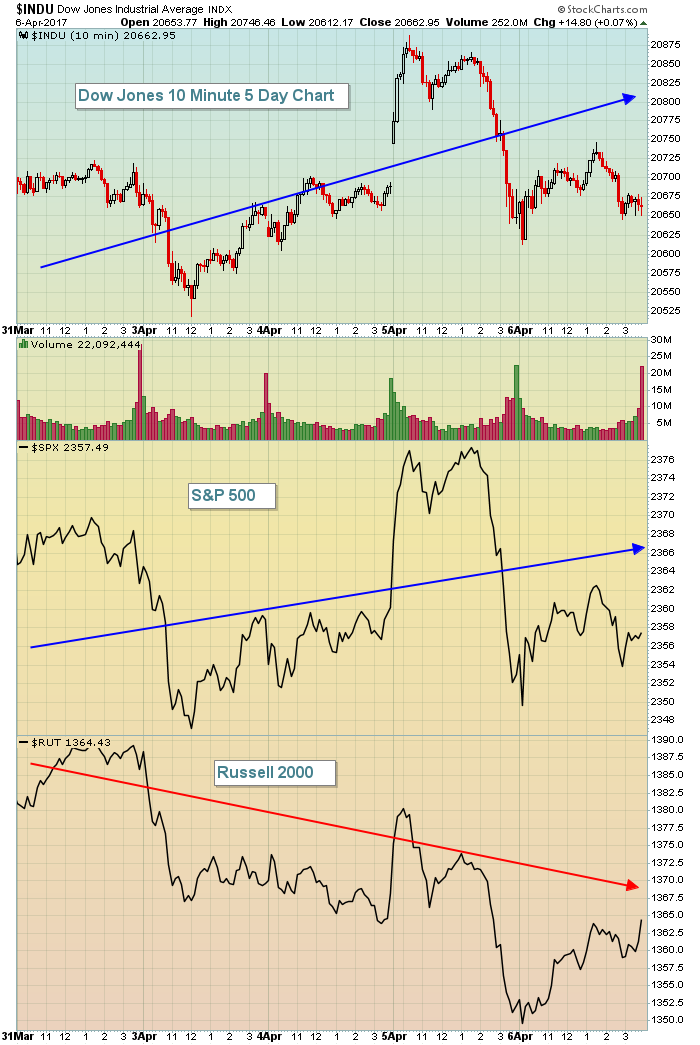
Yesterday, we saw better relative action on the Russell 2000, a positive for equities. However, that has not been the case over the past week as you can see from the chart below:
There's been a slight uptrend in Dow stocks...
READ MORE
MEMBERS ONLY
Charter Forms The Right Side Of A Cup
by Tom Bowley,
Chief Market Strategist, EarningsBeats.com
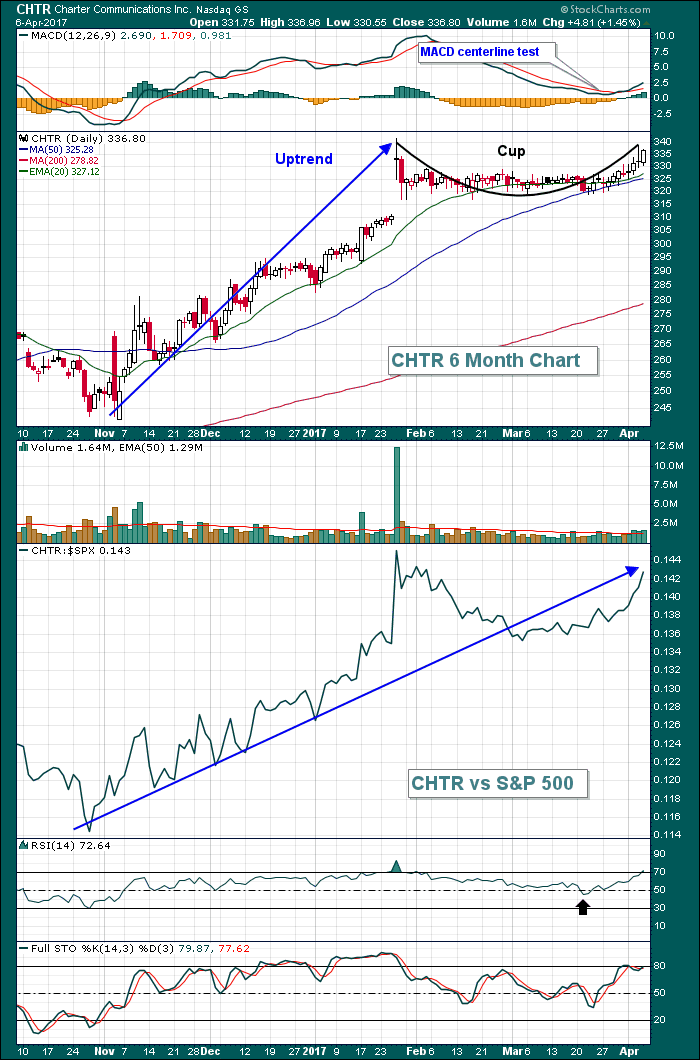
Charter Communications (CHTR) extended its multi-year uptrend in late January with a heavy volume gap higher. CHTR spent the next several weeks consolidating and unwinding very overbought conditions. But the stock began to resume its prior strength after its RSI touched the 40s (black arrow below) and its MACD hit...
READ MORE
MEMBERS ONLY
Declining Trend Persists - IT Indicators Bottoming
by Erin Swenlin,
Vice President, DecisionPoint.com
No new changes on the DP Scoreboards. I was expecting to see the Dow trigger a Short-Term Trend Model BUY signal, but with yesterday's failed breakout and price stagnating over the past week or two, you can see that the 5-EMA is maintaining below the 20-EMA with little...
READ MORE
MEMBERS ONLY

Markets Have Experienced A Lot Of Fake Breakouts Recently
by Martin Pring,
President, Pring Research
* A few words on false moves
* US market experiences false upside breakout this week
* Whipsaws in the sectors
* European currency whipsaws
A few words on false moves
Prices in financial markets are driven principally by psychology. They effectively reflect people in action. The problem is, that people can and do...
READ MORE
MEMBERS ONLY
SystemTrader - Scan Code for Bollinger Band Squeeze - Plus Coding Tips and Techniques
by Arthur Hill,
Chief Technical Strategist, TrendInvestorPro.com
.... Universe and Trend Filter
.... Bollinger Band Setup Code
.... StockRSI Trigger Code
.... Rate-of-Change Sort Code
.... Scan Code in Full
.... TTM Technologies Setup and Signal
.... Conclusions and Suggestions ....
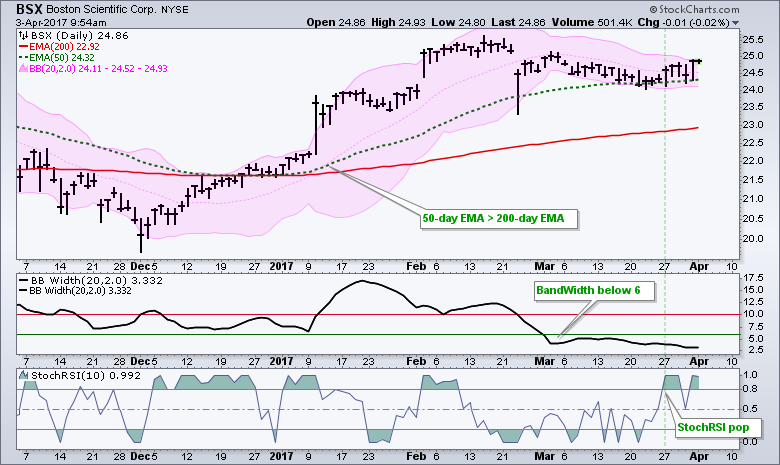
Scan Code for Bollinger Band Squeeze
This article will focus on the scan code for last week's System Trader article featuring the...
READ MORE
MEMBERS ONLY
Fed Minutes Spook Traders; Afternoon Selloff Spoils Big Rally
by Tom Bowley,
Chief Market Strategist, EarningsBeats.com
Market Recap for April 5, 2017
The release of the FOMC minutes was widely anticipated to see if there were any hidden nuggets of information from the last Fed meeting. Traders apparently were not happy that the Fed is discussing an unwinding of its balance sheet earlier than expected. That...
READ MORE
MEMBERS ONLY
Retailers Continue To Hold Back Consumer Discretionary Stocks
by Tom Bowley,
Chief Market Strategist, EarningsBeats.com
Market Recap for Tuesday, April 4, 2017
U.S. equities opened lower on Tuesday, but steadily marched higher throughout the day, finishing with mostly small gains across the board. The small cap Russell 2000 was an exception as it fell for a second consecutive session. That follows a winning streak...
READ MORE
MEMBERS ONLY
DP Alert: New BUY Signal for S&P 100 - S&P 600 (IJR) New ITTM Neutral Signal
by Erin Swenlin,
Vice President, DecisionPoint.com
The DecisionPoint Scoreboards updated with a new signal change today. The $OEX just managed a new Short-Term Trend Model BUY signal. The 5-EMA crossed above the 20-EMA triggering the signal. Right now price is running along the declining tops trendline. The PMO is no longer rising and that is a...
READ MORE
MEMBERS ONLY

PIPELINES ARE YEAR'S STRONGEST ENERGY GROUP -- ALERIAN MLP ETF COVERS THAT GROUP -- ONEOK AND MPLX ARE PIPELINE LEADERS -- TRANSCANADA CORP HOLDS 200-DAY LINE -- GLOBAL X MLP & ENERGY INFRASTRUCTURE ETF BOUNCES OFF 200-DAY LINE
by John Murphy,
Chief Technical Analyst, StockCharts.com
DOW JONES US PIPELINES INDEX IS TURNING UP ... My last two messages suggested that the energy sector was trying to stabilize near its 200-day average. That's based on the assumption that the price of oil is also bottoming. My Saturday message further suggested that oil service stocks were...
READ MORE
MEMBERS ONLY
Market Round Up Video Recording 2017-04-04
by Martin Pring,
President, Pring Research
Here is a link to this week's video.
Market RoundUp With Martin Pring 2017-04-04 from StockCharts.com on Vimeo.
Good luck and good charting,
Martin J. Pring
The views expressed in this article are those of the author and do not necessarily reflect the position or opinion of...
READ MORE
MEMBERS ONLY
Tesla Charged Up To Lead Automobiles
by Tom Bowley,
Chief Market Strategist, EarningsBeats.com
Market Recap for Monday, April 3, 2017
It was a rough day on Wall Street to open the month of April, but an afternoon rally did minimize any damage technically. The Russell 2000, the recent leader among our major indices, was trampled and lost 1.17%, while the Dow Jones...
READ MORE
MEMBERS ONLY
Correction Update - Plus Gold and Newmont are in Focus this Week
by Arthur Hill,
Chief Technical Strategist, TrendInvestorPro.com
.... Still in Corrective Mode
.... Newmont Mining Stalls with Pennant
.... Surge in TLT and Bounce in the Dollar Baffles Gold
.... Watch Baker Hughes and ExxonMobil for Clues on Energy Stocks
.... Kellogg and Monster Turn Lower within Downtrends
.... Pfizer and Thermo Fisher Correct after Surge ....
Still in Corrective Mode
I have a...
READ MORE
MEMBERS ONLY

MarketWatchers LIVE Kick-Off - Recap of Market Indicators
by Erin Swenlin,
Vice President, DecisionPoint.com
MarketWatchers LIVE kicked off today at noon EST! Tom Bowley and I host this new webcast Monday, Wednesday and Friday from 12:00p - 1:30p EST. Very soon we will have a public ChartList available for the show as well as a MarketWatchers LIVE blog that will recap some...
READ MORE
MEMBERS ONLY
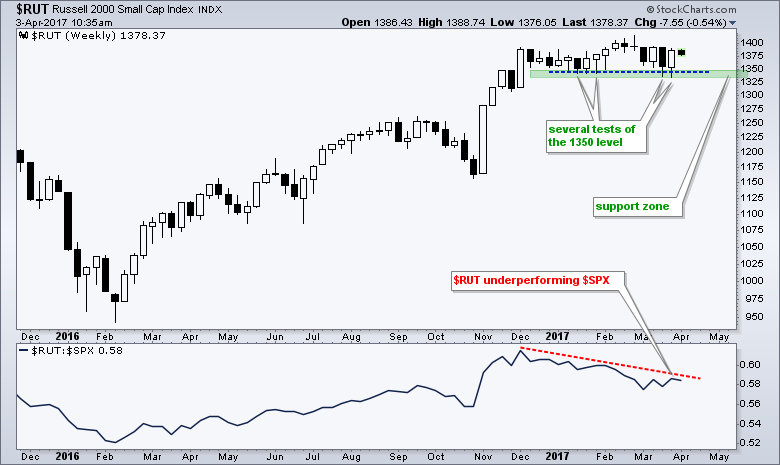
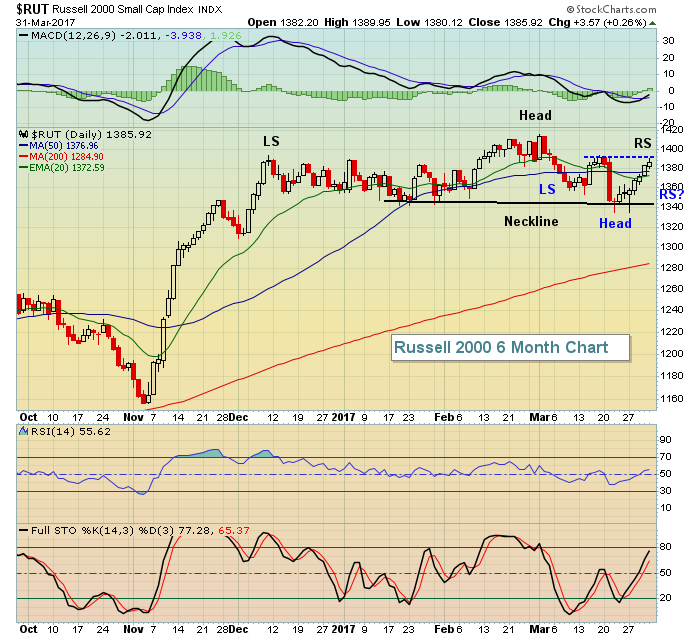
Russell 2000 Establishes a Clear Line-in-the-Sand $RUT
by Arthur Hill,
Chief Technical Strategist, TrendInvestorPro.com
The Russell 2000 surged last week and this bounce gives chartists a clear level to watch going forward. The chart below shows the small-cap index surging from early November to early December and then stalling between 1330 and 1390 for nine weeks. The index exceeded the early December high and...
READ MORE
MEMBERS ONLY
MarketWatchers LIVE Starts Today!!!
by Tom Bowley,
Chief Market Strategist, EarningsBeats.com
Special Announcement
I'm very excited to announce the beginning of our new StockCharts.com show featuring me and Erin Heim. We'll have fun covering the global markets, discussing stocks on the move, providing technical analysis education and highlighting the various tools available here at StockCharts, among...
READ MORE
MEMBERS ONLY
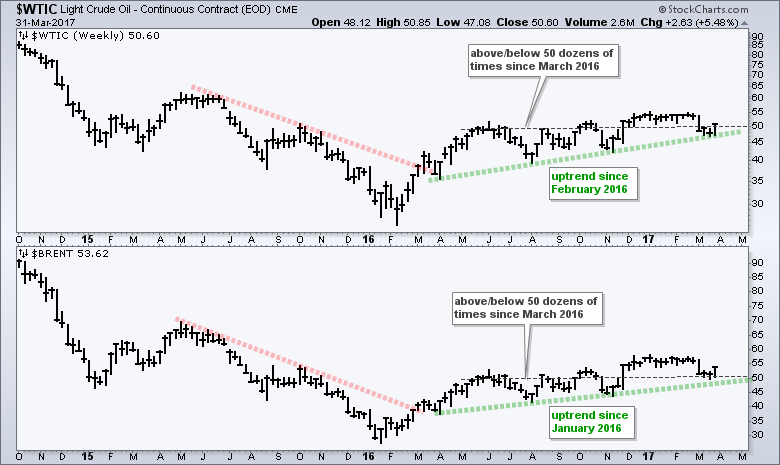
Mixing it up with Oil, Industrial Metals, 3 Emerging Market ETFs and a Kiwi
by Arthur Hill,
Chief Technical Strategist, TrendInvestorPro.com
.... WTI and Brent Battle the $50 Level
.... Gasoline Looks Poised to Continue Uptrend
.... Industrial Metals Remain in Uptrends
.... Silver Surges off Breakout Zone
.... Two Emerging Market ETFs in Asia
.... New Zealand ETF Bounces off Breakout Zone
.... Colombia ETF Breaks Out of Flag ....
I am going to mix it up a...
READ MORE
MEMBERS ONLY
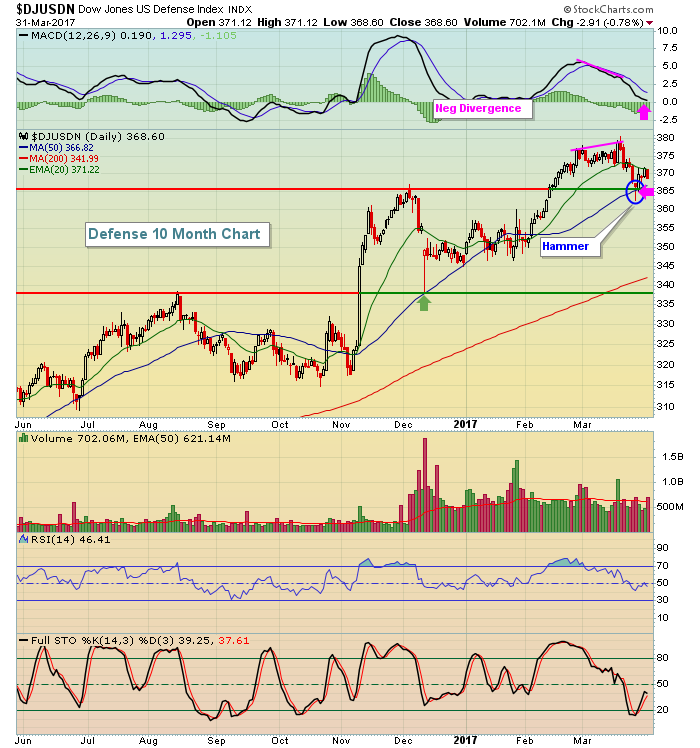
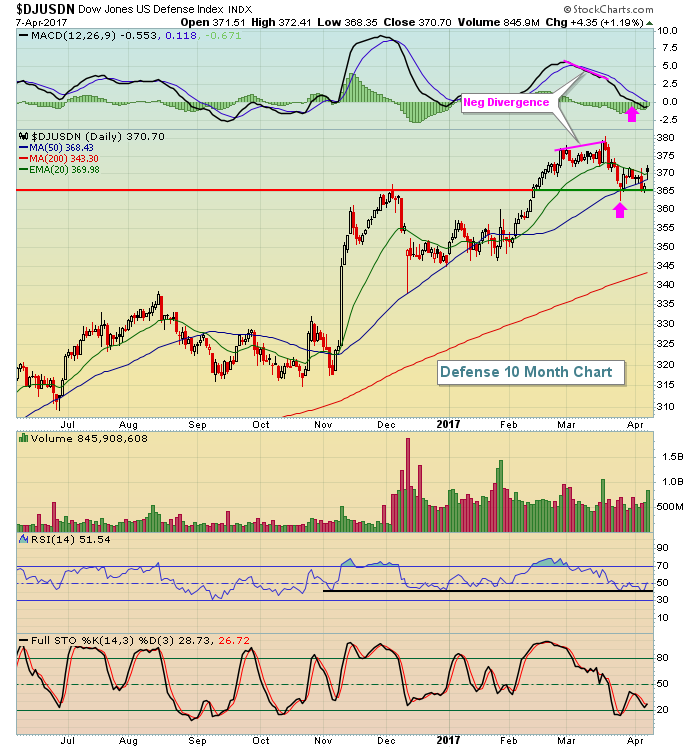
Defense Stocks Resolve Momentum Issues, Poised To Lead
by Tom Bowley,
Chief Market Strategist, EarningsBeats.com
Bullish rotation continues in most areas of the market and we saw a perfect example of that last week in the Dow Jones U.S. Defense Index ($DJUSDN). The DJUSDN had a HUGE month in February, gaining roughly 6.5% in that month alone. That swamped the benchmark S&...
READ MORE
MEMBERS ONLY
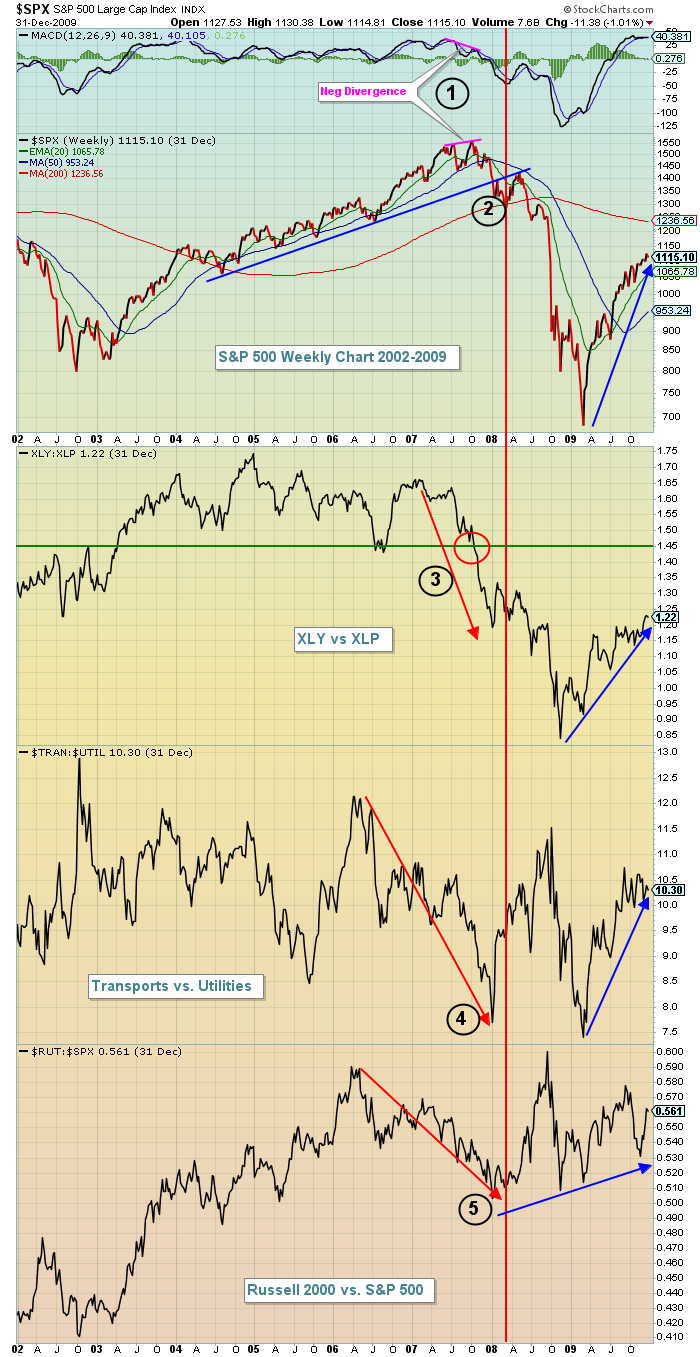
5 Reasons Why This Isn't 2007
by Tom Bowley,
Chief Market Strategist, EarningsBeats.com
Many market pundits on CNBC continue to predict a market top, discussing how we've run too far too fast and that valuations are too high and blah, blah, blah. Fear sells and CNBC is all about their ratings and advertisements. There's an occasional nugget of solid...
READ MORE
MEMBERS ONLY
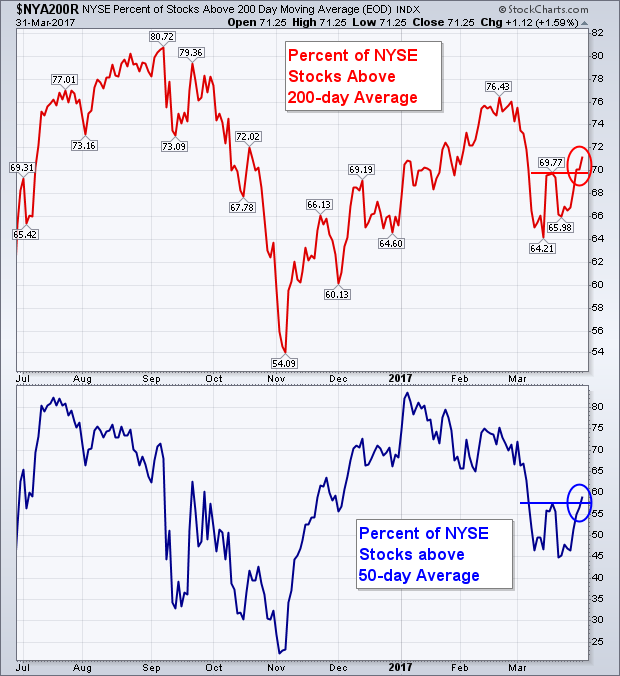
Percent of Stocks Over 200-Day Average Turns Back Up
by John Murphy,
Chief Technical Analyst, StockCharts.com
My last two messages have stressed the importance of the 200-day moving average. It's what separates uptrends from downtrends. In order to sustain a bull market, more stocks have be above their 200-day average than below it. And that is currently the case. The red line in Chart...
READ MORE
MEMBERS ONLY
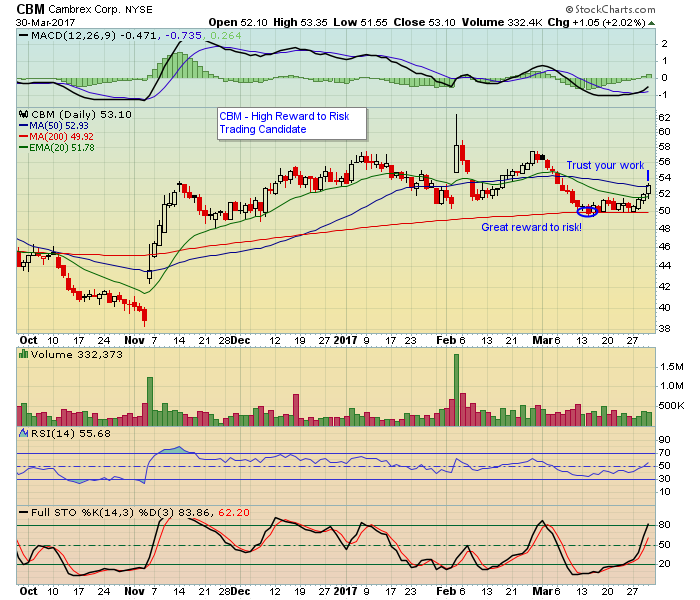
Trust Your Good Work

by John Hopkins,
President and Co-founder, EarningsBeats.com
If you trade stocks you're going to run into situations where you question whether or not you are making good decisions. This could include identifying entry levels and setting price targets and stop losses. It could also include pulling the trigger on a trade, taking a loss or...
READ MORE
MEMBERS ONLY

BUILDING MATERIALS STOCKS MAY ALSO BE BOTTOMING -- MARTIN MARIETTA AND VULCAN MATERIALS FIND SUPPORT NEAR 200-DAY AVERAGES -- OIL SERVICE STOCKS LEAD ENERGY SECTOR HIGHER AND SHOW BETTER RELATIVE STRENGTH
by John Murphy,
Chief Technical Analyst, StockCharts.com
MARTIN MARIETTA MATERIALS BOUNCES OFF 200-DAY AVERAGE... My Thursday message showed three stock groups that had fallen to their 200-day averages and were starting to stabilize. They included commodity-related groups like energy and metals and mining ETFs. They also included heavy construction stocks like Fluor (FLR) and Jacobs Engineering (JEC)...
READ MORE
MEMBERS ONLY
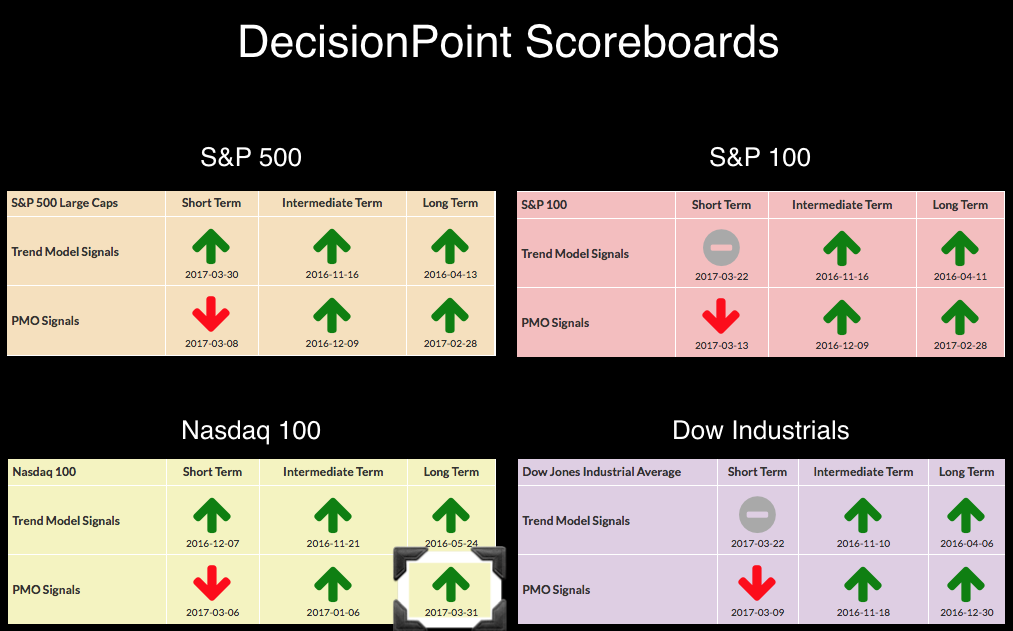
Monthly PMO BUY Signal for Nasdaq 100
by Erin Swenlin,
Vice President, DecisionPoint.com
Patience was rewarded today as the Long-Term Price Momentum Oscillator (PMO) confirmed a BUY signal that had been pending most of the month. We don't log new monthly PMO signals until the chart goes "final" on the last trading day of the month. Similarly, we don&...
READ MORE
MEMBERS ONLY

DecisionPoint Weekly Wrap 3/31/17
by Carl Swenlin,
President and Founder, DecisionPoint.com
*** IMPORTANT NOTE: We are making some changes to our DecisionPoint blogs and webinars starting on April 1st. Click here for more details. ***
The DecisionPoint Weekly Wrap presents an end-of-week assessment of the trend and condition of the stock market (S&P 500), the U.S. Dollar, Gold, Crude Oil,...
READ MORE