MEMBERS ONLY

Finding New Highs and Measuring Trend Strength with Stochastics

by Arthur Hill,
Chief Technical Strategist, TrendInvestorPro.com
The Stochastic Oscillator is best known as a momentum indicator, but a careful look at the formula reveals that it can also be used to measure trend strength. As noted in a previous article on MACD, it is imperative that chartists fully understand an indicator to get the most out...
READ MORE
MEMBERS ONLY
35 Years and 5 Key Personal Investment Passages

by Gatis Roze,
Author, "Tensile Trading"
I stumbled into a gift shop full of tchotchkes today. It was one of those retailers with endless trinkets and specialty items that encourage you to revisit your youth and marvel at someone else’s creativity. I became fascinated by one of those intricately detailed Russian “Matryoshka” – the wooden nesting...
READ MORE
MEMBERS ONLY
Banks At Critical Resistance Short-Term; Railroads Strengthening

by Tom Bowley,
Chief Market Strategist, EarningsBeats.com
Market Recap for Thursday, March 30, 2017
It was another strong day on Wall Street Thursday as six sectors advanced while only three declined - utilities (XLU, -0.78%), consumer staples (XLP, -0.20%) and energy (XLE, -0.02%). The four "power" sectors, the aggressive groups, finished 1-2-3-4...
READ MORE
MEMBERS ONLY

Weekly Market Review & Outlook (with Video) - Is One Week of Risk-On Enough?
by Arthur Hill,
Chief Technical Strategist, TrendInvestorPro.com
.... Is One Week of Risk-On Enough?
.... Breadth Underwhelms on latest Surge
.... SPY Remains in Corrective Mode
.... IJR Gets a Mini-Breakout within a Consolidation
.... Another New High for QQQ, but..,
.... Five Sectors Still Holding Up
.... Finance and Regional Bank ETFs Reverse
.... Watch TLT and the 10-yr Yield for Clues
.... Watch GE...
READ MORE
MEMBERS ONLY
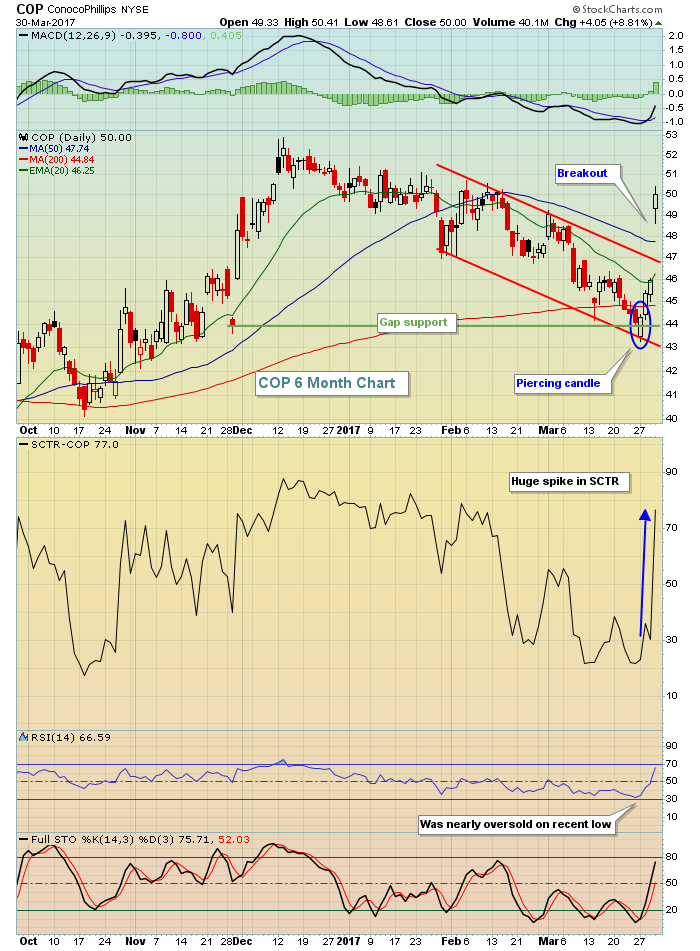
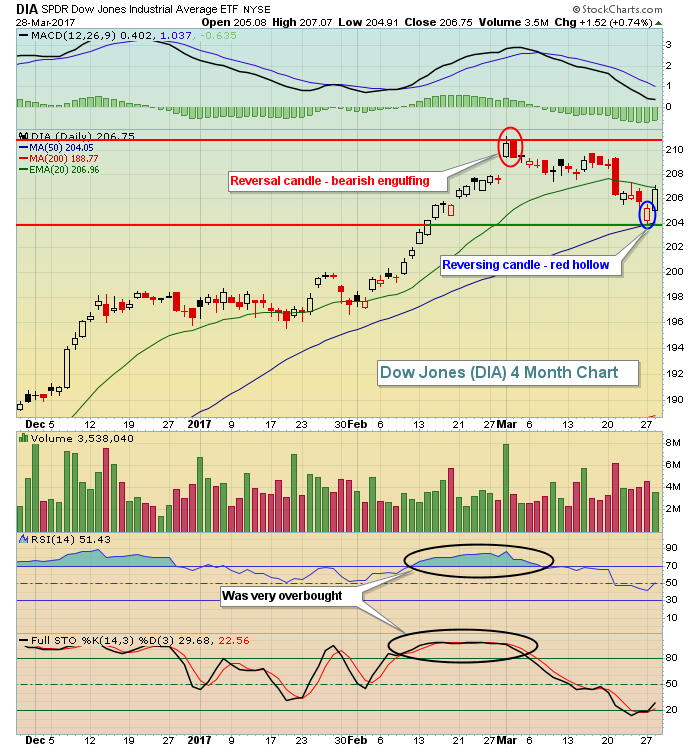
ConocoPhillips Breaks Downtrend; SCTR Soars
by Tom Bowley,
Chief Market Strategist, EarningsBeats.com
ConocoPhillips (COP) saw its SCTR soar nearly 47 points after an 8.81% increase in its stock price broke its four month downtrend. COP's strength began earlier this week on a reversing candle at gap support and culminated with today's breakout. Here's the chart:...
READ MORE
MEMBERS ONLY

Short-Term Trend Model/PMO Scan from 3/29 DecisionPoint Report Webinar - James River Group (JRVR) Analyzed

by Erin Swenlin,
Vice President, DecisionPoint.com
Yesterday during the DecisionPoint Report webinar I decided to run a short-term scan and run through the results with my viewers. You can find the webinar here. I promised to write a blog article with the text of the scan so that Extra members can copy and paste directly into...
READ MORE
MEMBERS ONLY

HEAVY CONSTRUCTION AND MINING STOCKS TEST 200-DAY AVERAGES -- SO ARE ENERGY SHARES AS CRUDE OIL STRENGTHENS -- % OF NYSE STOCKS ABOVE 200-DAY AVERAGE REMAINS STRONG -- CONSUMER DISCRETIONARY SPDR HITS NEW RECORD -- SMALL CAPS OUTPACE LARGE CAPS

by John Murphy,
Chief Technical Analyst, StockCharts.com
HEAVY CONSTRUCTION INDEX BOUNCES OFF 200-DAY AVERAGE... This week's rebound by major stock indexes off their 50-day averages has been encouraging. So is the fact that several economically-sensitive stock groups are finding support at their 200-day lines. Chart 1 shows the Dow Jones US Heavy Construction Index bouncing...
READ MORE
MEMBERS ONLY

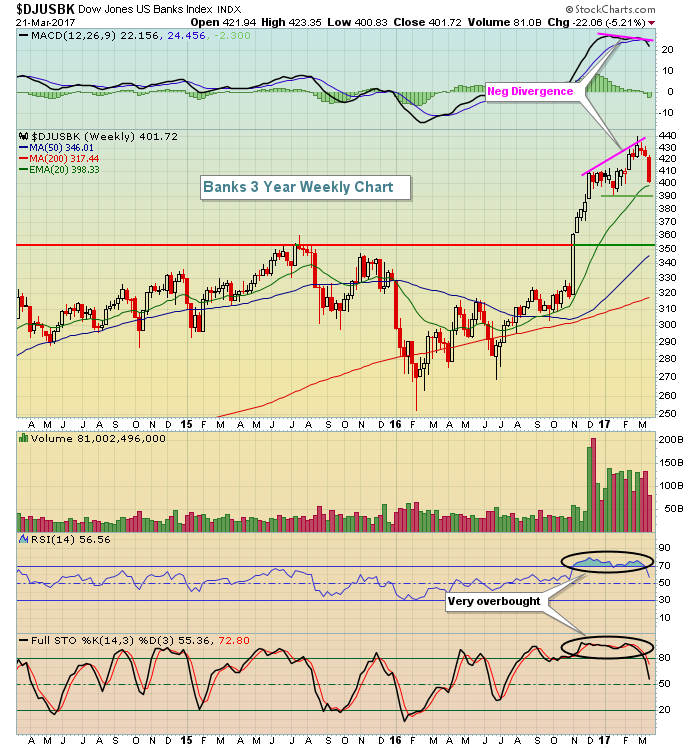
Financial Sector Update

by Bruce Fraser,
Industry-leading "Wyckoffian"
We looked at the Technology Sector (XLK) in the last post (click here for a link). Another very important market sector is the Financials. Here is a high-altitude view of the Financial Sector from a Wyckoffian perspective.
(click on chart for active version)
The Financial Select Sector ETF has a...
READ MORE
MEMBERS ONLY

SystemTrader - Testing a Bollinger Band Squeeze System for Stocks in the S&P 1500
by Arthur Hill,
Chief Technical Strategist, TrendInvestorPro.com
..... A Bollinger Band Squeeze System
.... Trend Filters and Trading Signals
.... JPM with a Winner and a Loser
.... XOM with Two Losing Trades
.... System Ground Rules
.... Backtest Results for S&P 1500
.... Conclusions - Caveat Emptor! ....
A Bollinger Band Squeeze System
Today we are going to look at a system...
READ MORE
MEMBERS ONLY
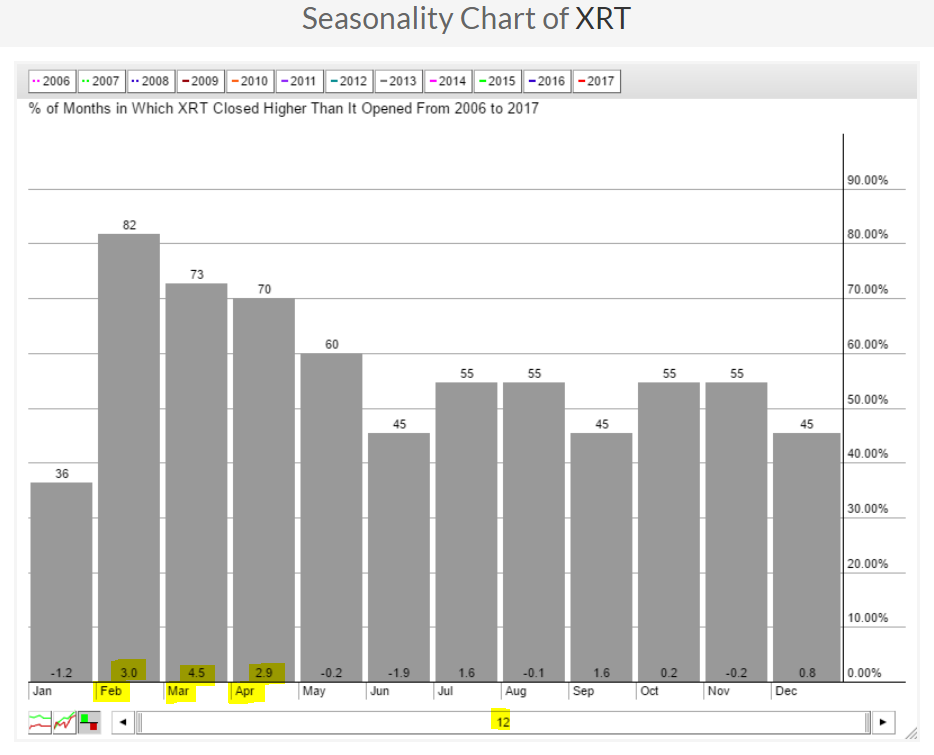
Retailers Lead Bifurcated Rally; What We Should Look For In April
by Tom Bowley,
Chief Market Strategist, EarningsBeats.com
Market Recap for Wednesday, March 29, 2017
We haven't discussed leadership from retail (XRT) in quite some time, but we saw many retailers outperforming on Wednesday. The obvious question is whether this leadership will continue for an extended period. Well, first keep in mind that retail typically excels...
READ MORE
MEMBERS ONLY

Monday Was A Very Important Inflexion Point For Several Markets

by Martin Pring,
President, Pring Research
* Two short-term indicators that can support higher prices
* Global equities ex the US are poised for a mega breakout
* Three markets poised for a major breakout
* Commodities coming to life?
It’s a well-known axiom on Wall Street that it’s not the news that is important but the market’...
READ MORE
MEMBERS ONLY
Excellent Market Leadership Snaps Dow's 8 Day Losing Streak
by Tom Bowley,
Chief Market Strategist, EarningsBeats.com
Market Recap for Tuesday, March 28, 2017
The bullish action couldn't have been much better on Tuesday. Money clearly rotated back to aggressive areas of the market as the Dow Jones advanced for the first time in the last nine trading sessions. This bullish rotation will be key...
READ MORE
MEMBERS ONLY
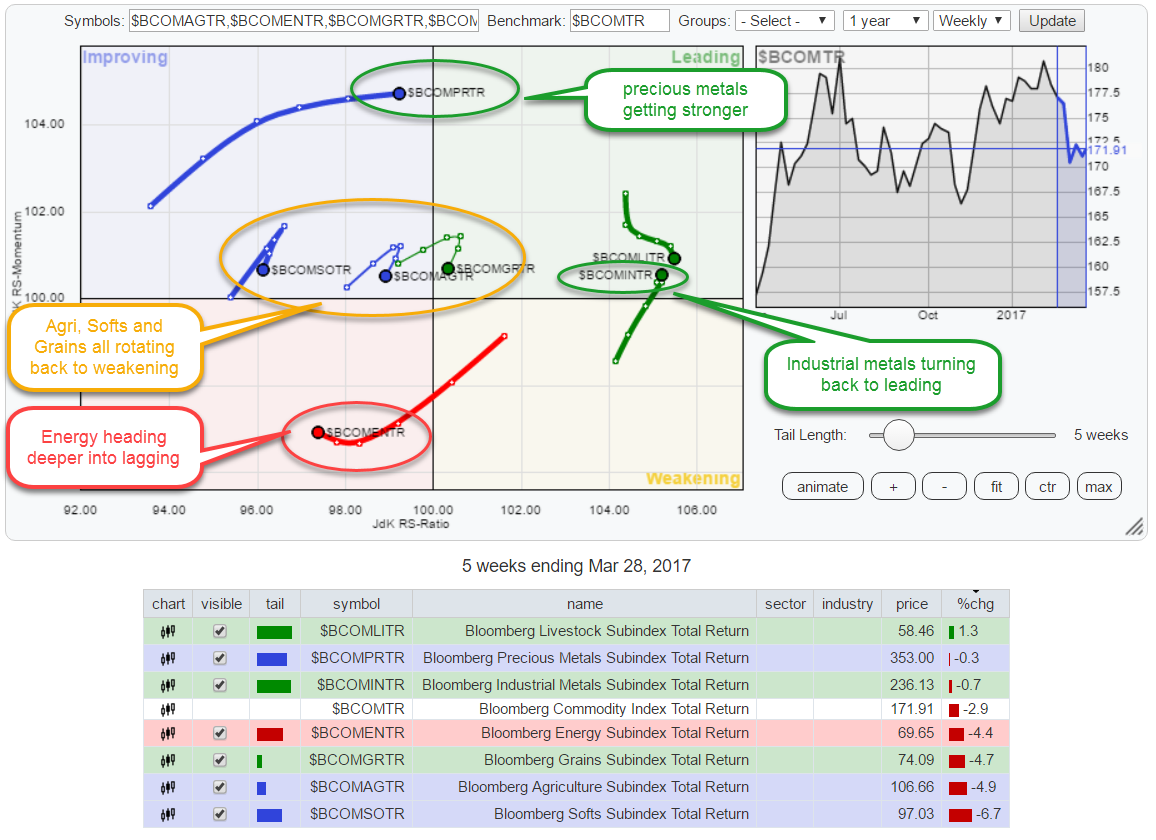
Precious metals shining on Relative Rotation Graph

by Julius de Kempenaer,
Senior Technical Analyst, StockCharts.com
Most of the time Relative Rotation Graphs are used to visualize stock-related universes but please "Don't Ignore the fact" that RRGs can be used to visualize the rotation of any universe that holds comparable securities.
In the chart above I have plotted the rotations for all...
READ MORE
MEMBERS ONLY

Net Advances-Declines Indicators Rock the Ultra-Short Term
by Erin Swenlin,
Vice President, DecisionPoint.com
The DecisionPoint universe is evolving. As many of you are aware, some of our indicators will be retired. Two of the indicators many are concerned about losing are the Climactic Volume Indicator and Participation Index. Writing a blog everyday and doing regular webinars during the week tends to keep my...
READ MORE
MEMBERS ONLY

STOCKS REBOUND FROM SUCCESSFULL TEST OF 50-DAY AVERAGES -- ECONOMICALLY-SENSITIVE STOCKS LEAD WHILE STAPLES AND UTILITIES LAG -- BOND PRICES WEAKEN WHILE HIGH YIELD BONDS REBOUND -- GOLD AND THE EURO MEET RESISTANCE AT 200-DAY LINES AS DOLLAR REBOUNDS
by John Murphy,
Chief Technical Analyst, StockCharts.com
STOCK ETFS REBOUND OFF 50-DAY AVERAGE ... Yesterday's message showed major stock indexes stabilizing at their 50-day averages. Today, they're rebounding impressively today off that rising support line. Chart 1 shows the Dow Jones Industrial SPDR (DIA) having its best day in a month. Chart 2 shows...
READ MORE
MEMBERS ONLY
Dow Jones Falls For 8th Straight Day, Tests 50 Day
by Tom Bowley,
Chief Market Strategist, EarningsBeats.com
Market Recap for Monday, March 27, 2017
It was yet another bifurcated day in the market with the Dow Jones losing ground for the eighth straight session and the S&P 500 joining the Dow in negative territory. For the second consecutive session, the NASDAQ and Russell 2000 bucked...
READ MORE
MEMBERS ONLY
Using the 50-day SMA to Compare Performance and Price Levels
by Arthur Hill,
Chief Technical Strategist, TrendInvestorPro.com
.... SPY Remains the Key Yardstick
.... Using the 50-day SMA to Compare Charts
.... IJR Attempts another Oversold Bounce
.... Banking Stocks Hit Support Zones (BAC, C, JPM, WFC, STT)
.... Watch TLT and $TNX for Clues on XLF
.... Technology is Still the Strongest Sector (MSFT, NVDA, QLYS) ....
SPY Remains the Key Yardstick
Stocks...
READ MORE
MEMBERS ONLY

STOCK INDEXES TEST 50-DAY LINES -- BOND PRICES TEST OVERHEAD RESISTANCE -- DOLLAR FALLS TO 200-DAY LINE -- GOLD REACHES RESISTANCE -- MARKETS HAVE REACHED INFLECTION POINT WHICH WILL DETERMINE IF THE TRUMP RALLY IS OVER OR JUST PAUSING
by John Murphy,
Chief Technical Analyst, StockCharts.com
MARKET INDEXES TRY TO FIND SUPPORT AT THEIR 50-DAY LINES... Today's lower open pushed several stock indexes down to their 50-day averages. Chart 1 shows the Dow Industrials trying to regain lost ground in afternoon trading. Chart 2 shows the S&P 500 trying to stay above...
READ MORE
MEMBERS ONLY
Dollar Threatening A Major Breakdown, Gold A Beneficiary
by Tom Bowley,
Chief Market Strategist, EarningsBeats.com
Market Recap for Friday, March 24, 2017
Friday was another day of bifurcated action with both the NASDAQ and Russell 2000 higher while the Dow Jones and S&P 500 lagged and finished lower. Sector performance wasn't any better with four sectors higher and five lower. To...
READ MORE
MEMBERS ONLY
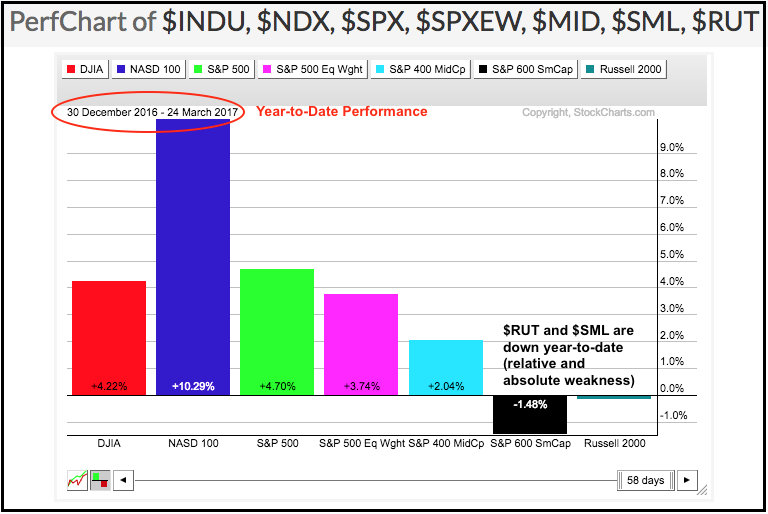
Small-caps Turn Negative Year-to-Date
by Arthur Hill,
Chief Technical Strategist, TrendInvestorPro.com
Small-caps are still leading the market since early November, but they are lagging in 2017 as year-to-date performance turned negative. The PerfChart below shows year-to-date performance for seven major stock indexes. The Nasdaq 100 is up around 10% and leading the pack by a wide margin. The Dow Industrials, S&...
READ MORE
MEMBERS ONLY
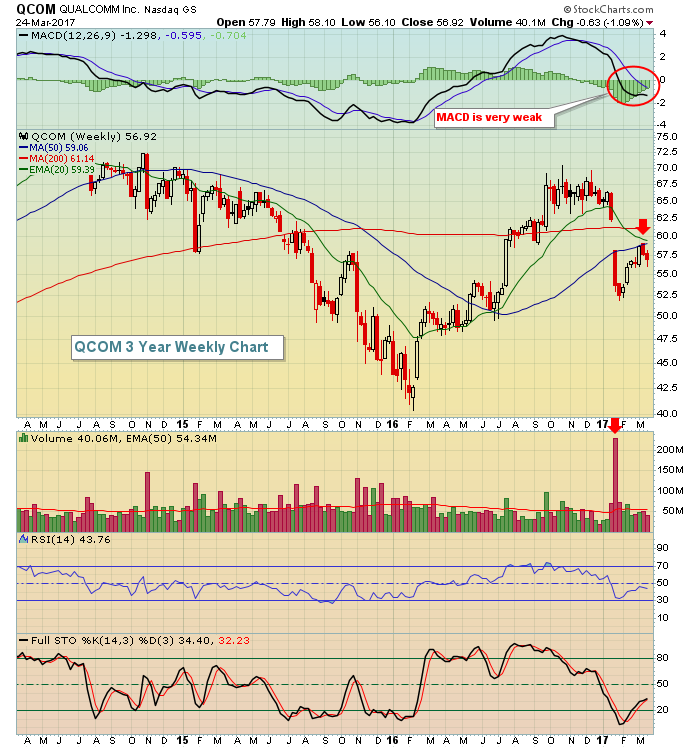
There's Not Much To Like About This NASDAQ 100 Stock
by Tom Bowley,
Chief Market Strategist, EarningsBeats.com
Stocks that combine poor fundamentals, technicals and seasonal weakness are probably stocks to avoid. QUALCOMM Inc. (QCOM) is one such stock as it was hit in January with multiple lawsuits and Apple's (AAPL) suit against QCOM really damaged the QCOM chart technically. Here's a look at...
READ MORE
MEMBERS ONLY

Animal Spirits
by Bruce Fraser,
Industry-leading "Wyckoffian"
Leadership in the Technology Sector is generally a very good sign for the entire stock market. It bodes well for the market when technology stocks, as a group, are leadership as a rally starts. Speculative animal spirits are heightened by the emerging leadership of the Technology Sector. Conversely when technology...
READ MORE
MEMBERS ONLY

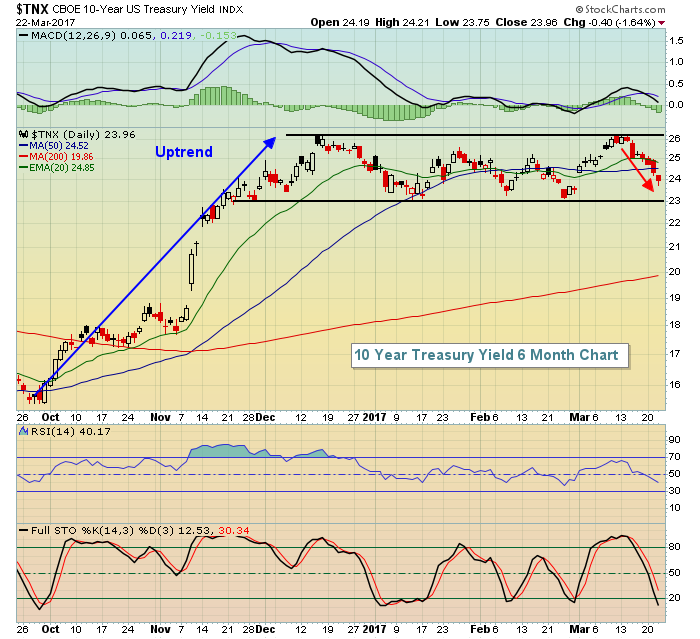
What Are Bond Market Intermarket Relationships Saying About Inflation?
by Martin Pring,
President, Pring Research
* The TIP/TLT Ratio reflects swings in commodity prices
* Watch that Technology/Staples ratio for a possible bullish breakout
* US breaking down against Global Equities
The TIP/TLT ratio reflects swings in commodity prices
When bond yields are compared to commodity prices there is definitely a connection, as we can...
READ MORE
MEMBERS ONLY
Video - Weekly Market Review & Outlook - The Art of Fibonacci Applied to SPY
by Arthur Hill,
Chief Technical Strategist, TrendInvestorPro.com
----- Video Link ----- Art's Charts ChartList (updated 25-Mar) -----
Note that the Art's Charts ChartList has been updated with 30 annotated charts covering the industry group ETFs. The outline above is for the video and I cover these industry group ETFs in the video.
See...
READ MORE
MEMBERS ONLY
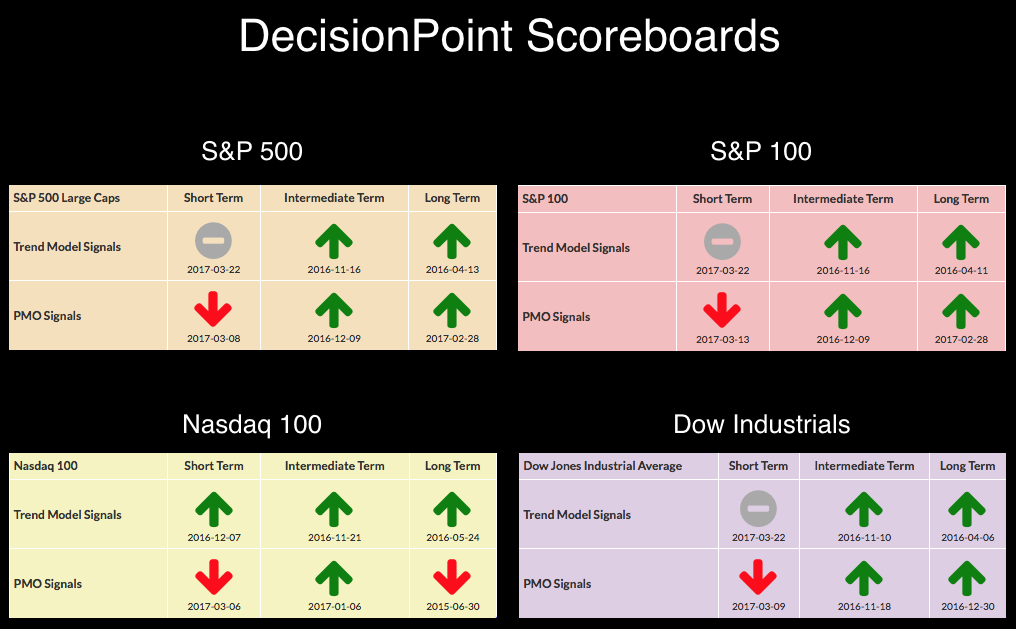
DecisionPoint Weekly Wrap 3/24/17

by Carl Swenlin,
President and Founder, DecisionPoint.com
*** IMPORTANT NOTE: We are making some changes to our DecisionPoint blogs and webinars starting on April 1st. Click here for more details. ***
Welcome to the DecisionPoint Weekly Wrap, where I make an end-of-week assessment of the internal condition, and trend of the stock market (S&P 500), the U....
READ MORE
MEMBERS ONLY

Charts I'm Stalking: Action Practice #13
by Gatis Roze,
Author, "Tensile Trading"
For those readers who embrace my CORE and EXPLORE approach (this is actually my version of John Bogle’s approach) with respect to Asset Allocation, you can see why I suggest considering country funds for a small percentage of your EXPLORE portfolio. Country funds fulfill the cardinal rule of diversification...
READ MORE
MEMBERS ONLY

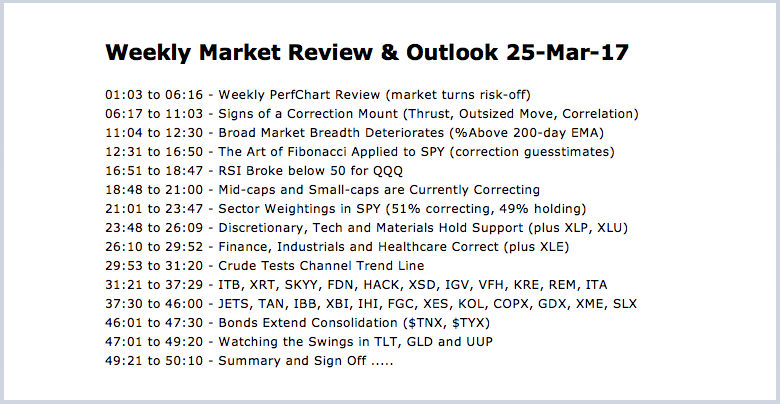
Weekly Market Review & Outlook 24-Mar-17 - Correction Targets for the Major Index ETFs
by Arthur Hill,
Chief Technical Strategist, TrendInvestorPro.com
.... Signs of a Correction Mount
.... Broad Market Breadth Deteriorates
.... The Art of Fibonacci Applied to SPY
.... RSI Breaks below 50 for QQQ
.... Mid-caps and Small-caps are Currently Correcting
.... Discretionary, Tech and Materials Hold Support
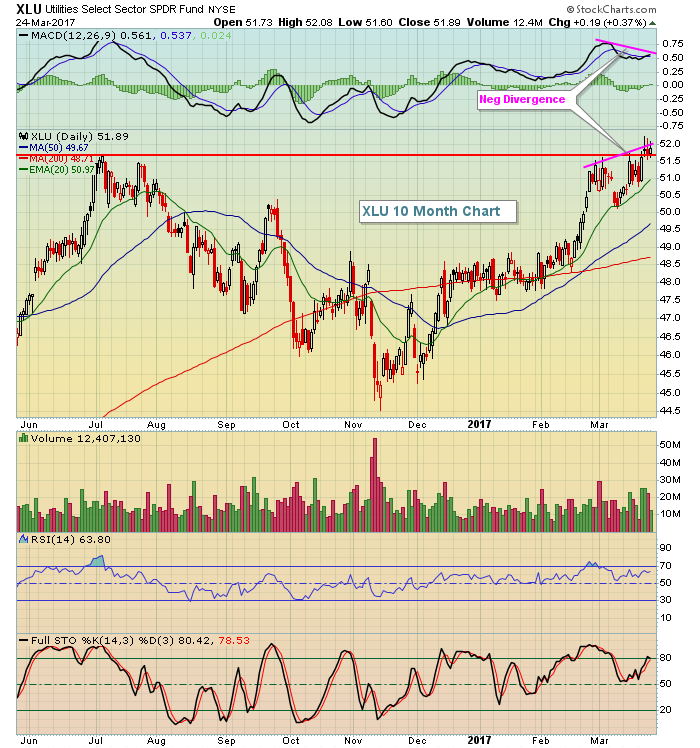
.... Staples and Utilities Lead with New Highs
.... Finance, Industrials and Healthcare Correct
.... Energy Remains the Weakest...
READ MORE
MEMBERS ONLY
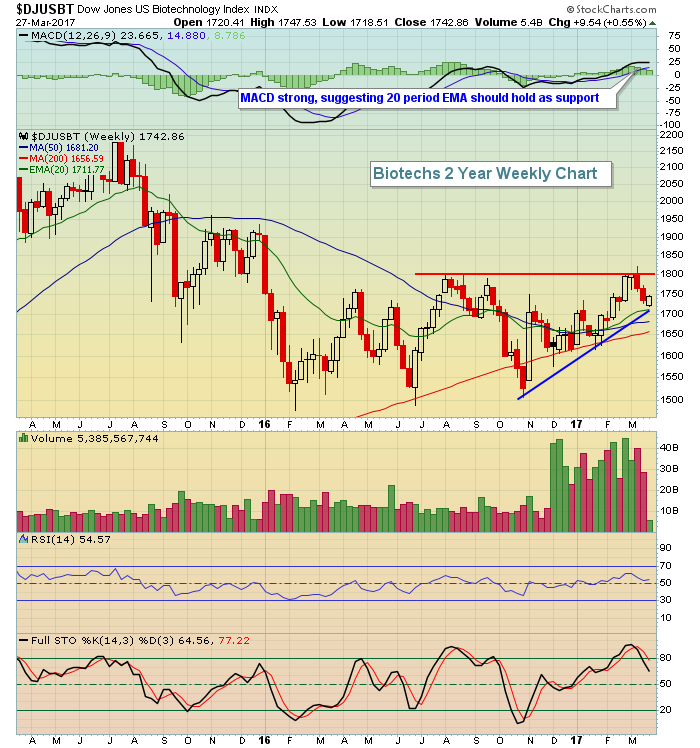
Biotechnology's Recent Failure Is Disappointing But All Hope Is Not Lost
by Tom Bowley,
Chief Market Strategist, EarningsBeats.com
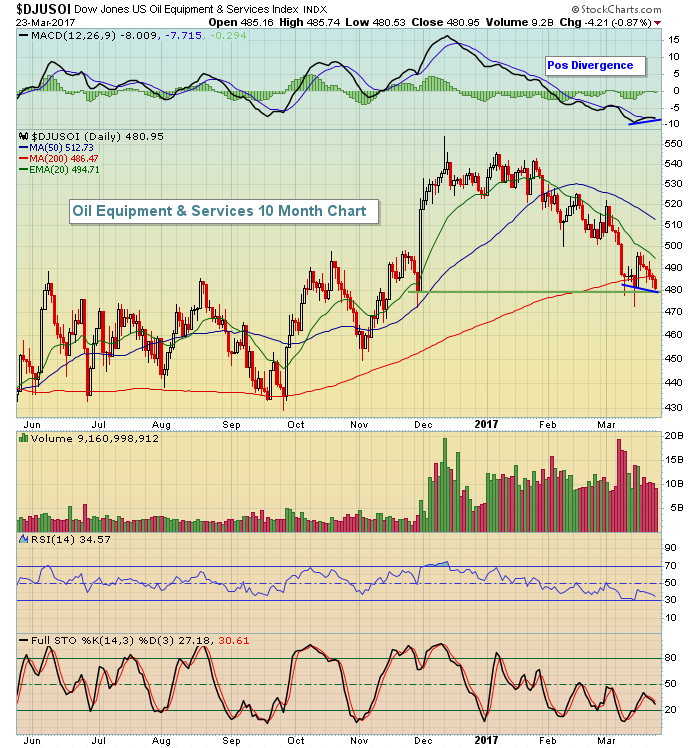
Market Recap for Thursday, March 23, 2017
The Russell 2000 gained on Thursday while the other major indices declined slightly due to a selloff in the final three hours. Six of nine sectors finished in negative territory, led by energy (XLE, -0.41%). Oil & equipment services ($DJUSOI) led the...
READ MORE
MEMBERS ONLY
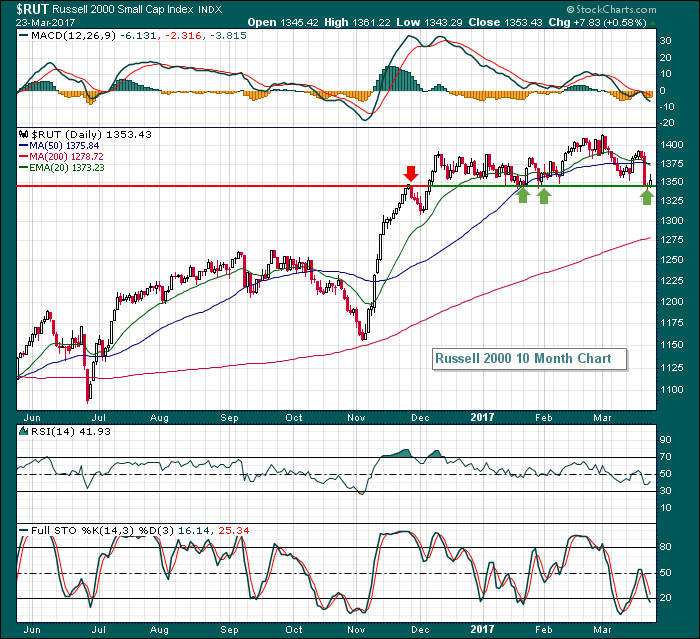
Small Caps Hang Onto Key Price Support
by Tom Bowley,
Chief Market Strategist, EarningsBeats.com
The Russell 2000 has been under selling pressure but is now testing key support on both its daily and weekly charts. There is a slight negative divergence that's present on its weekly chart, so that would be a signal of possible weakness ahead. The good news is that...
READ MORE
MEMBERS ONLY

FALLING DOLLAR CONTRIBUTES TO RISING EMERGING MARKET CURRENCIES AND STOCKS -- MEXICAN PESO AND STOCK ETF ALSO GAIN GROUND -- A RISING YUAN IS HELPING BOOST CHINESE STOCKS -- STOCK GAINS EVAPORATE ON POSTPONEMENT OF HEALTHCARE VOTE
by John Murphy,
Chief Technical Analyst, StockCharts.com
EMERGING MARKET CURRENCIES SUPPORT RISING STOCKS... Previous messages have shown the rise in emerging market stocks, partially owing to the drop in the U.S. dollar. The same can be said of EM currencies. The red line in Chart 1 shows Emerging Markets iShares (EEM) rising to the highest level...
READ MORE
MEMBERS ONLY
SystemTrader - Testing Filters for Signal Line and Centerline Crosses using the PPO (MACD)
by Arthur Hill,
Chief Technical Strategist, TrendInvestorPro.com
.... Filtering out PPO Signals
.... MACD versus the Percentage Price Oscillator
.... Testing Signal Line Crossovers
.... Adding Some Filters to the PPO Signals
.... Adding Focus to the Portfolio
.... Conclusions - Caveat Emptor! ....
This System Trader article is a follow up to my ChartWatchers post on MACD. I will test the Percentage Price...
READ MORE
MEMBERS ONLY
Transports Mixed Technically As Market Rally Stalls
by Tom Bowley,
Chief Market Strategist, EarningsBeats.com
Market Recap for Wednesday, March 22, 2017
A strong technology sector (XLK, +0.63%) helped to lift the NASDAQ to moderate gains while the other major U.S. indices waffled near the flat line on Wednesday, a day after equities experienced their sharpest selling of 2017. From a bullish perspective,...
READ MORE
MEMBERS ONLY
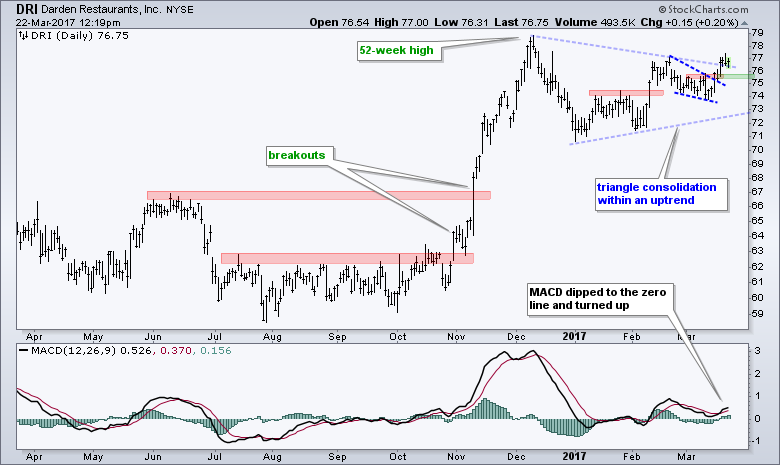
Darden Defies with a Triangle Breakout
by Arthur Hill,
Chief Technical Strategist, TrendInvestorPro.com
Stocks got hammered on Tuesday with the S&P 500 falling the most this year (1.24%) and breaking below its March low. Even with the seemingly big decline, the index is still just 2.25% from an all time high. Darden Restaurants caught my attention because it did...
READ MORE
MEMBERS ONLY
U.S. Stocks Tumble Most Since September
by Tom Bowley,
Chief Market Strategist, EarningsBeats.com
Market Recap for Tuesday, March 21, 2017
After months of steady gains, Tuesday's action was painful with eight of nine sectors lower - the utilities sector (XLU, +1.39%) was the lone exception. Further, our major indices were led to the downside by the more aggressive Russell 2000,...
READ MORE
MEMBERS ONLY

Is the Correction Finally Here or is this Just Noise?
by Arthur Hill,
Chief Technical Strategist, TrendInvestorPro.com
.... Breadth Indicators Plunge to Extremes
.... Finance, Industrials and Tech Get Hit Hard
.... SPY has not Done This since October
.... Small-cap Correlation Turns Down
.... RSI Breaks Key Level for QQQ
.... The Bottom Line ....
What a difference a day makes - 24 little hours. There is selling pressure and then there is...
READ MORE
MEMBERS ONLY

MAJOR STOCK INDEXES SUFFER BIGGEST DROP THIS YEAR -- SMALL CAPS AND TRANSPORTS LOOK EVEN WORSE -- BANKS LEAD FINANCIALS LOWER ON FALLING BOND YIELDS -- FALLING DOLLAR BOOSTS GOLD -- EURO NEARS TEST OF FEBRUARY HIGH
by John Murphy,
Chief Technical Analyst, StockCharts.com
STOCK ETFS SELLOFF... The market is suffering its worst day this year. Chart 1 show the PowerShares Nasdaq QQQ experiencing a downside reversal day after hitting a record high this morning. Its 14-day RSI has fallen out of overbought territory over 70 for the first time since December which shows...
READ MORE
MEMBERS ONLY
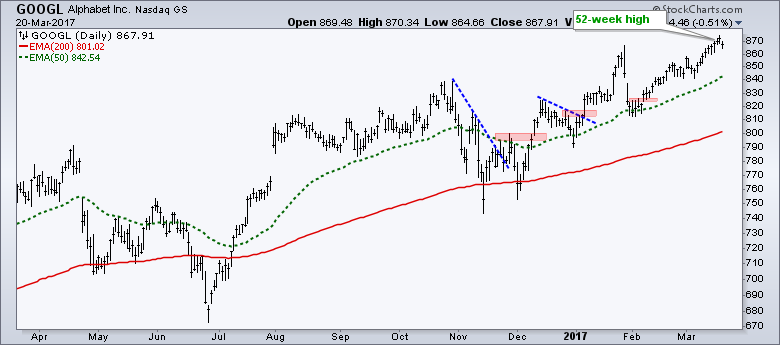
Strong Uptrends Continue in the Fab Five - Three Industrial Stocks to Watch
by Arthur Hill,
Chief Technical Strategist, TrendInvestorPro.com
.... The Fab Five Remain Strong (GOOGL, AAPL, FB, MSFT, AMZN)
.... Equinix Looks Set to Continue Uptrend
.... Think Market, Sector, Group and Trend First (NVDA)
.... A Payment Processor, A Big Data Player and an IoT Leader (PYPL, TDC, XLNX)
.... Crown Castle, Zoetis and General Cable Turn Up (CCI, ZTS, BGC)
.... Watch...
READ MORE
MEMBERS ONLY
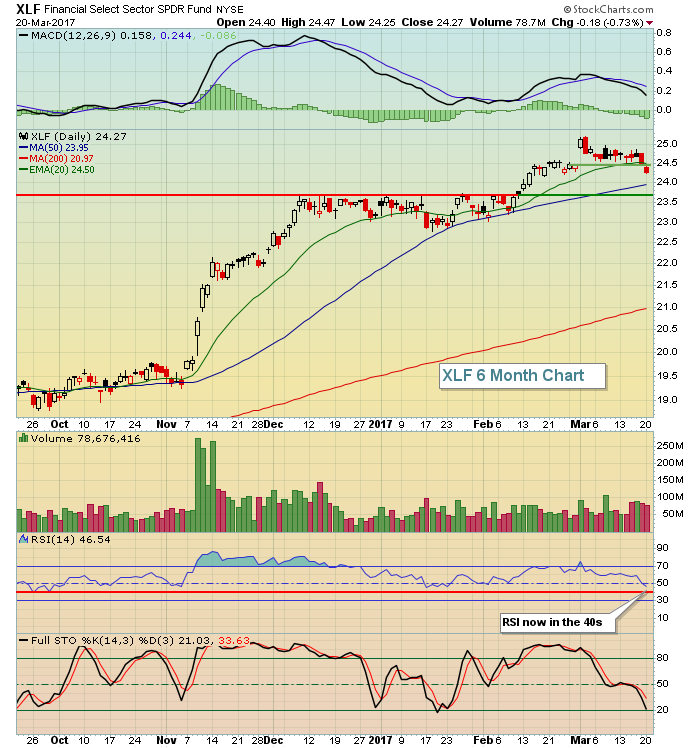
NASDAQ's Negative Divergence Holding The Market At Bay
by Tom Bowley,
Chief Market Strategist, EarningsBeats.com
Market Recap for Monday, March 20, 2017
Financials (XLF, -0.73%) led the market lower on Monday as short-term price and gap support was lost on one of the best performing sectors since the early November run. While I don't view this as a big technical development in...
READ MORE
MEMBERS ONLY
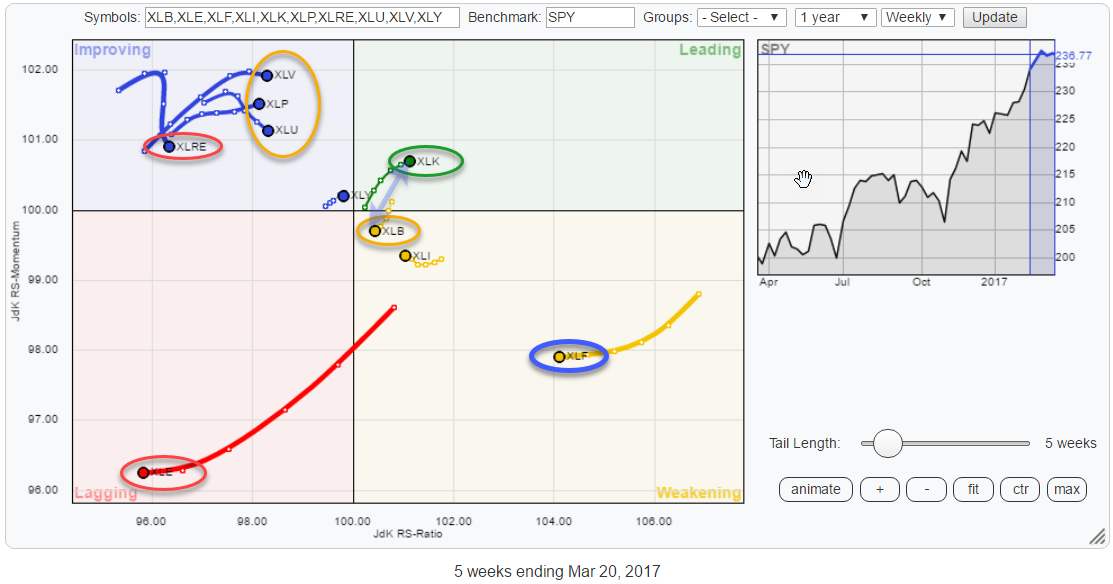
Three breaks and you're out .....
by Julius de Kempenaer,
Senior Technical Analyst, StockCharts.com
This post looks at the rotation of US sectors again. The Relative Rotation Graph above holds the ETFs that track the performance of US sectors.
Pretty much immediately the attention goes out to the Energy sector (XLE) and the Financials sector (XLF) as they stand out because of the length...
READ MORE
MEMBERS ONLY
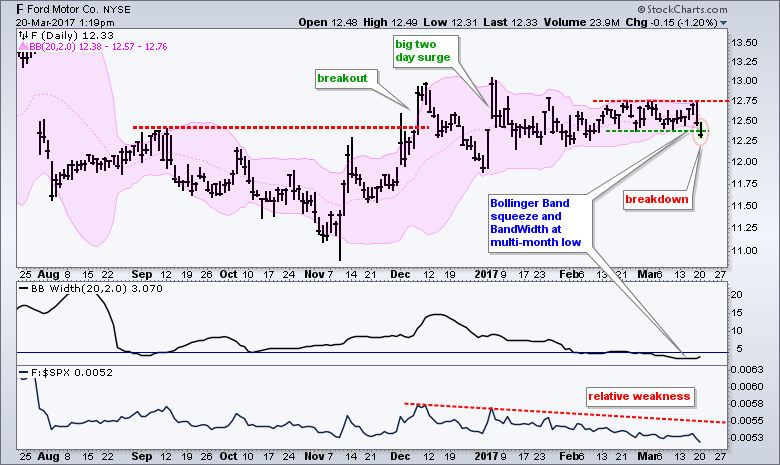
Ford Breaks Bollinger Band after a Long Squeeze
by Arthur Hill,
Chief Technical Strategist, TrendInvestorPro.com
Ford (F) looked as if it was simply consolidating after a sharp surge and breakout, but this consolidation strung out and the stock broke to the downside on Monday. The chart shows Ford breaking above the September high with a surge in November-December. The stock fell back after this breakout...
READ MORE