MEMBERS ONLY
Tires Gaining Traction, Ready To Put Your Portfolio In Overdrive

by Tom Bowley,
Chief Market Strategist, EarningsBeats.com
Market Recap for Friday, March 17, 2017
It was another bifurcated day in the market on Friday as rotation continued. The Dow Jones and S&P 500 both posted minor losses while the Russell 2000 led with a 0.40% gain. Utilities (XLU, +0.60%) and industrials (XLI, +0....
READ MORE
MEMBERS ONLY

My 100th Blog Article

by Greg Morris,
Veteran Technical Analyst, Investor, and Author
This is funny. A few articles ago I commented on the foolishness of the media’s focus on Dow 20,000 and now I’m focusing on my 100th blog article. Is that being a hypocrite or what? I have been racking my feeble brain trying to think of an...
READ MORE
MEMBERS ONLY

Five Markets That Are Approaching Critical Junctures

by Martin Pring,
President, Pring Research
* US Dollar completes a head and shoulders top
* Dollar right at key up trendline against the rest of the world
* Gold caught in a tight trading range
* West Texas oil also restrained in a tight trading range
* Mexico---a chance to jump over the wall?
* Emerging markets to the rescue
It...
READ MORE
MEMBERS ONLY
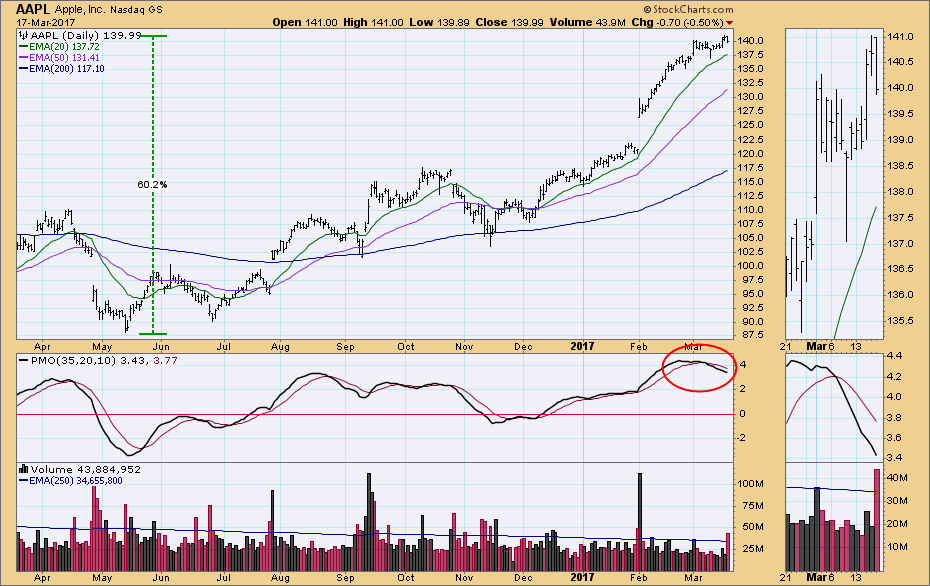
AAPL: Correction Due

by Carl Swenlin,
President and Founder, DecisionPoint.com
Apple (AAPL) has rallied +60% from its May 2016 low, which was also the the low for the previous bear market for AAPL. The price advance for the last month-and-a-half has been pretty vigorous, but the PMO (Price Momentum Oscillator) has topped and crossed down through its signal line, so...
READ MORE
MEMBERS ONLY
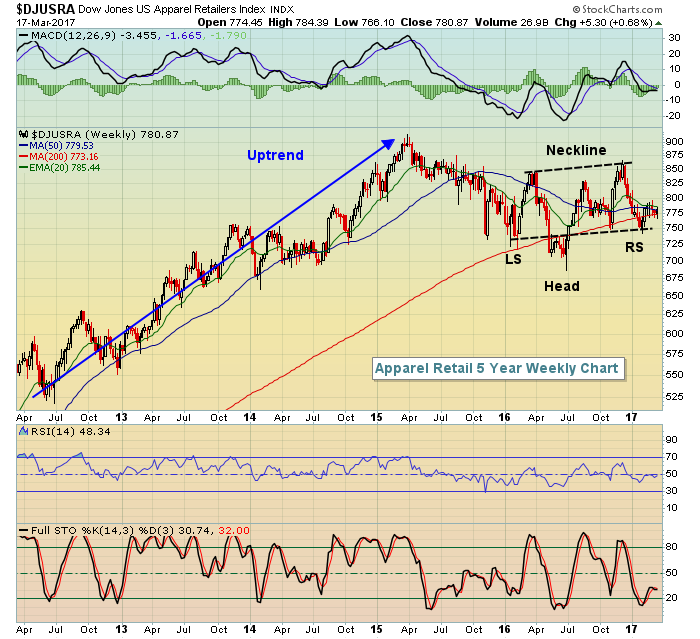
Apparel Retailers Printing Bullish Inverse Head & Shoulders Pattern
by Tom Bowley,
Chief Market Strategist, EarningsBeats.com
Over the past year, the Dow Jones U.S. Apparel Retailers Index ($DJUSRA) has been one of only four industry groups in the consumer discretionary space that has posted a loss. And over the past three months the DJUSRA is the worst performing area of consumer discretionary. But keep in...
READ MORE
MEMBERS ONLY
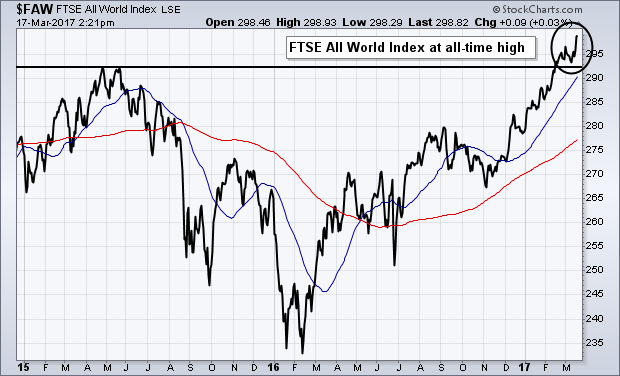
All-World Index Hits New Record

by John Murphy,
Chief Technical Analyst, StockCharts.com
Chart 1 shows the FTSE All-World Stock Index ($FAW) trading at a new record high. The FAW includes stocks from 47 developed and emerging markets. It just recently cleared its 2015 high which resumed its major uptrend. That's a positive sign because it shows that the stock market...
READ MORE
MEMBERS ONLY
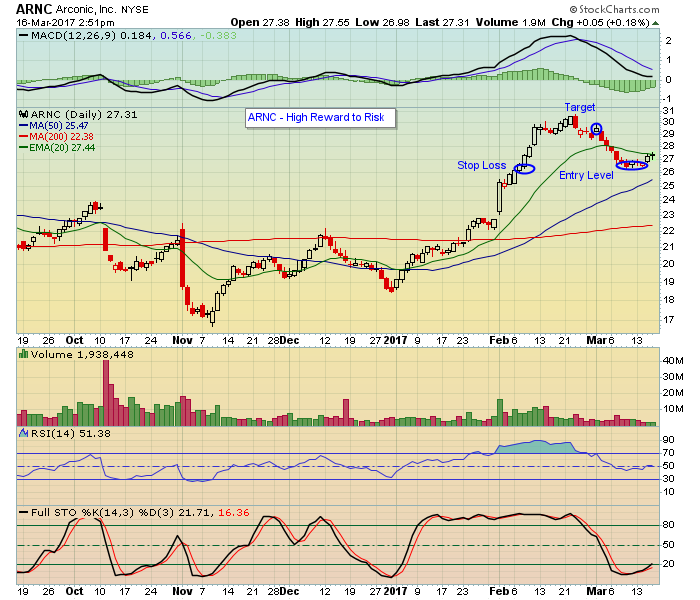
Reward to Risk Calculation a Must

by John Hopkins,
President and Co-founder, EarningsBeats.com
As part of our service at EarningsBeats.com we send trade alerts to our members on stocks that beat earnings expectations. But before we notify members of any trade candidates we look closely at the "Reward to Risk' ratio as we want to make sure it is favorable...
READ MORE
MEMBERS ONLY
Video - Weekly Market Review & Outlook - Small-caps Catch a Bid

by Arthur Hill,
Chief Technical Strategist, TrendInvestorPro.com
The stock market moved higher again this past week with several sector and industry group ETFs hitting new highs. Four of the five sector SPDRs hit fresh 52-week highs. These include the Technology SPDR, HealthCare SPDR, Consumer Staples SPDR and Consumer Discretionary SPDR. Together, these four sectors account for over...
READ MORE
MEMBERS ONLY

Ignoring Signals is the First Step to Taking Signals - How Well do you Know MACD?
by Arthur Hill,
Chief Technical Strategist, TrendInvestorPro.com
Two Indicators in One
Indicators generate lots of signals and many of these signals are just noise. It is imperative that chartists understand how their indicators work and exactly what these indicators are saying. Understanding the ins and outs of an indicator will help chartists determine which signals to take...
READ MORE
MEMBERS ONLY

Crude Oil's Slippery Slope

by Bruce Fraser,
Industry-leading "Wyckoffian"
Crude oil is on a slippery slope downward. Was this completely unexpected or were there clues of the impending decline? The stock market is a discounting mechanism. Stocks traditionally light the way by starting to move prior to the underlying economic events. That, of course, is the argument for Technical...
READ MORE
MEMBERS ONLY
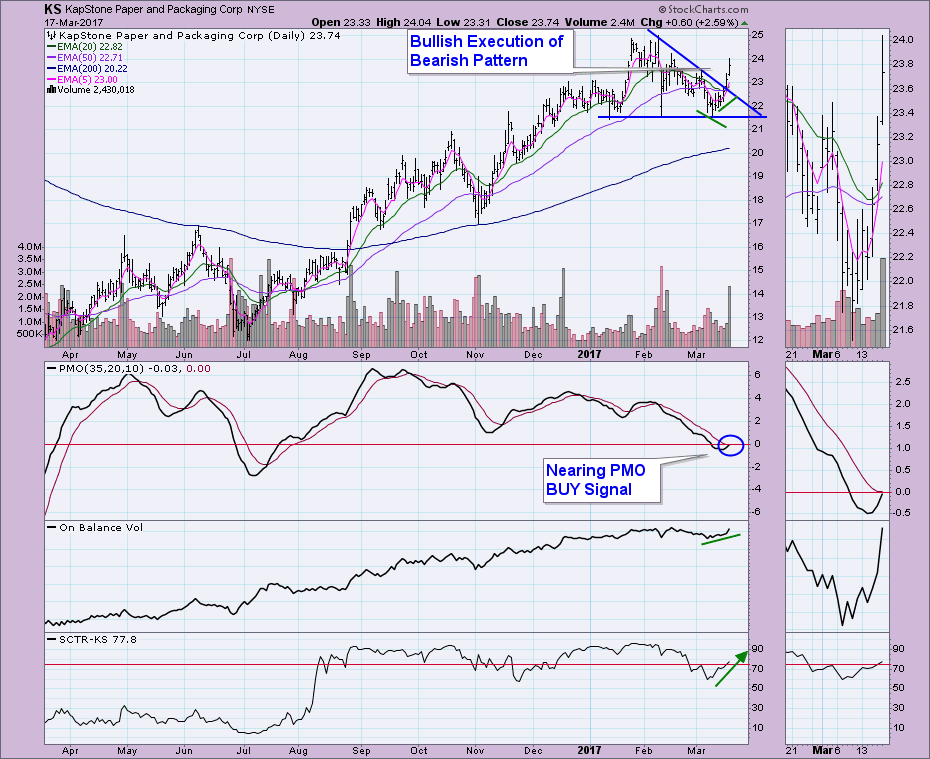
PMO Scan from 3-17-2017 DP Webinar - Spotlight on KapStone Paper (KS)

by Erin Swenlin,
Vice President, DecisionPoint.com
I am asked constantly about how to use the Price Momentum Oscillator (PMO) and Trend Models in a scan. These two ingredients combine into a great tandem for the scan engine. I'll give you a reprint of the scan and analyze a chart I found in it today....
READ MORE
MEMBERS ONLY

Market Timing Tools That Work: Pullbacks versus Corrections

by Gatis Roze,
Author, "Tensile Trading"
Here is how to tell if it’s a regular market pullback versus a serious bearish correction. I strongly disagree with those that claim market timing is toxic. Review this sample of eight of my charts. These types of tools have helped me side-step all the major corrections over the...
READ MORE
MEMBERS ONLY

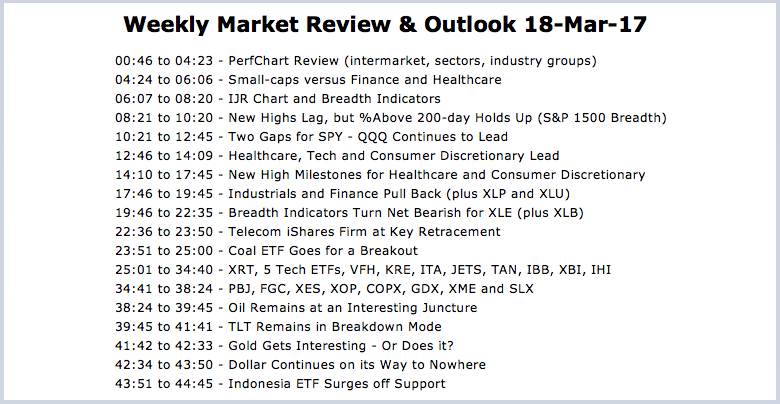
Weekly Market Review & Outlook 17-Mar-17 - Small-Caps Hold the Line as 2-yr Yield Surges
by Arthur Hill,
Chief Technical Strategist, TrendInvestorPro.com
.... Small-caps versus Finance and Healthcare
.... New Highs Lag, but %Above 200-day Holds Up
.... Two Gaps Establish First Support for SPY
.... QQQ Continues to Lead and IJR Continues to Lag
.... Healthcare, Tech and Consumer Discretionary Lead
.... New High Milestones for Healthcare and Consumer discretionary
.... Industrials and Finance Pull Back
.... Breadth Indicators...
READ MORE
MEMBERS ONLY

ALL-WORLD INDEX HITS NEW RECORD -- FOREIGN STOCKS CONTINUE TO RALLY -- ASIA LEADS EMERGING MARKETS HIGHER -- EUROPE ALSO LOOKS STRONG -- THAT INCLUDES IRELAND
by John Murphy,
Chief Technical Analyst, StockCharts.com
FTSE ALL-WORLD INDEX HITS NEW RECORD... Chart 1 shows the FTSE All-World Stock Index ($FAW) trading at a new record high. The FAW includes stocks from 47 developed and emerging markets. It just recently cleared its 2015 high which resumed its major uptrend. That's a positive sign because...
READ MORE
MEMBERS ONLY
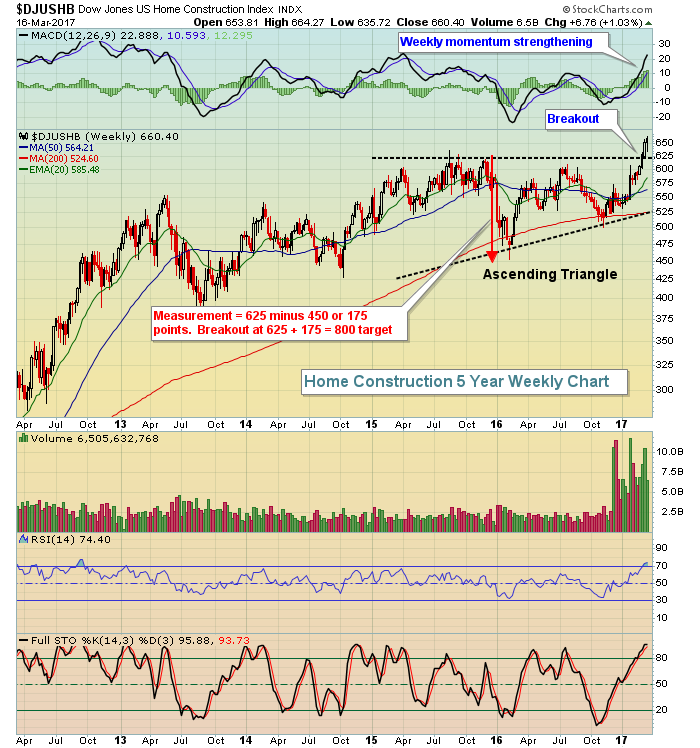
Homebuilders Hot; DR Horton Forms Cup, Lennar Tests High
by Tom Bowley,
Chief Market Strategist, EarningsBeats.com
Market Recap for Thursday, March 16, 2017
Home construction ($DJUSHB) continued its torrid pace of recent gains, rising another 2% on Thursday. Since January 23rd, the DJUSHB has jumped roughly 20%. That's a great year by any measure, yet we're only talking the past two months...
READ MORE
MEMBERS ONLY

Investors Feeling Bearish = Good for the Market
by Erin Swenlin,
Vice President, DecisionPoint.com
I thought this "yin yang" symbol was actually a nice metaphor for sentiment. When we look at the sentiment numbers on a chart they are expressed as a percentage. For example, 31% are bullish, 39% are bearish, and the rest fall into the neutral category. It's...
READ MORE
MEMBERS ONLY

Fresh All-Time High For ORCL After Latest Earnings
by Tom Bowley,
Chief Market Strategist, EarningsBeats.com
Oracle Corp (ORCL) needed a solid earnings report last night after the closing bell to reach all-time highs and it delivered exactly that. ORCL posted both top line and bottom line (.63 vs .57) results that exceeded Wall Street consensus estimates and this morning's open cleared price resistance...
READ MORE
MEMBERS ONLY
Fed Hikes Rates, But No New Hike Expectations Revealed
by Tom Bowley,
Chief Market Strategist, EarningsBeats.com
Market Recap for Wednesday, March 15, 2017
The Federal Reserve's latest policy meeting has come and gone. As expected, the FOMC announcement at 2pm EST indicated that rates would be hiked another quarter point. But the real question was whether the Fed would turn more hawkish on future...
READ MORE
MEMBERS ONLY
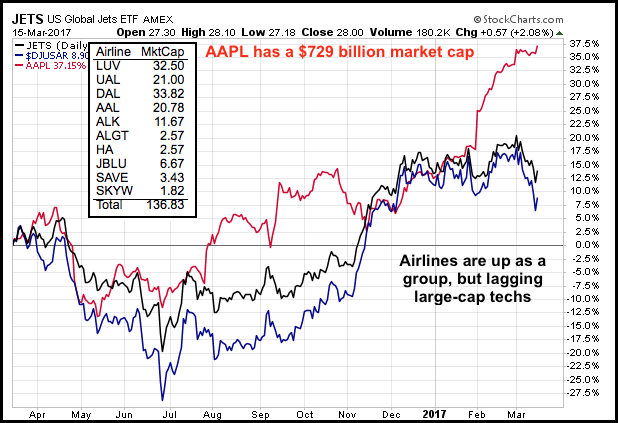
Airline ETF and Six Airline Stocks: Long-term Uptrend and Short-term Oversold - Plus Ford and Akamai
by Arthur Hill,
Chief Technical Strategist, TrendInvestorPro.com
.... The Airline Group is Tiny, Really Tiny
.... Comparing the Airline Index with the Airline ETF
.... JETS Hits Oversold Zone
.... The Big Three (AAL, DAL, UAL)
.... Three Regional Carriers (HA, JBLU, SKYW)
.... Where to Find a List of Airline Stocks
.... Two More Charts with Bullish Setups (F and AKAM)
The Airline...
READ MORE
MEMBERS ONLY

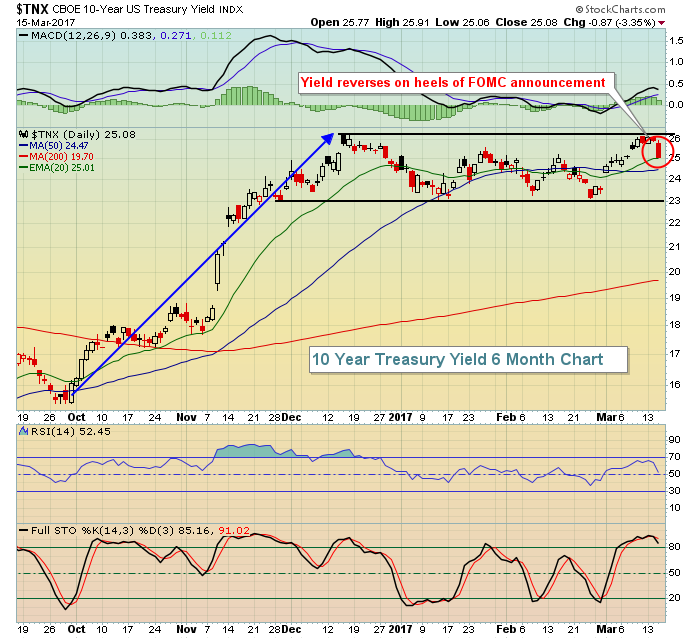
STOCKS AND BONDS RALLY ON FED ANNOUNCEMENT -- PULLBACK IN YIELDS BOOSTS REITS AND UTILITIES, WHILE BANKS LAG -- DOLLAR DROP BOOSTS GOLD -- STOCK INDEXES REACT POSITIVELY -- EMERGING MARKETS LEAD FOREIGN STOCK ETFS HIGHER
by John Murphy,
Chief Technical Analyst, StockCharts.com
FED MOVE VIEWED AS DOVISH... The Fed hiked rates today as expected, with expectations for two more hikes this year. Judging from immediate market reactions, the Fed announcement is being viewed as somewhat dovish. For one thing, bond yields are dropping. Chart 1 shows the 10-Year Treasury Yield falling sharply....
READ MORE
MEMBERS ONLY
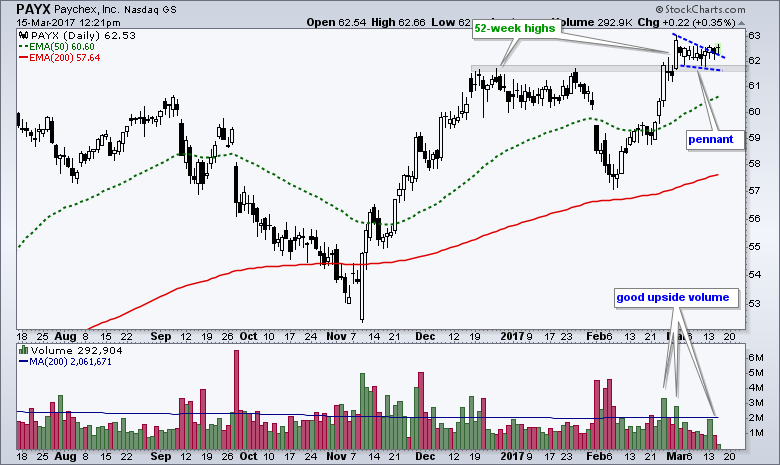
A High and Tight Pennant Takes Shape for Paychex
by Arthur Hill,
Chief Technical Strategist, TrendInvestorPro.com
Flags and pennants are continuation patterns, which means their bias depends on the direction of the prior move. A flag or pennant after a surge is a bullish continuation pattern that represents a rest within the uptrend. An upside break signals an end to this consolidation and a resumption of...
READ MORE
MEMBERS ONLY
Technology Showing Signs Of Slowing Momentum
by Tom Bowley,
Chief Market Strategist, EarningsBeats.com
Special Webinar Announcement
Please join me at noon EST for my Bowley Briefing webinar. It'll be a special one hour format and I'll be joined by Erin Heim. Many of you may know Erin from all of her Decision Point work here at StockCharts.com. We&...
READ MORE
MEMBERS ONLY

Chart Spotlight on Pfizer, Inc. (PFE)
by Erin Swenlin,
Vice President, DecisionPoint.com
Chart Spotlights will be a regular addition to the DecisionPoint blog and have already been incorporated into the DecisionPoint Report webinars. The purpose of the Chart Spotlight is not to recommend a particular stock, it is a learning exercise. Many readers and viewers want to understand how to pull up...
READ MORE
MEMBERS ONLY

When Will Rising Rates Hit The Stock Market?
by Martin Pring,
President, Pring Research
* No consistent relationship between rates and equity prices
* Three step and a stumble
* Combining interest rate movements with equity trends
No consistent relationship between rates and equity prices
A lot of prognosticators have recently raised concerns that rising rates will soon affect equities in an adverse way. Last week at...
READ MORE
MEMBERS ONLY

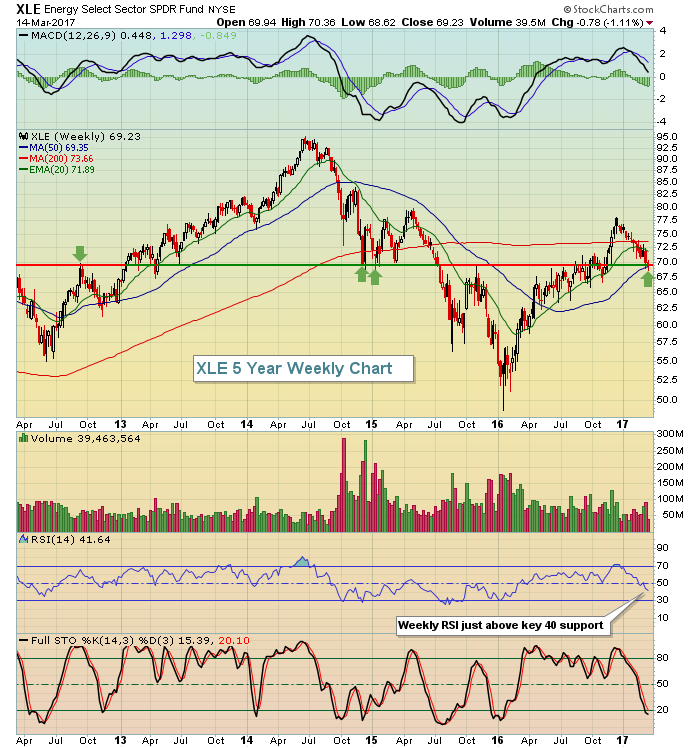
SMALL CAPS AND TRANSPORTS CONTINUE TO WEAKEN -- ENERGY STOCKS CONTINUE TO DROP ON FALLING OIL PRICE -- COMMODITY SELLOFF WEAKENS INFLATION TRADE -- HIGH YIELD BONDS SELL OFF ON COMMODITY WEAKNESS
by John Murphy,
Chief Technical Analyst, StockCharts.com
SMALL CAPS AND TRANSPORTS WEAKEN ... Bond yields are hitting multi-year highs in anticipation of a Fed rate hike tomorrow. Stocks remain in an uptrend, but weakness in some stock groups is sending short-term caution signals. Small caps and transports continue to weaken. So do energy shares along with falling oil...
READ MORE
MEMBERS ONLY
Bond Market Moves Ahead of the Fed - Plus MDY, JJC and 16 Stocks
by Arthur Hill,
Chief Technical Strategist, TrendInvestorPro.com
.... Bond Market Moves Ahead of the Fed
.... S&P MidCap SPDR Becomes Short-term Oversold
.... Copper ETN Pulls Back within Uptrend
.... Valero and Marathon (Refiners) Hold Up within XLE
.... Computer Associates, QQQ and New Highs
.... FFIV, PFPT and QLYS Bounce within Cyber-Security Group
.... Three Biotechs to Watch (CELG, ILMN, REGN)...
READ MORE
MEMBERS ONLY
Footwear Is Strengthening; Here's My Choice In The Space
by Tom Bowley,
Chief Market Strategist, EarningsBeats.com
Market Recap for Monday, March 13, 2017
There really was very little movement in our major indices or in our sectors on Monday - which for Monday isn't really a bad day. But my guess is that traders are a bit cautious ahead of what many perceive will...
READ MORE
MEMBERS ONLY
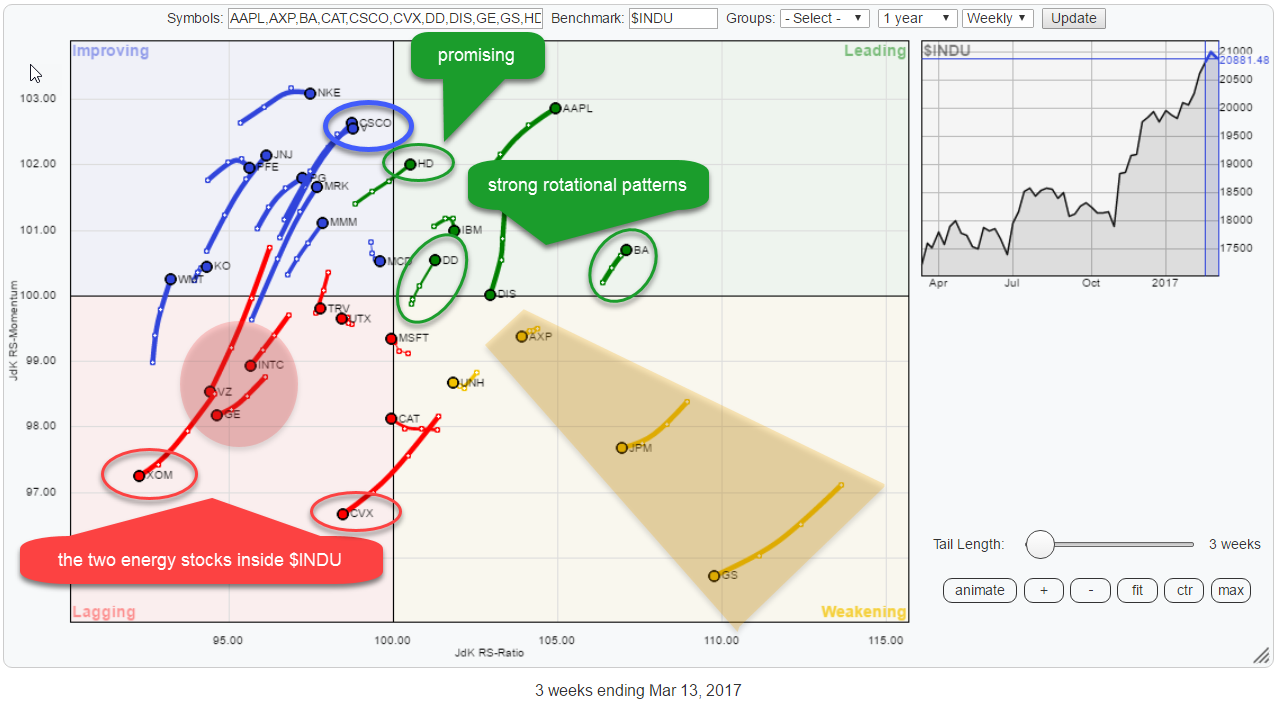
There are two Energy stocks inside $INDU.....

by Julius de Kempenaer,
Senior Technical Analyst, StockCharts.com
... And they both show very weak rotations on the Relative Rotation Graph of the DJ Industrials components.
XOM rotated negatively while inside the lagging quadrant and CVX just crossed over into the lowe-left part coming from weakening. These are the two names to avoid in this universe.
They are closely...
READ MORE
MEMBERS ONLY
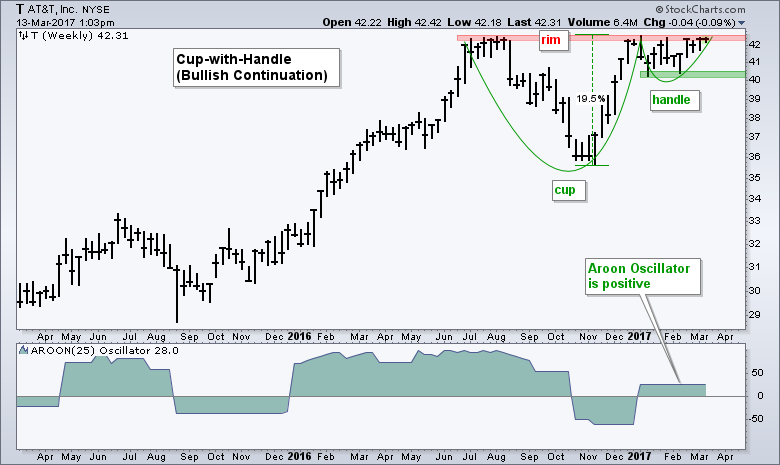
AT&T Forms a Classic Bullish Continuation Pattern
by Arthur Hill,
Chief Technical Strategist, TrendInvestorPro.com
The cup-with-handle is a bullish continuation pattern that forms as part of a bigger uptrend. There are three parts to this pattern. First, a cup forms as prices correct and rebound to form a "V" or "U" shape. Second, prices hit resistance at the prior high...
READ MORE
MEMBERS ONLY
Wall of Worry
by Greg Morris,
Veteran Technical Analyst, Investor, and Author
The “Wall of Worry” has been used for many decades to identify the period of time in the latter stages of a bullish run in the stock market, when all the naysayers start talking about a top. I have witnessed this often. As the bull ages, many start to think...
READ MORE
MEMBERS ONLY
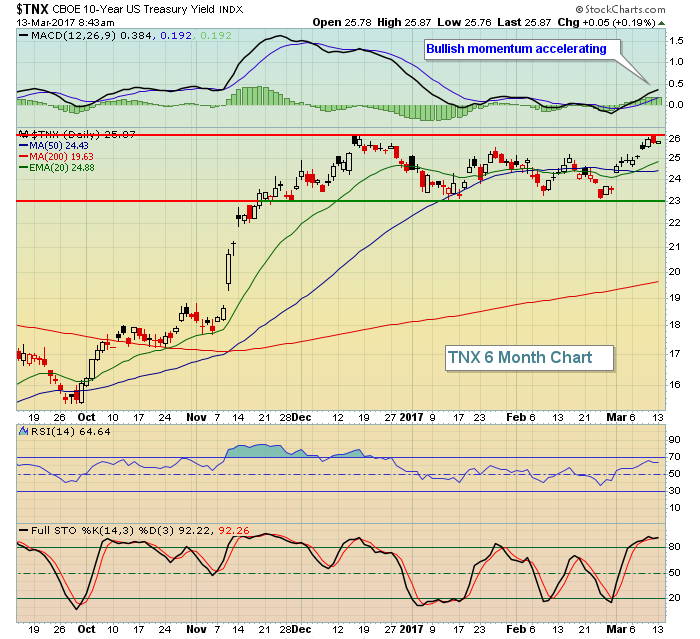
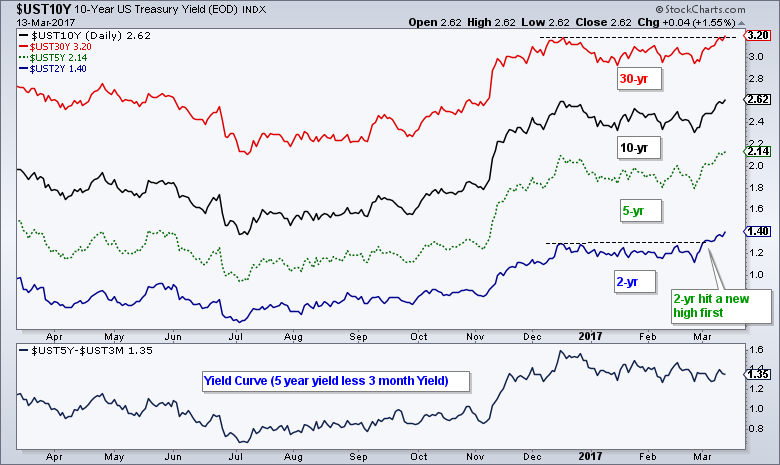
Failure Of Treasury Yields Slow Financial Stocks
by Tom Bowley,
Chief Market Strategist, EarningsBeats.com
Market Recap for Friday, March 10, 2017
U.S. equities posted mostly strong results on Friday with a bit of relative strength from the more aggressive NASDAQ and Russell 2000. The NASDAQ 100 ($NDX) posted the best percentage gain of all, but keep in mind that the NDX does not...
READ MORE
MEMBERS ONLY
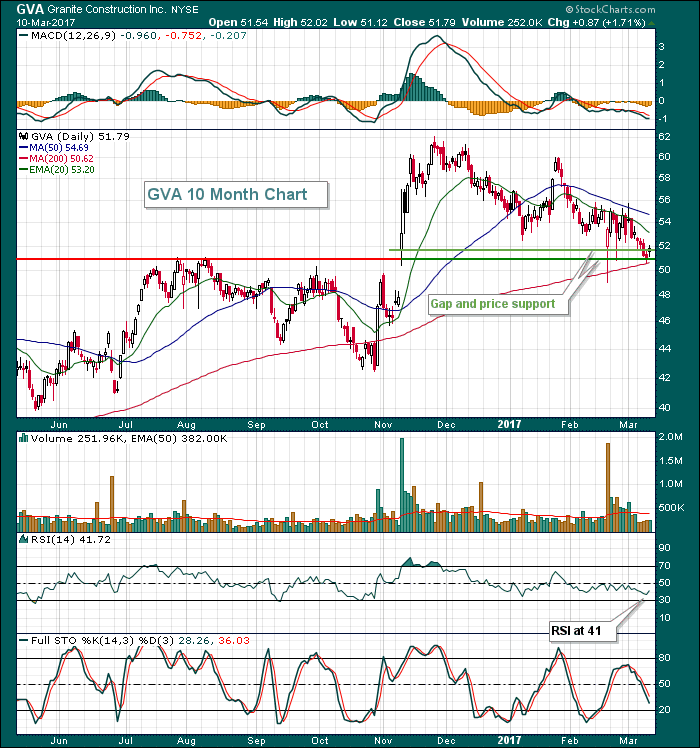
Heavy Construction Tests Support, Here's A Potential Winner
by Tom Bowley,
Chief Market Strategist, EarningsBeats.com
The Dow Jones U.S. Heavy Construction Index ($DJUSHV) is currently testing its rising 20 week EMA and is near key support in its four month sideways consolidation range from 440-480. Friday's close was 447 and the weekly RSI is now at 43, typically a solid level on...
READ MORE
MEMBERS ONLY
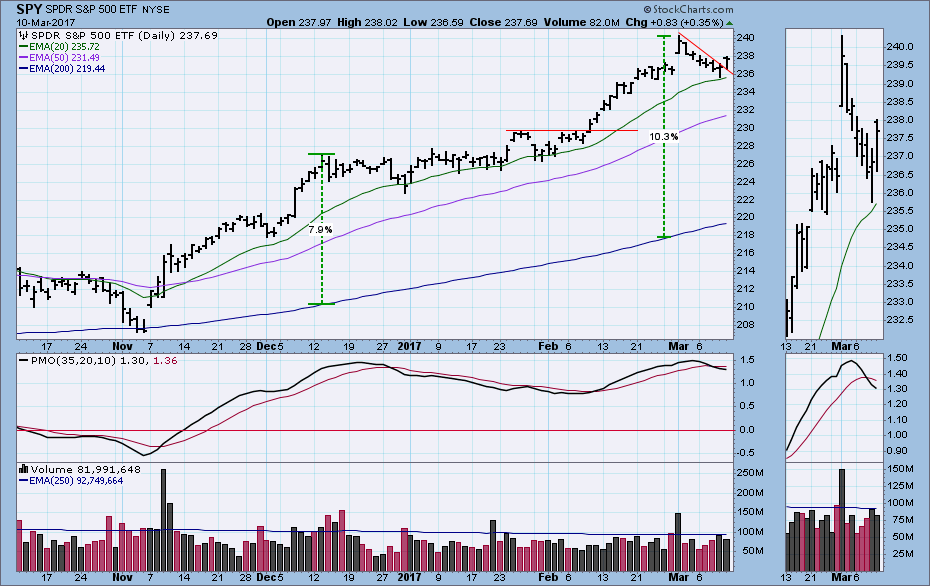
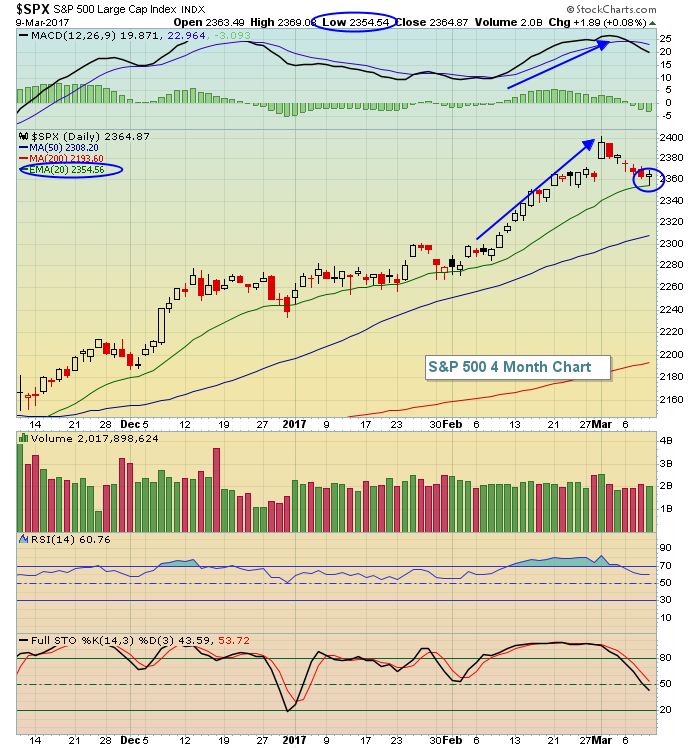
SPY: Short-Term Indicators Positive
by Carl Swenlin,
President and Founder, DecisionPoint.com
Trying to attribute every market up or down tick to news/fundamental events is a fool's errand, but every once in a while the connection between seems pretty obvious. The day after President Trump's address to congress, the market gapped up in response; however, it immediately...
READ MORE
MEMBERS ONLY
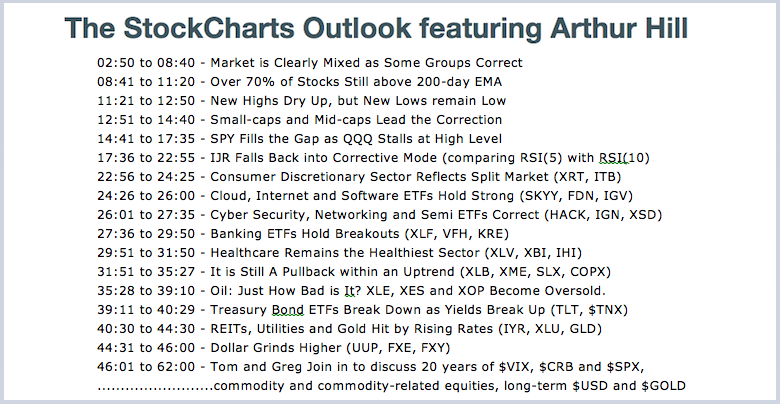
The StockCharts Outlook Webinar Recording with Arthur, Greg and Tom
by Arthur Hill,
Chief Technical Strategist, TrendInvestorPro.com
The image above shows the outline for the StockCharts Outlook webinar. Arthur added some color to the Weekly Market Review & Outlook by going over the each chart and expanding in some areas. Namely, the difference between RSI(5) and RSI(10), the bifurcation in the current market and a...
READ MORE
MEMBERS ONLY

NASDAQ 100 Index. A Current Case Study.
by Bruce Fraser,
Industry-leading "Wyckoffian"
Point and Figure charts are generated from price volatility, unlike a vertical (bar) chart, which is plotted as a function of time. This is particularly valuable to Wyckoffians who are always on the search for a Cause being built. Causes lead to Effects; Accumulation results in Markup and Distribution turns...
READ MORE
MEMBERS ONLY

Investor's Creed
by Gatis Roze,
Author, "Tensile Trading"
“An investor’s methodology is inseparable from his or her emotional discipline. Both must be defended and reinforced whenever either is threatened.” — Gatis Roze
My trading is guided by a collection of beliefs and principles that direct my trading routines, actions and ‘Investor Self’ behavior. Over the years, it’s...
READ MORE
MEMBERS ONLY
Weekly Market Review & Outlook - Looking at Performance Splits within the Market and Oversold ETFs - Webinar Link
by Arthur Hill,
Chief Technical Strategist, TrendInvestorPro.com
.... Market is Clearly Mixed as Some Groups Correct
.... Small-caps and Mid-caps Lead the Correction
.... New Highs Dry Up, but New Lows remain Low
.... Over 70% of Stocks Still above 200-day EMA
.... SPY Fills the Gap as QQQ Stalls at High Level
.... IJR Falls Back into Corrective Mode
.... Consumer Discretionary Sector...
READ MORE
MEMBERS ONLY
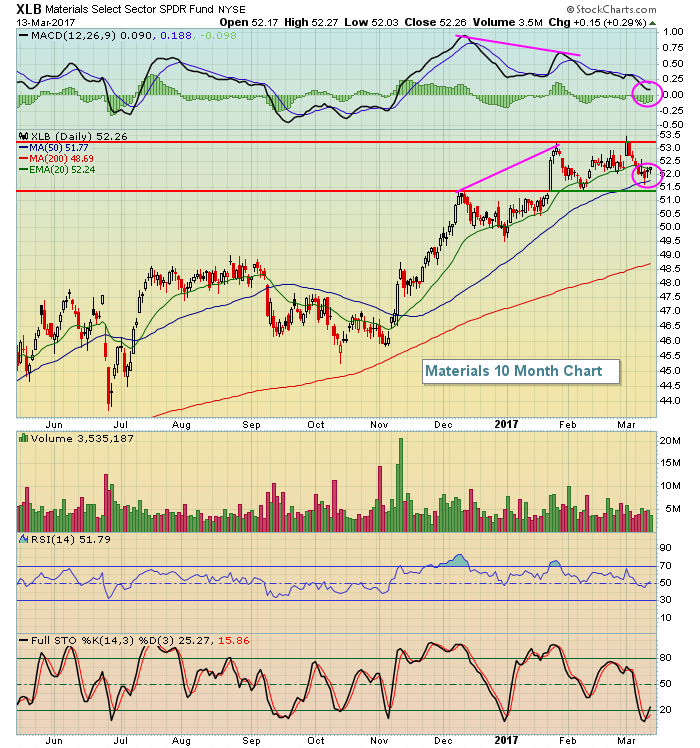
Weakening Aluminum, Steel And Gold Pressure Materials Stocks
by Tom Bowley,
Chief Market Strategist, EarningsBeats.com
Market Recap for Thursday, March 9, 2017
The March 6th to 9th period once again produced not-so-good S&P 500 results. The S&P 500 did break its recent string of losses, gaining two points on Thursday. Technically, it bounced exactly where we would expect - off the...
READ MORE
MEMBERS ONLY

SystemTrader - Reducing Risk with a Portfolio Approach to Mean-Reversion Trading
by Arthur Hill,
Chief Technical Strategist, TrendInvestorPro.com
.... Failure for One Trader is Opportunity for Another
.... Mean-Reversion Trades and Setups for IJR
.... Backtesting Two Short-term Mean-Reversion Strategies
.... Completed Trade and Current Setup for MDY
.... Testing Five Major index ETFs
.... Trading a Portfolio to Reduce Risk
.... Equity Curve and Drawdown Chart
.... Conclusions
Failure for One Trader is Opportunity for...
READ MORE
MEMBERS ONLY
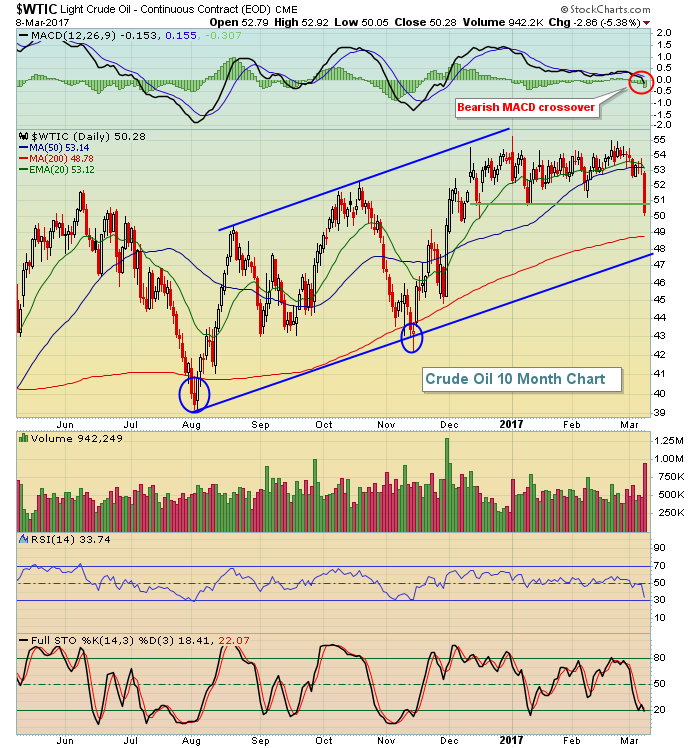
Record Crude Inventories Sink Oil, S&P 500
by Tom Bowley,
Chief Market Strategist, EarningsBeats.com
Market Recap for Wednesday, March 8, 2017
The S&P 500 fell for a third consecutive day and it could have been five days in a row if not for a very small gain last Friday. The culprit yesterday was quite clearly the oil patch. The U.S. crude...
READ MORE