MEMBERS ONLY

Market Extends Gains As Breadth Surprisingly Improves

by Martin Pring,
President, Pring Research
More stocks trading above their 150-day MA’s
Last week I pointed out that many indicators were overstretched, thereby indicating the probability of a correction. I also stated that during a bull market, surprises typically develop on the upside. Consequently, if the market was able to shrug off its overbought...
READ MORE
MEMBERS ONLY

0100111000100000

by Greg Morris,
Veteran Technical Analyst, Investor, and Author
There are 10 types of people in this world, those who understand binary and those who do not. Yes, the title is binary for 20,000. I knew the title of this article would get your attention. The financial media is possessed with round numbers more than I can remember....
READ MORE
MEMBERS ONLY
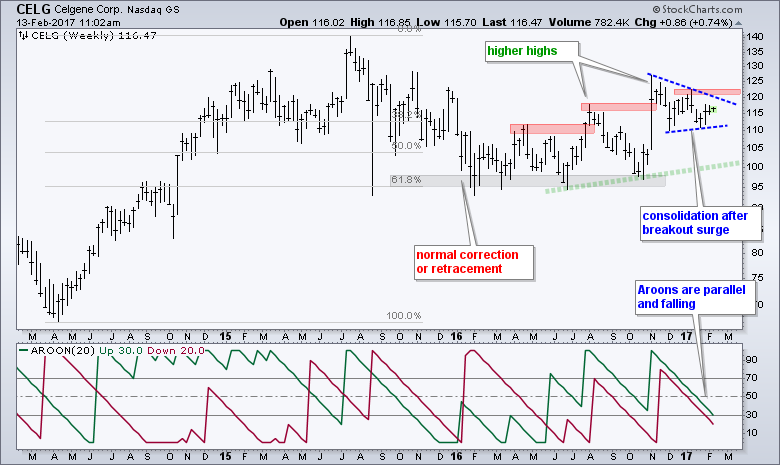
Celgene Stalls within Trend - What's Next?

by Arthur Hill,
Chief Technical Strategist, TrendInvestorPro.com
Celgene (CELG) has not made much headway the last twelve months, but the overall trend is up and the current consolidation looks like a bullish continuation pattern. Taking a step back, notice that CELG doubled from the April 2014 low to the July 2015 high (~70 to ~140). The stock...
READ MORE
MEMBERS ONLY
Aerospace Strength Sends Industrials To All-Time High

by Tom Bowley,
Chief Market Strategist, EarningsBeats.com
Market Recap for Friday, February 10, 2017
Materials (XLB, +0.91%) and industrials (XLI, +0.79%) led yet another rally in U.S. equities on Friday as the Dow Jones, S&P 500, NASDAQ, NASDAQ 100 and the Russell 2000 all established new all-time closing highs. The small cap...
READ MORE
MEMBERS ONLY
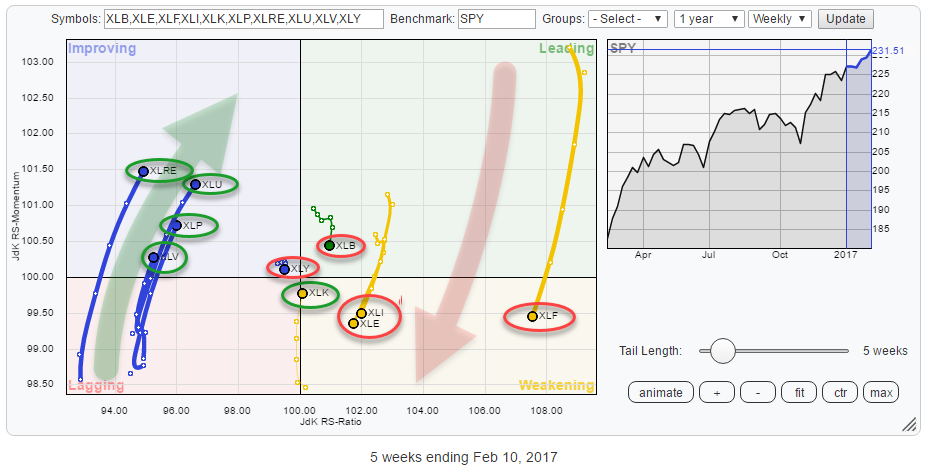
Sector rotation from Energy to Utilities, market in transition

by Julius de Kempenaer,
Senior Technical Analyst, StockCharts.com
Summary
* NO sectors inside the lagging quadrant and only one in leading
* Sector rotation suggests market in transition
* Financials continue to loose ground vs Healthcare
* Technology picking up against Materials
* Sector rotation from Energy to Utilities starting to shape up
Quick scan
A first look at the Relative Rotation Graph...
READ MORE
MEMBERS ONLY
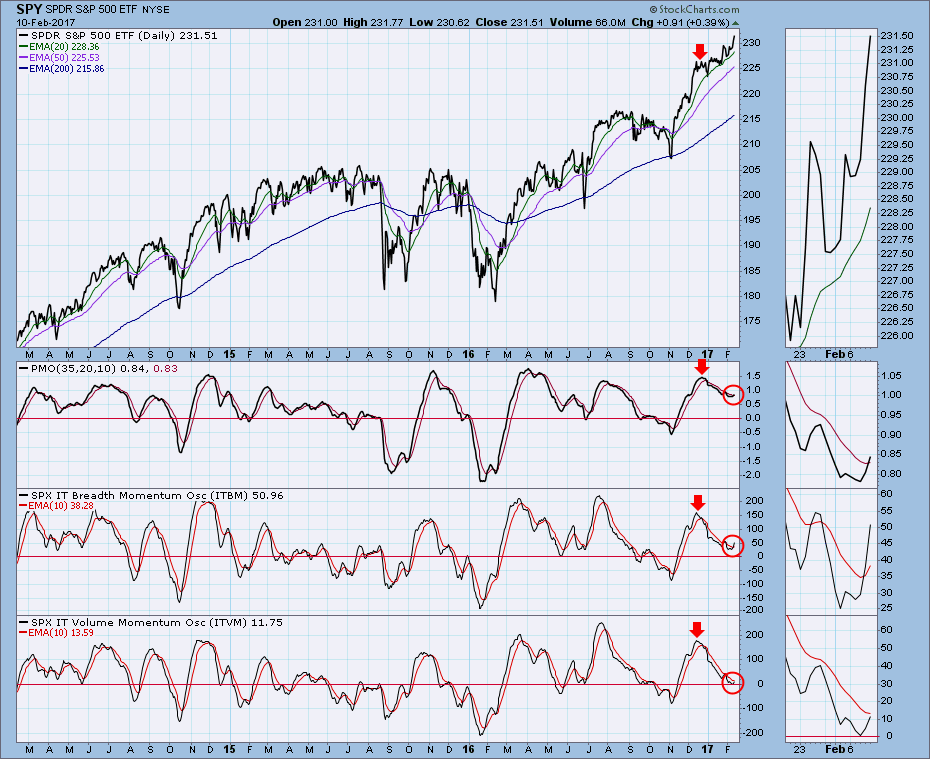
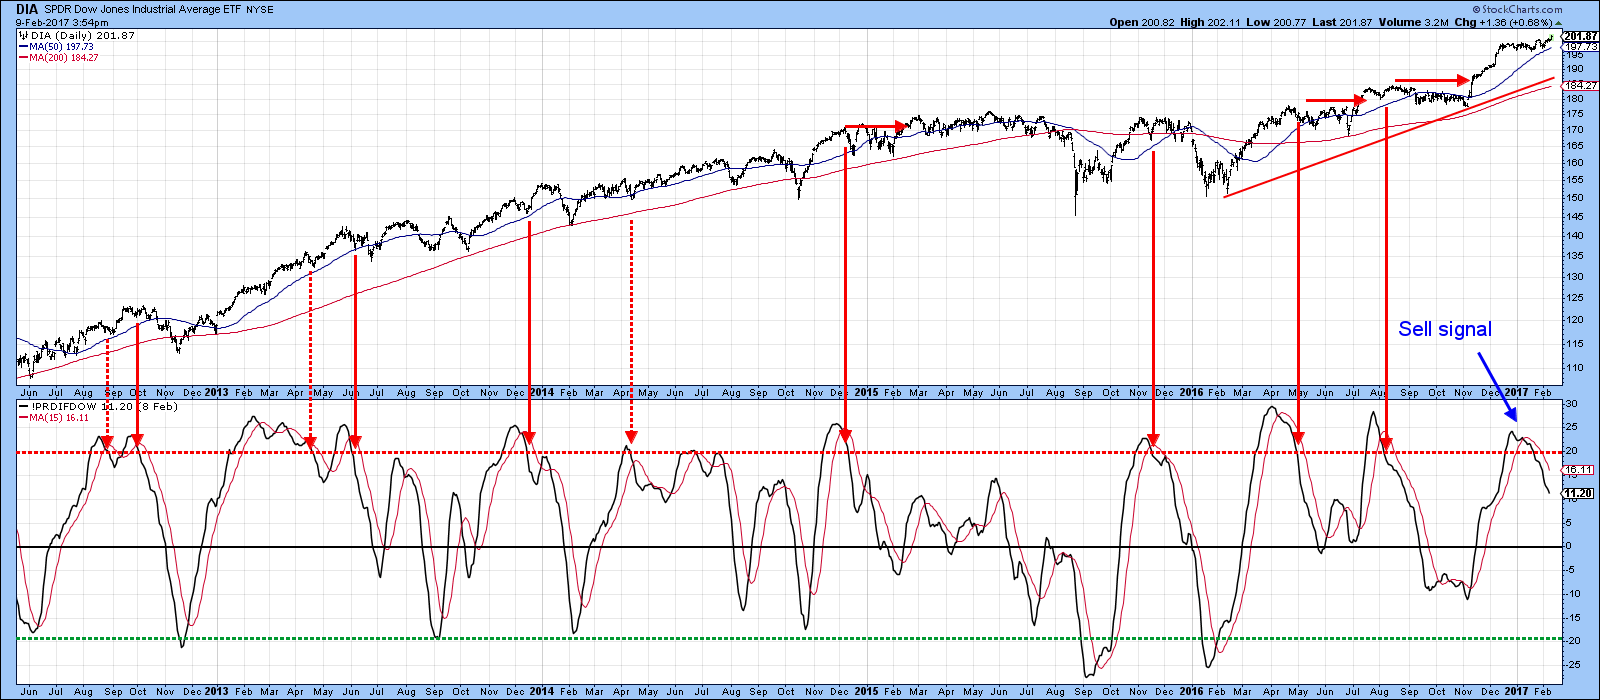
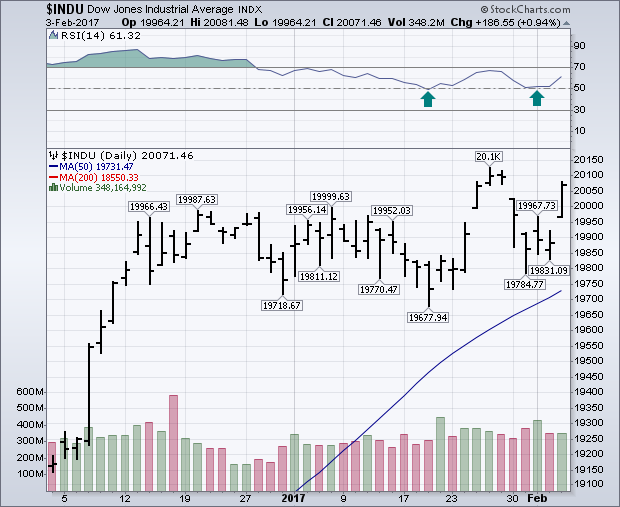
What Happened to the Correction?

by Carl Swenlin,
President and Founder, DecisionPoint.com
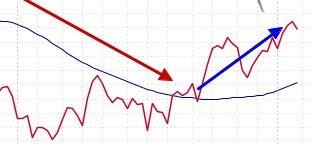
Just before Christmas I wrote an article saying I was expecting a correction or consolidation because our primary intermediate-term indicators had all topped. On the chart below we can see the annotations (down arrows) I made at the time, and we can see what actually happened. There was a small...
READ MORE
MEMBERS ONLY
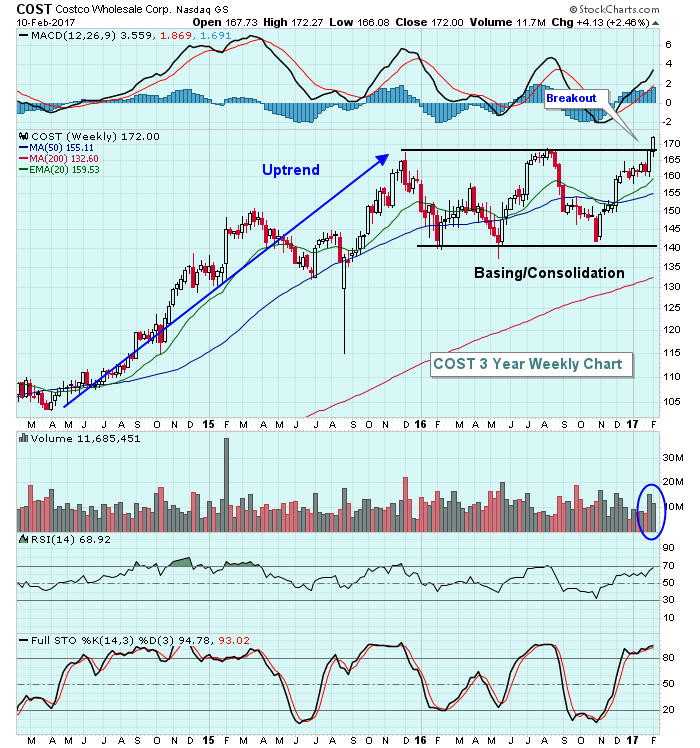
Costco Finally Breaks Out Above Its 15 Month Consolidation Range
by Tom Bowley,
Chief Market Strategist, EarningsBeats.com
After long basing periods, breakouts can be very significant technical events that lead to powerful gains. Those invested in or trading Costco (COST) are hoping last week's breakout signals a nice advance in the months ahead. Three months ago, COST bulls successfully defended key price support and the...
READ MORE
MEMBERS ONLY

Avoidance Strategy

by Bruce Fraser,
Industry-leading "Wyckoffian"
The Wyckoffian mission is to trade and invest in the best stocks in the leading Industry Groups. We have been studying examples of leadership characteristics using Wyckoff Analysis in combination with Relative Strength. Recall that our workflow is to drill down from Sector to Industry Group to Stock. Always seeking...
READ MORE
MEMBERS ONLY
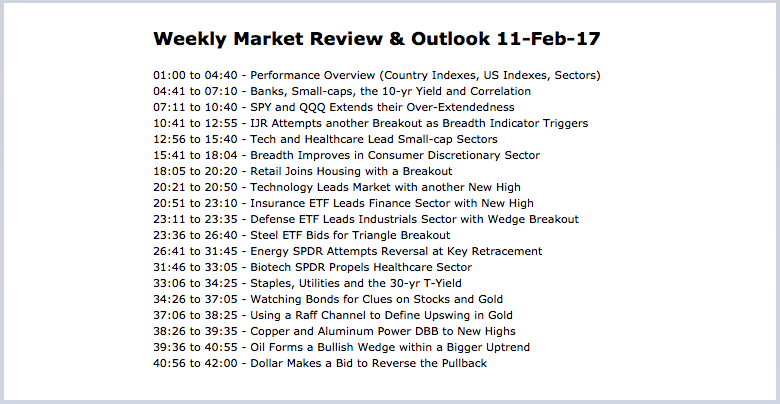
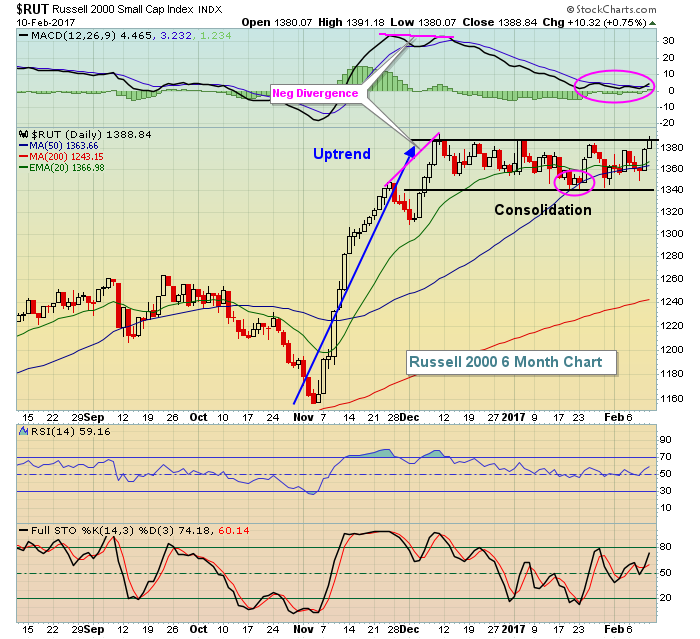
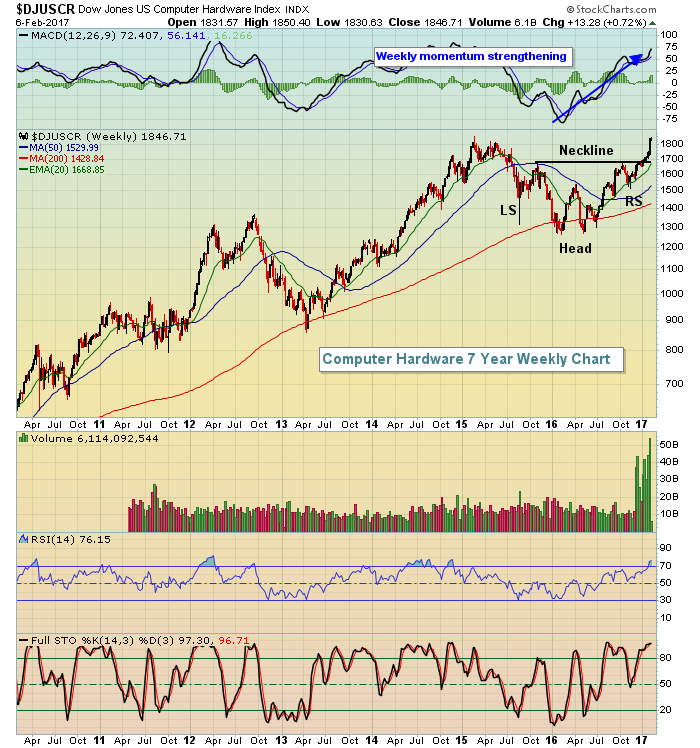
Weekly Market Review & Outlook (with Video) - Consumer Discretionary, Housing and Retail Come Alive - Small-cap Breakout - Banks Key Off 10-yr Yield - Copper and Alum Lead Metals
by Arthur Hill,
Chief Technical Strategist, TrendInvestorPro.com
----- Video Link ----- Art's Charts ChartList (updated 11-Feb) -----
Banks, Small-caps and the 10-yr Yield
Stocks extended their uptrends with the S&P 500, S&P MidCap 400 and Nasdaq 100 hitting new highs this week. The S&P Small-Cap 600 did not hit...
READ MORE
MEMBERS ONLY

Charts I'm Stalking Action Practice #11

by Gatis Roze,
Author, "Tensile Trading"
In Action Practice #10, we applied the Tensile Trading methodology to the buy side of the six charts. This week, we apply the same price relative approach to the sell side and show that it works just as effectively there. We even recycle the CDE buy chart and now annotate...
READ MORE
MEMBERS ONLY

COPPER AND STEEL STOCKS RESUME UPTRENDS -- CRUDE OIL BOUNCE BOOSTS ENERGY SECTOR -- OIL SERVICE STOCKS ARE ENERGY LEADERS -- CANADIAN STOCKS HIT NEW RECORD ON COMMODITY RALLY -- AUSSIE AND CANADIAN DOLLARS ALSO TURN UP

by John Murphy,
Chief Technical Analyst, StockCharts.com
COPPER AND STEEL STOCKS RESUME UPTRENDS... Economically-sensitive industrial metals are rising again, along with stocks tied to them. The price of copper is up 3.5% today to the highest level in nearly two years. So are copper shares. Chart 1 shows the Global X Copper Miners ETF (COPX) resuming...
READ MORE
MEMBERS ONLY
This Financial Industry Group Is Poised For A Big 2017
by Tom Bowley,
Chief Market Strategist, EarningsBeats.com
Special Note
Greg Schnell (author of The Canadian Technician blog) and I will be co-hosting a special webinar tomorrow at 11am EST. I'll discuss trading strategies with respect to gaps created by earnings reports while Greg's discussion will focus on his outlook for biotech stocks. Greg...
READ MORE
MEMBERS ONLY
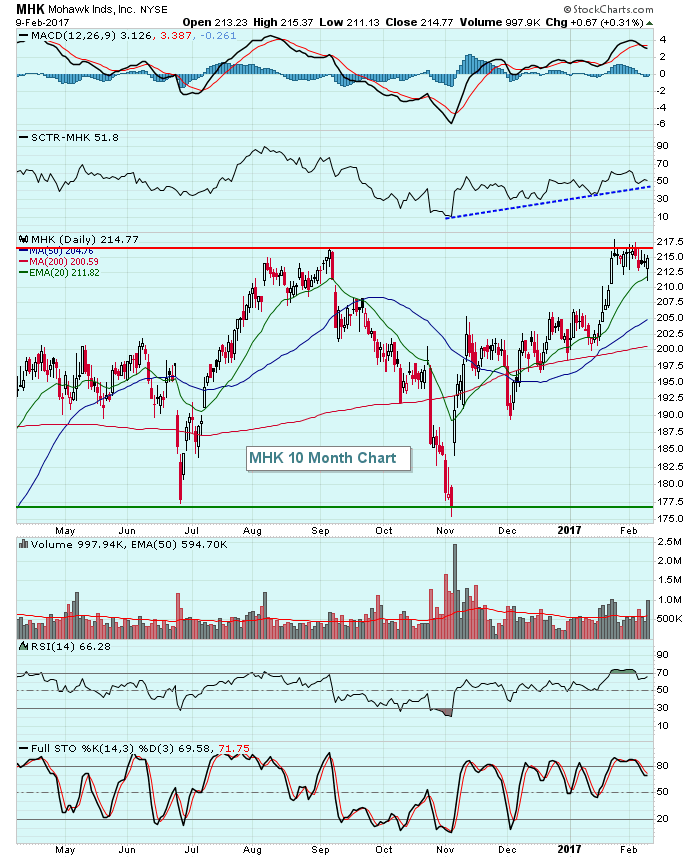
Mohawk Reports Strong Earnings, Looks To Break Out On Friday
by Tom Bowley,
Chief Market Strategist, EarningsBeats.com
Mohawk Industries (MHK), a flooring designer and manufacturer, just reported quarterly earnings that exceeded Wall Street consensus estimates. The initial reaction in after hours is very bullish as MHK has been consolidating in sideways fashion for the better part of a year and the after hours price would constitute a...
READ MORE
MEMBERS ONLY
New Highs In The Market ... But Fewer Stocks Are Participating
by Martin Pring,
President, Pring Research
* Market still overstretched
* Greater selectivity as the market moves higher
* Whatever happened to China?
Last week, I pointed out that several indicators were pointing to a short-term correction. I also said that counter-cyclical corrections are difficult to play, essentially because they are usually over before you realize it. To quote...
READ MORE
MEMBERS ONLY

SystemTrader .... Building a Momentum Trading System for Stocks .... Backtest Results .... Scan Code
by Arthur Hill,
Chief Technical Strategist, TrendInvestorPro.com
---- Introduction
---- Trading Universe and Timeframe
---- Culling the Herd
---- Volatility Filter
---- Minimum Liquidity Filter
---- Minimum Price Filter
---- Maximum Rate-of-Change Filter
---- Setting the Trading Rules
---- Backtest Results
---- Conclusions, Scan Code and FAQ ----
Introduction
This System Trader article will introduce and update...
READ MORE
MEMBERS ONLY
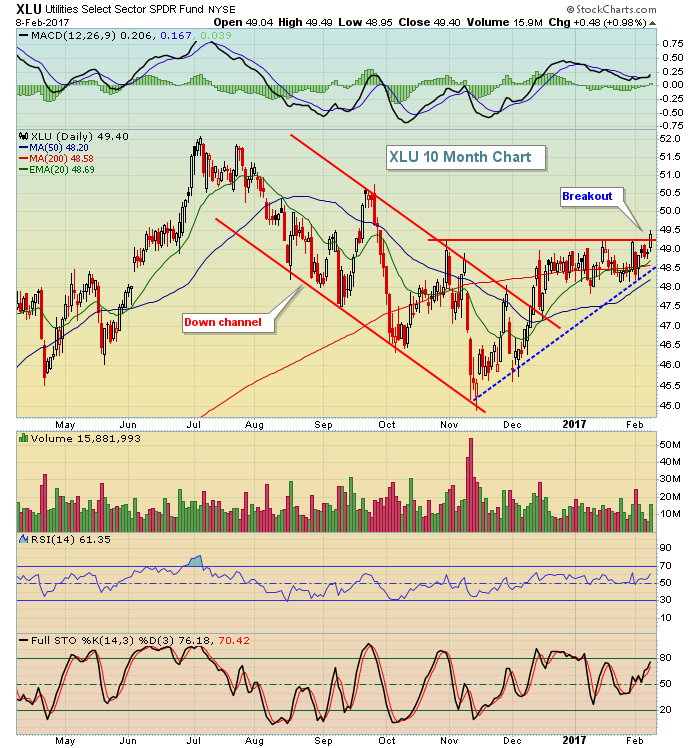
Utilities Break To Four Month High; Consumer Stocks Strong
by Tom Bowley,
Chief Market Strategist, EarningsBeats.com
Market Recap for Wednesday, February 8, 2017
The 10 year treasury yield ($TNX) has dropped back toward the lower end of its 2-3 month trading range from 2.30% to 2.60%, closing on Wednesday at 2.35%. That apparently has been enough to spark utilities (XLU, +0.98%) as...
READ MORE
MEMBERS ONLY

GOLD CONTINUES RALLY BUT NEARS RESISTANCE -- SO DO GOLD MINERS -- EURO STAYS FLAT -- PULLBACK IN BOND YIELDS ARE HELPING GOLD BUT MAYBE NOT FOR LONG -- REBOUND IN SAFE HAVEN BONDS AND THE YEN NOT THAT IMPRESSIVE
by John Murphy,
Chief Technical Analyst, StockCharts.com
GOLD REACHES THREE-MONTH HIGH... The price of gold continues to rise. Chart 1 shows the Gold Shares SPDR (GLD) trading at the highest level in three months. It has reached a point, however, where some overhead resistance may appear. For one thing, it has retraced 62% of its November/December...
READ MORE
MEMBERS ONLY
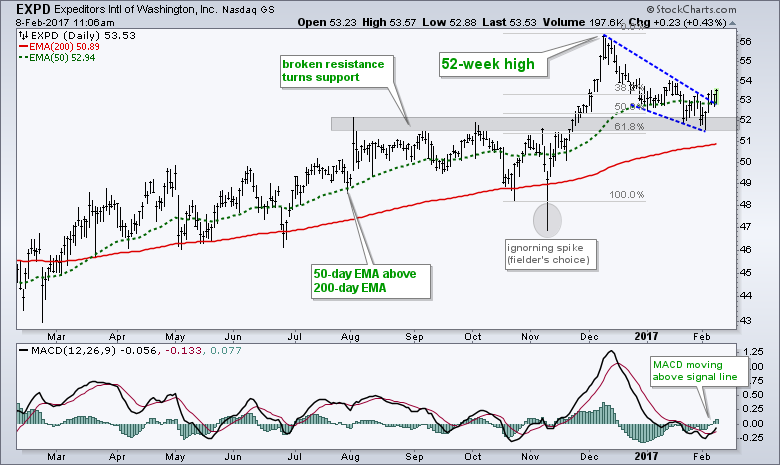
Expeditors Hits Reversal Zone and Turns
by Arthur Hill,
Chief Technical Strategist, TrendInvestorPro.com
Expeditors International of Washington (EXPD), a logistics services provider, is part of the Dow Transports and the Industrials SPDR. The stock caught my eye because it is in a long-term uptrend and recently pulled back to a potential reversal zone. First, the long-term trend is clearly up because the stock...
READ MORE
MEMBERS ONLY
Dow Jones Sets New All-Time High
by Tom Bowley,
Chief Market Strategist, EarningsBeats.com
Market Recap for Tuesday, February 7, 2017
The Dow Jones moved into blue sky, all-time high territory intraday on Tuesday as it touched 20155. If there was any bad news, it's that the move didn't hold into the close as the Dow came up 10 points...
READ MORE
MEMBERS ONLY

Cooling Energy ETFs - New Intermediate-Term Trend Model Neutral Signals on XLE and RYE

by Erin Swenlin,
Vice President, DecisionPoint.com
Both the Energy SPDR (XLE) and its counterpart, the equally-weighted Energy ETF (RYE) triggered new Intermediate-Term Trend Model Neutral signals when the 20-EMAs crossed below the 50-EMAs while the 50-EMA was below the 200-EMA. We consider a stock, index, ETF, etc. to be in a "bull market" as...
READ MORE
MEMBERS ONLY
Key Relative Ratios Argue For Continuing Rally
by Tom Bowley,
Chief Market Strategist, EarningsBeats.com
Market Recap for Monday, February 6, 2017
Please be sure to subscribe to my blog at the bottom of this article and all of my articles will be sent to your e-mail address as soon as they're published. Thanks! :-)
It's noteworthy to point out that...
READ MORE
MEMBERS ONLY
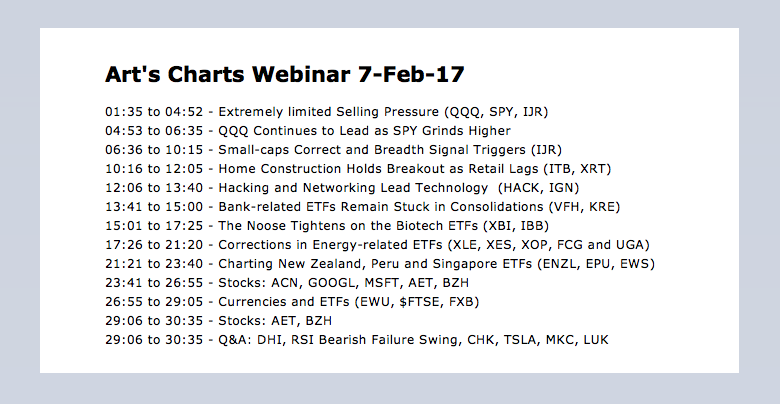
Webinar Recording - Minimal Selling Pressure - Are Small-Caps Ending their Correction? - HACK and IGN Lead Techs - Defense Breaks Out
by Arthur Hill,
Chief Technical Strategist, TrendInvestorPro.com
----- Webinar Video ----- Art's Charts ChartList -----
Today I will start out with simple close-only charts for SPY, QQQ and IJR. Close-only charts filter out the intraday noise and gaps that may occur between sessions. These charts show us just how dull the market has been since...
READ MORE
MEMBERS ONLY
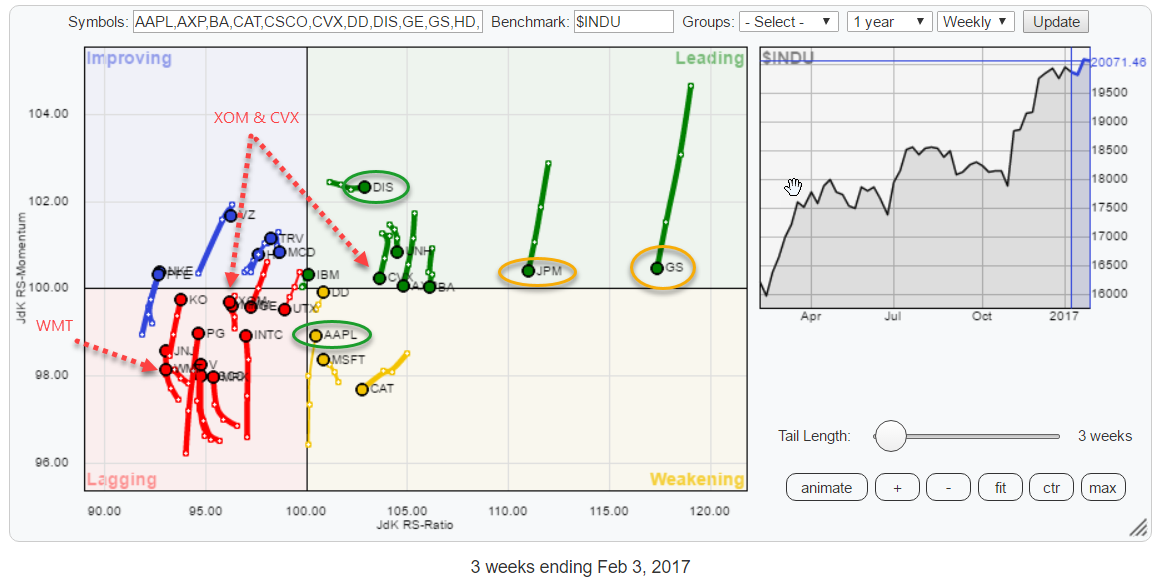
AAPL starting to lead technology sector rotation again
by Julius de Kempenaer,
Senior Technical Analyst, StockCharts.com
Summary
* Inside Financials, money is shifting from GS & JPM to V
* AAPL turning back up towards leading quadrant, makes it leading stock in technology
* XOM and CVX confirm weak rotation for Energy sector
* Opposite rotations for DIS and WMT inside Staples sector
Quick scan
The Relative Rotation Graph above...
READ MORE
MEMBERS ONLY
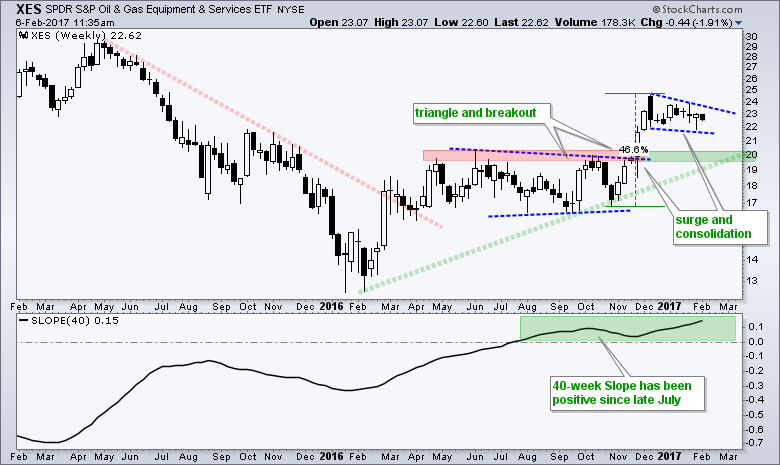
Oil & Gas Equipment & Services SPDR Stalls after Big Surge
by Arthur Hill,
Chief Technical Strategist, TrendInvestorPro.com
The Oil & Gas Equipment & Services SPDR (XES) surged to 52-week highs in November and early December. It is clear after this surge that the bigger trend is up. First, the 40-week Slope turned positive in late July and remains positive. Second, the ETF broke out of a large...
READ MORE
MEMBERS ONLY
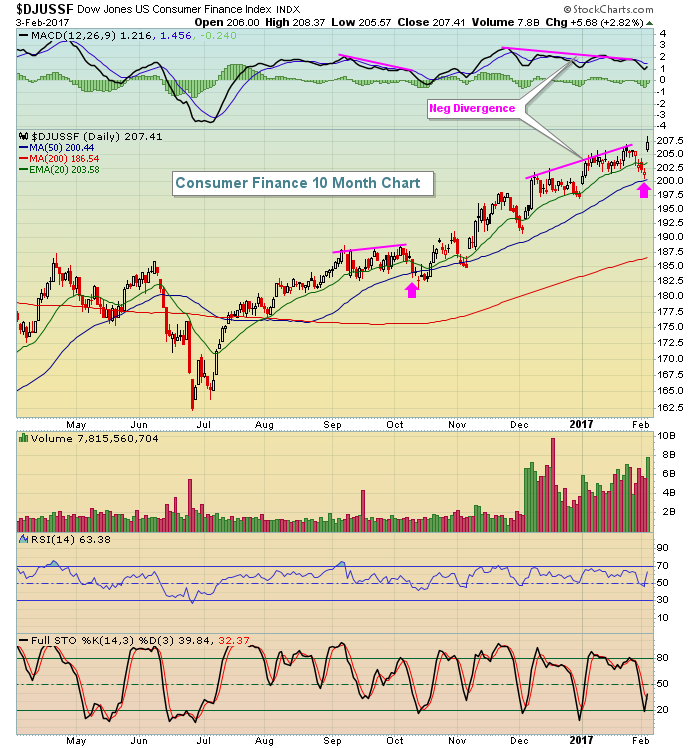
Financials Lead Dow Jones Back Above 20,000
by Tom Bowley,
Chief Market Strategist, EarningsBeats.com
Market Recap for Friday, February 3, 2017
Financials (XLF, +2.02%) had another huge day with consumer finance, investment services and banks leading the charge. The former had been struggling with a negative divergence over the past couple months while remaining in an uptrend. But just after testing its 50...
READ MORE
MEMBERS ONLY
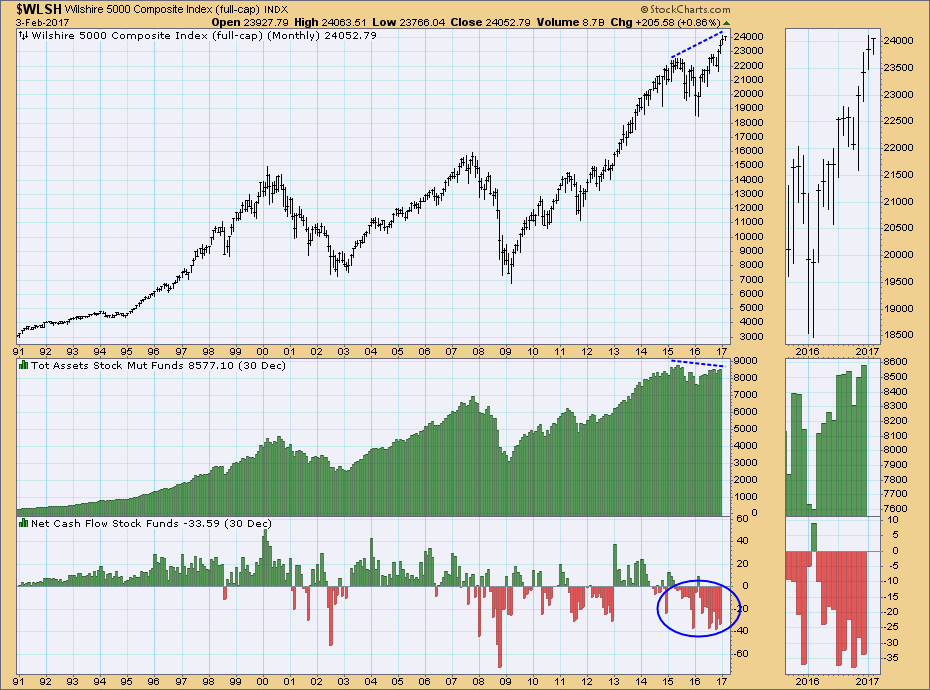
Net Cash Flow Going In Wrong Direction
by Carl Swenlin,
President and Founder, DecisionPoint.com
With some broad market indexes making record highs, one would think that total mutual fund assets would be following suit. But no. As of the end of December Total Stock Mutual Fund Assets were still below the record highs set in 2015, and are failing to confirm record price highs....
READ MORE
MEMBERS ONLY
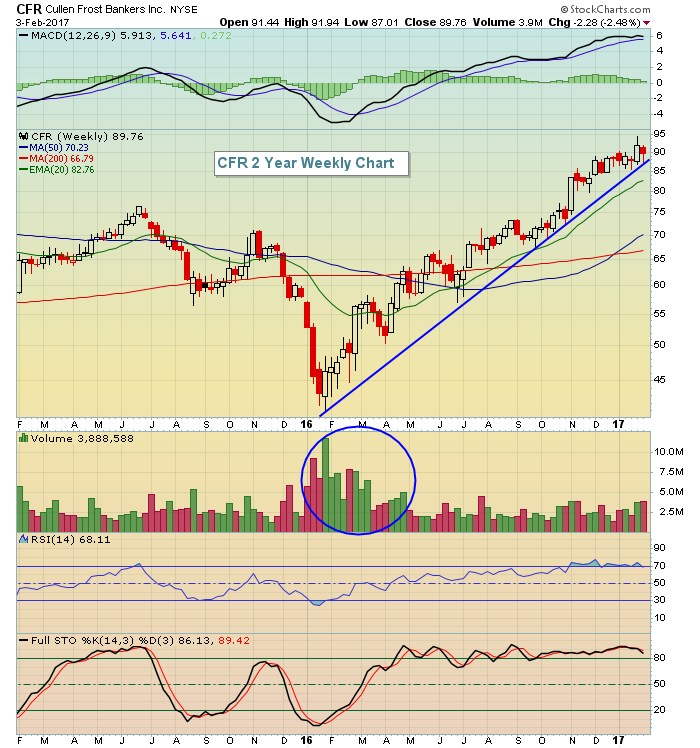
Using Support, Resistance And Trendlines To Better Your Trading
by Tom Bowley,
Chief Market Strategist, EarningsBeats.com
Exercising patience and discipline to enter trades at appropriate reward vs. risk levels is obviously very important to any trader's success, but planning trades before they set up is just as important. Let me give you a few examples. First, let's take a look at Cullen...
READ MORE
MEMBERS ONLY
Dow and S&P 500 End Week On a Strong Note
by John Murphy,
Chief Technical Analyst, StockCharts.com
What started off as a soft week for stocks ended on a strong note. Friday's gain was enough to keep stock indexes basically flat for the entire week. But there was some improvement on the charts. The daily bars in Chart 1 show the Dow Industrials jumping 186...
READ MORE
MEMBERS ONLY

FINANCIALS LEAD FRIDAY'S STOCK BOUNCE -- SO DO SMALL CAPS AND TRANSPORTS -- HEALTCHARE IS WEEK'S STRONGEST SECTOR -- HCA HOLDINGS ACHIEVES BULLISH BREAKOUT -- AMGEN SURGES
by John Murphy,
Chief Technical Analyst, StockCharts.com
DOW AND S&P 500 END WEEK ON A STRONG NOTE ... What started off as a soft week for stocks ended on a strong note. Friday's gain was enough to keep stock indexes basically flat for the entire week. But there was some improvement on the charts....
READ MORE
MEMBERS ONLY
Sectors. Groups. Stocks.
by Bruce Fraser,
Industry-leading "Wyckoffian"
Let’s continue our discussion about using Relative Strength Analysis to find leading stocks. A blend of Wyckoff analysis and Relative Strength analysis offers an efficient method for zoning in on the best leading stock candidates. In the prior post, Industry Group analysis was explored. Here we will jump into...
READ MORE
MEMBERS ONLY

Weekly Market Review & Outlook (with Video) - Healthcare Heats Up - Energy Extends Correction - Bonds Remain Weak - Gold and Dollar Hit Reversal Zones
by Arthur Hill,
Chief Technical Strategist, TrendInvestorPro.com
Weekly Performance Review
There was a lot of pushing and shoving in the markets this week. Stocks started the week with a modest move lower and finished the week with a modest move higher. The end result was a .16% gain for the S&P 500 SPDR. The 20+...
READ MORE
MEMBERS ONLY
New Highs Expand in the Healthcare Sector
by Arthur Hill,
Chief Technical Strategist, TrendInvestorPro.com
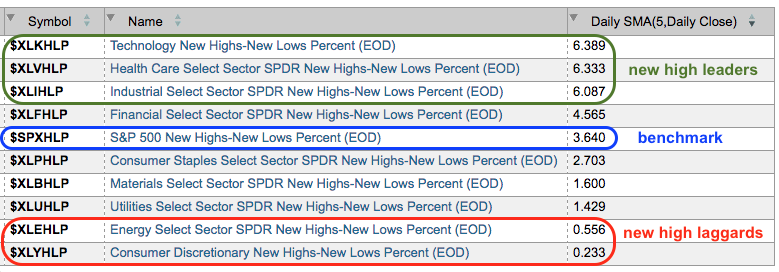
New highs are a sign of underlying strength and chartists can measure this indicator using High-Low Percent. In particular, I like to rank the nine sectors by High-Low Percent or a moving average of High-Low Percent. Note that High-Low Percent equals new highs less new lows divided by total issues....
READ MORE
MEMBERS ONLY
Stocks Relative to Their 52-Week High-Low - SPX v. NDX
by Erin Swenlin,
Vice President, DecisionPoint.com
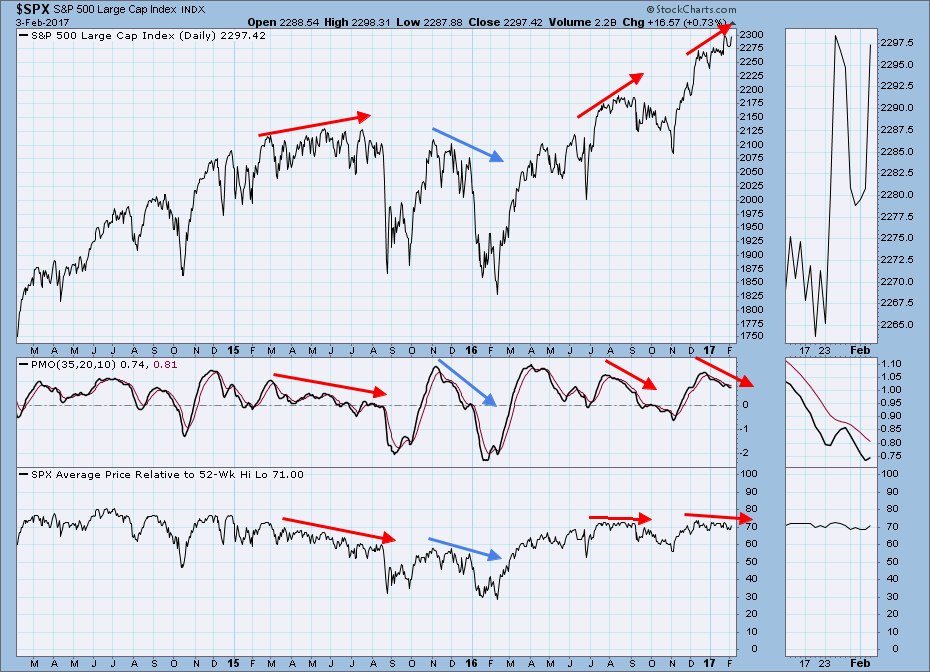
Today during my DecisionPoint Report webinar, I pulled the intermediate-term indicator chart of SPX Stocks Relative to Their 52-Week Hi-Lo to show my viewers the divergences that are all over this chart. After I finished the webinar and reviewed the chart again, I decided it would be great to see...
READ MORE
MEMBERS ONLY
No Chasing Allowed

by John Hopkins,
President and Co-founder, EarningsBeats.com
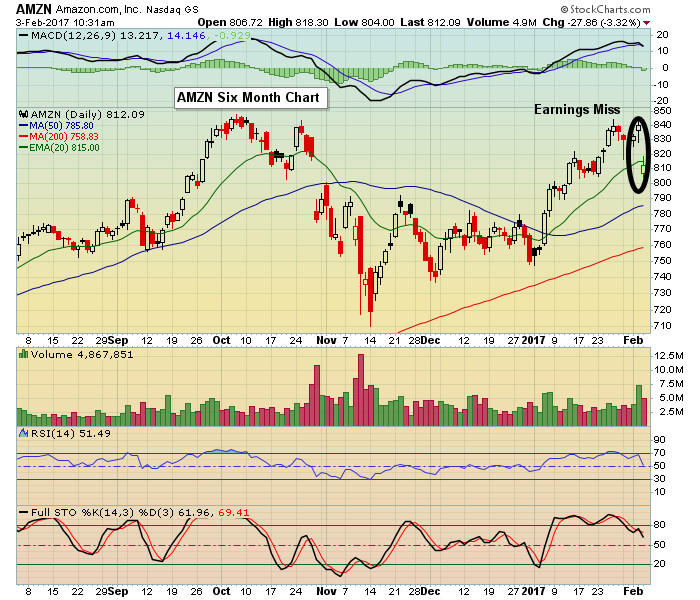
At EarningsBeats we are steadfast in avoiding being involved in stocks into a company's earning's report because one can never tell how the market will respond to a company's numbers. Case in point is Amazon who reported their numbers last week.
Just look at...
READ MORE
MEMBERS ONLY

How Investing, Brain Training and Longevity Fit Together
by Gatis Roze,
Author, "Tensile Trading"
Yes, the fountain of youth really does exist, and academic research is increasingly proving it to be found amidst your investment portfolio. A growing body of scholarly research shows that, in many ways, life can get better as we get older, and being an active investor can contribute in significant...
READ MORE
MEMBERS ONLY
February Is A Time For Toys And The Chart Agrees
by Tom Bowley,
Chief Market Strategist, EarningsBeats.com
Market Recap for Thursday, February 2, 2017
Defensive stocks were once again at the forefront of U.S. stock market action on Thursday with utilities (XLU, +1.06%) and consumer staples (XLP, +0.92%) easily the best two sectors on the session. Over the past week, healthcare (XLV, +2.79%...
READ MORE
MEMBERS ONLY

The January Barometer - Myth or Statistically Relevant?
by Erin Swenlin,
Vice President, DecisionPoint.com
Yale Hirsch was the first to propose, "As the Standard & Poor's goes in January, so goes the year". Simply meaning, if the S&P 500 closes higher in January, the end of the year should finish higher OR if it closes lower, it will...
READ MORE
MEMBERS ONLY

Are Housing Stocks Topping Out?
by Martin Pring,
President, Pring Research
* Housing economic data is finely balanced
* The long-term technicals for housing equities are also evenly matched
* The bearish short-term picture could be the domino that tips everything
Housing economic data is finely balanced
The housing industry has not exactly been on a roll since the last recession, but it has...
READ MORE
MEMBERS ONLY
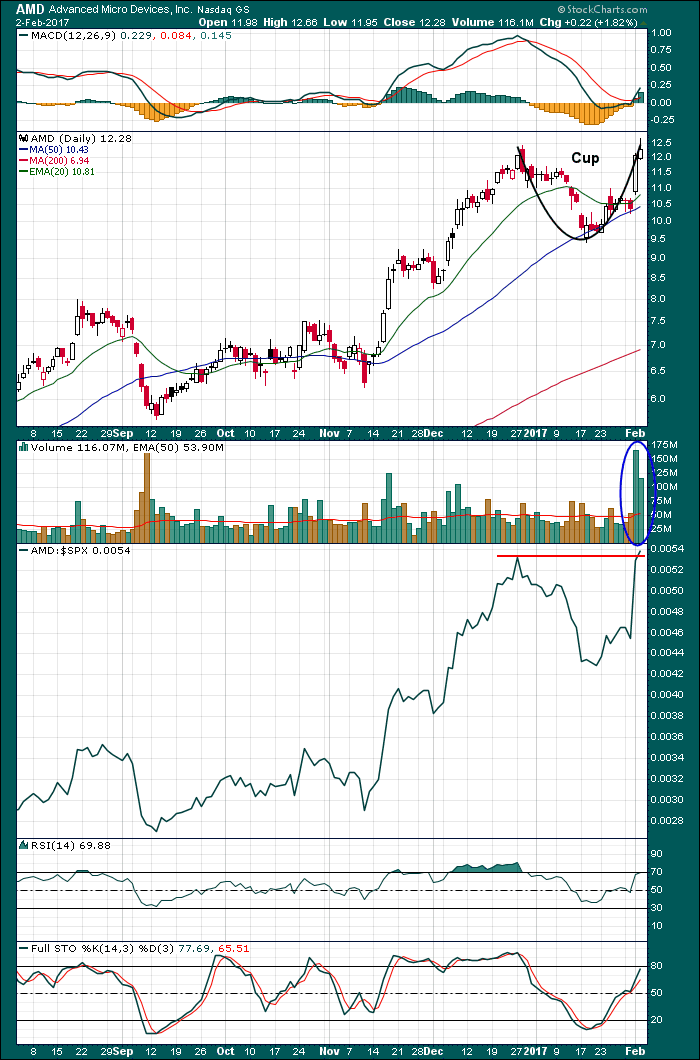
AMD Completes Right Side Of Cup
by Tom Bowley,
Chief Market Strategist, EarningsBeats.com
Advanced Micro Devices (AMD) was one of the best performing stocks in 2016 and the bullish pattern that's printed in the first five weeks of 2017 suggests the rally hasn't ended just yet. One bearish development today was that AMD broke out above its late December...
READ MORE
MEMBERS ONLY

TECHNOLOGY SECTOR REACHES OVERBOUGHT TERRITORY -- BIG TECH STOCKS ARE UP AGAINST RESISTANCE OR PULLING BACK -- HEALTHCARE WINNERS INCUDE IDEXX LABS, BOSTON SCIENTIFIC, AND MERCK -- HCA HOLDINGS MAY BE NEAR BULLISH BREAKOUT
by John Murphy,
Chief Technical Analyst, StockCharts.com
TECHNOLOGY SPDR FINALLY REACHES OVERBOUGHT TERRITORY ... One of the trends supporting the stock market rally has been a strong technology sector. That group, however, has reached overbought territory for the first time in six months and is starting to weaken. Chart 1 shows the 14-day RSI for the Technology SPDR...
READ MORE