MEMBERS ONLY
Blame Small-Caps - A Surprising Sector Shows Leadership in 2017 - EEM Nears 52-week High - ChartList Update

by Arthur Hill,
Chief Technical Strategist, TrendInvestorPro.com
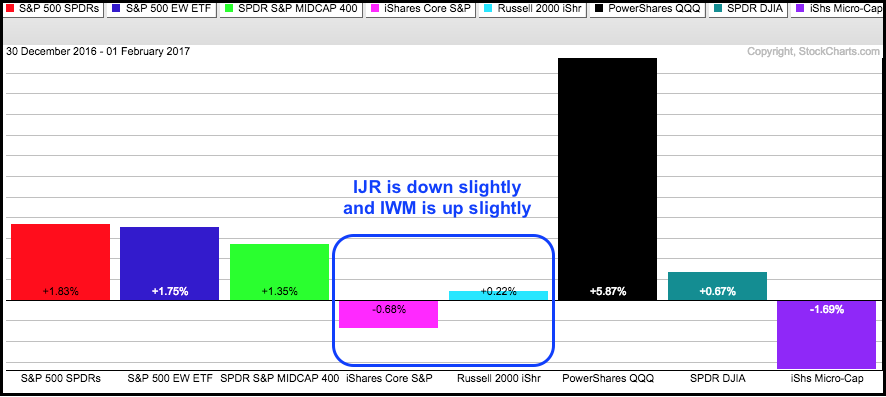
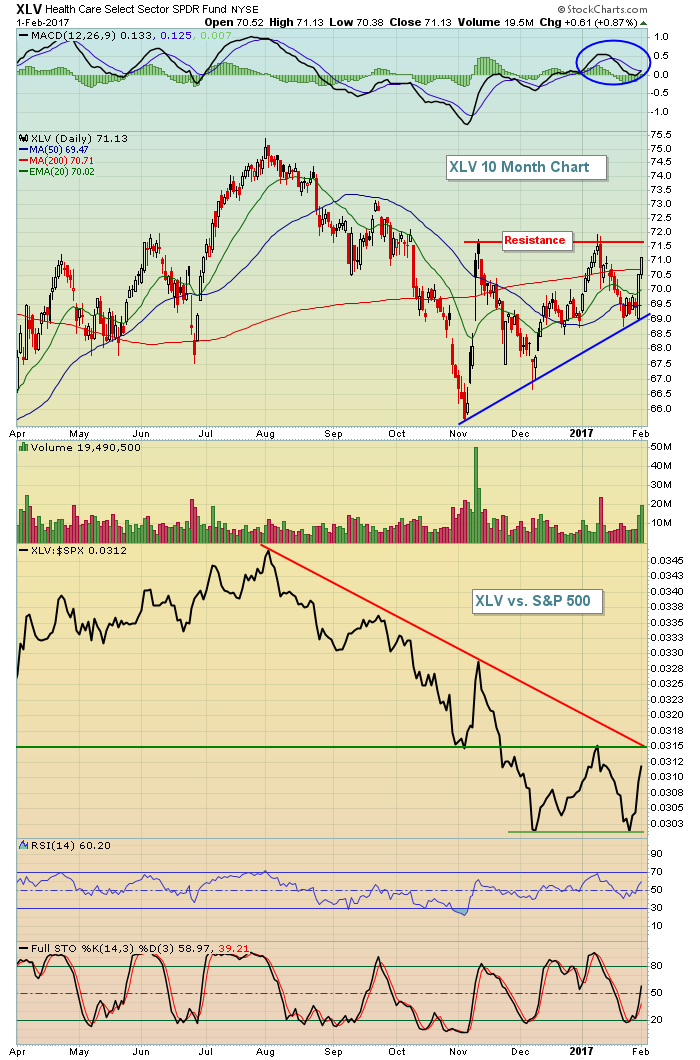
Blame Small-Caps for Mixed Up Market .... A Big Surprise for the 3rd Leading Sector .... Breadth Indicators Trigger for Healthcare Sector .... XLV Moves back above Long-term Moving Averages .... Biotech ETFs Spring Back to Life .... Emerging Markets ETF Nears 52-week High .... ChartList Update (16 stocks) .... Food for Thought .... //// ....
Blame Small-Caps for Mixed...
READ MORE
MEMBERS ONLY
Healthcare Leads Wednesday Rally But Still Suffers From Relative Weakness

by Tom Bowley,
Chief Market Strategist, EarningsBeats.com
Market Recap for Wednesday, February 1, 2017
U.S. equities staged a recovery on Wednesday after a recent bout of profit taking, but the recovery could've been much stronger after a very solid open. The NASDAQ jumped 40 points at the open after Apple (AAPL) posted results well...
READ MORE
MEMBERS ONLY

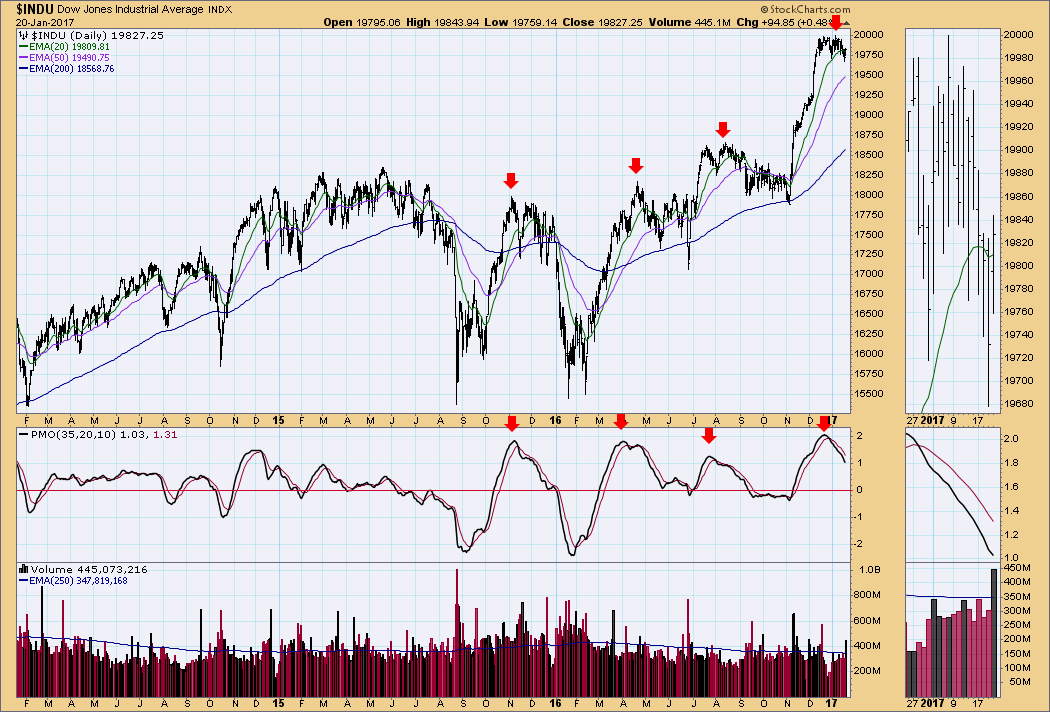
Capitalization

by Greg Morris,
Veteran Technical Analyst, Investor, and Author
This will not be about punctuation. Have you ever wondered why most of the media focuses on the Dow Jones Industrial Index? Some would say it isn’t a good measure of the overall market, including me? Yet, it does a reasonable job of representing the overall market. Same goes...
READ MORE
MEMBERS ONLY

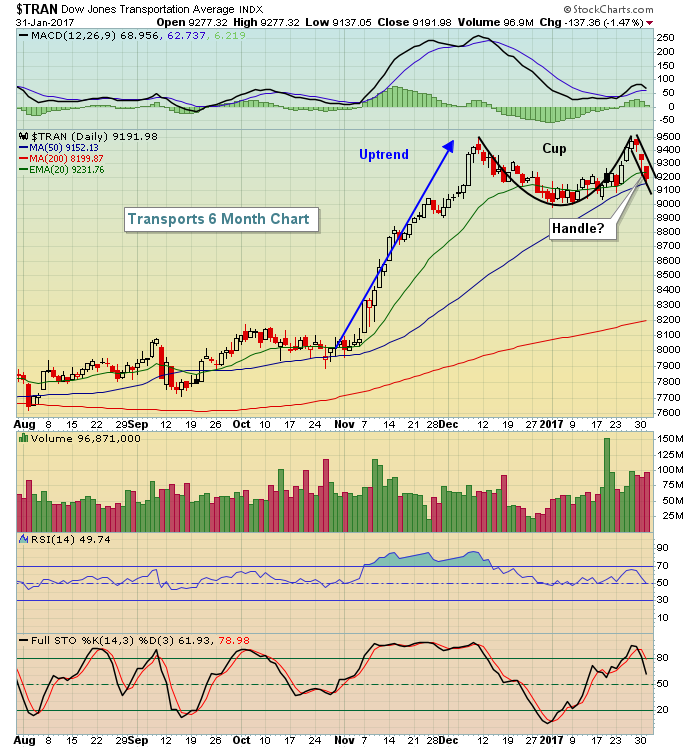
DOLLAR STILL UNDER PRESSURE -- BUT EURO AND YEN ARE STILL IN DOWNTRENDS -- GOLD'S TREND MAY DEPEND ON THE EURO -- DOW MAY RETEST 50-DAY LINE -- TRANSPORTS FAIL TO REACH NEW HIGHS -- UTILITIES WEAKEN AT 200-DAY LINE -- APPLE NEARS RECORD HIGH

by John Murphy,
Chief Technical Analyst, StockCharts.com
DOLLAR BREAKS SHORT-TERM SUPPORT... I keep writing about prospects for a bounce in the U.S. Dollar, and it keeps dropping. My last message showed the PowerShares Dollar Index Fund (UUP) testing chart support at its early December low. The red circle in Chart 1 shows the UUP slipping below...
READ MORE
MEMBERS ONLY
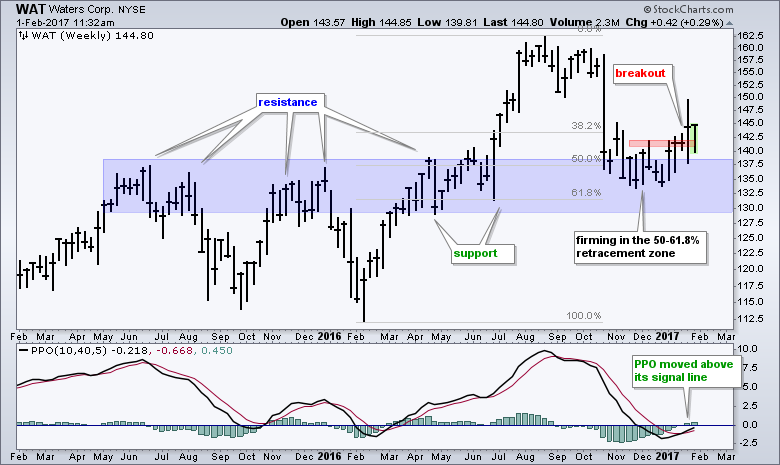
Waters Corp Turns Up and Leads in 2017
by Arthur Hill,
Chief Technical Strategist, TrendInvestorPro.com
Waters Corp (WAT) was hit hard with a double-digit decline in October, but the stock ultimately firmed in November-December and turned up in 2017. Waters Corp is in the top 20% of S&P 500 stocks for year-to-date gain. The chart also looks rather promising. Even though the October...
READ MORE
MEMBERS ONLY
Apple Beats Earnings Estimate; Tech Poised To Jump
by Tom Bowley,
Chief Market Strategist, EarningsBeats.com
Market Recap for Tuesday, January 31, 2017
It was a second day of rotation into defensive stocks as leadership came from healthcare (XLV, +1.60%), utilities (XLU, +1.55%) and consumer staples (XLP, +0.48%). Unfortunately, all of the aggressive sectors were lower and that kept a lid on overall...
READ MORE
MEMBERS ONLY

The Main Trend Is Still Positive But The Consensus Says?

by Martin Pring,
President, Pring Research
* One reliable long-term indicator is bullish
* What are the short-term indicators saying?
* Bottom fisher to the rescue?
The long-term indicators for equities have been pointing north for quite a while. Quite often I’ll include one of those indicators in my articles as testimony to the bull, but hedge my...
READ MORE
MEMBERS ONLY
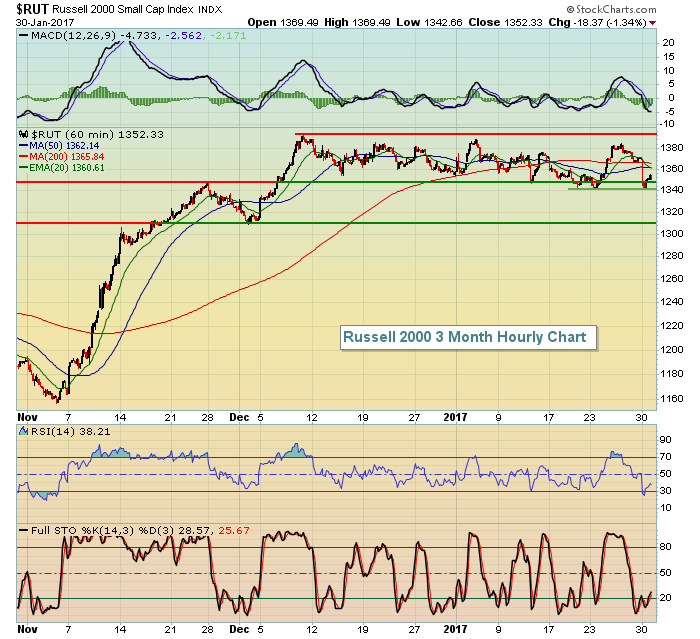
Here Are The Key Support Levels To Watch
by Tom Bowley,
Chief Market Strategist, EarningsBeats.com
Market Recap for Monday, January 30, 2017
It was most definitely a day of profit taking across U.S. equities on Monday. All of our major indices finished lower, although an afternoon rally did cut into some of the earlier losses. Still, the Russell 2000 was hit hardest and finished...
READ MORE
MEMBERS ONLY
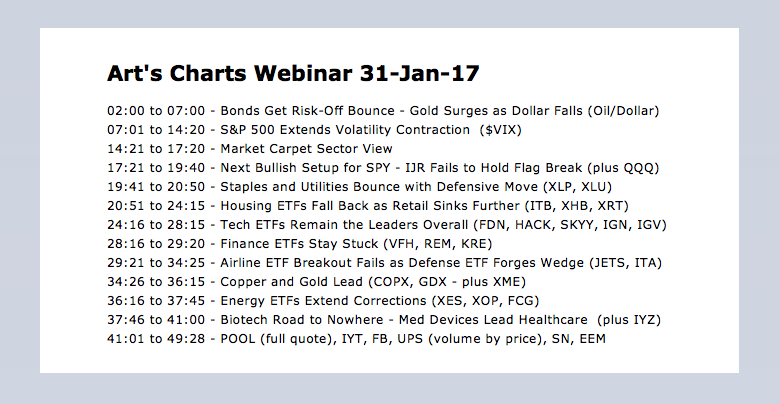
Webinar Video - Volatility Contraction Extends - Next Bullish Setup for SPY - Retail SPDR Bucks the Selling
by Arthur Hill,
Chief Technical Strategist, TrendInvestorPro.com
----- Webinar Video ----- Art's Charts ChartList -----
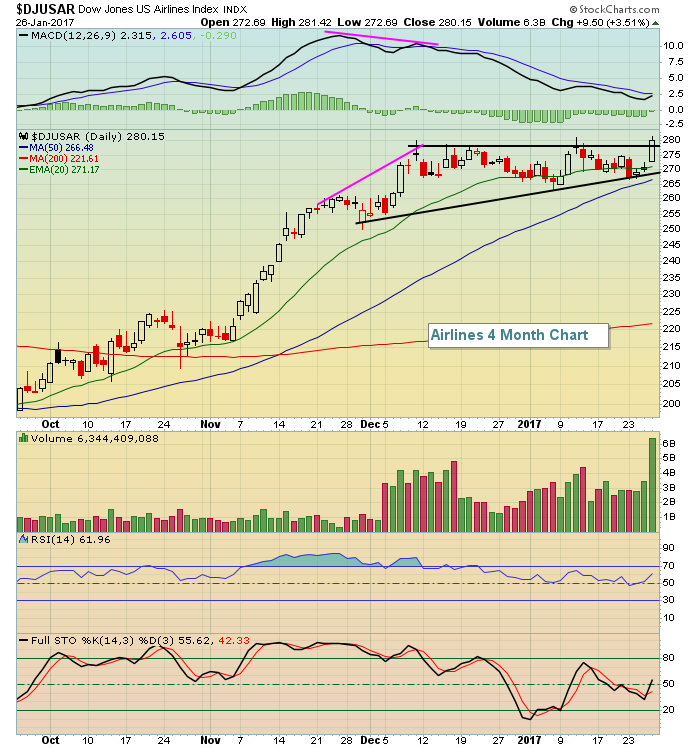
S&P 500 Extends Volatility Contraction .... The Next Bullish Setup for SPY .... IJR Fails to Hold Flag Break .... Housing ETFs Take a Hit, but Breakouts Remain .... Retail ETF Bucks the Selling Pressure .... Airline ETF Fails to Hold Breakout .... iShares...
READ MORE
MEMBERS ONLY
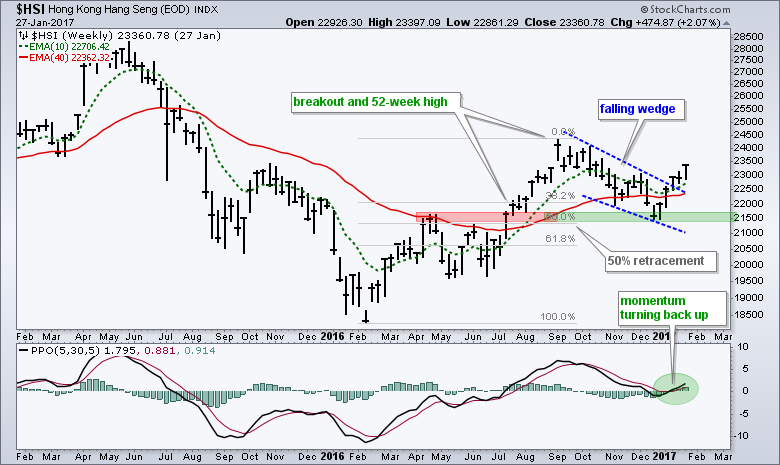
Hang Seng Reverses after a Normal Correction
by Arthur Hill,
Chief Technical Strategist, TrendInvestorPro.com
The Hang Seng Composite ($HSI) is having a good year with a 6% gain year-to-date. The weekly chart also looks bullish because the big trend is up and a correction just ended. First, the index broke resistance with a sharp advance from late June to early September. Second, the index...
READ MORE
MEMBERS ONLY
February Typically Sees This Sector Shine
by Tom Bowley,
Chief Market Strategist, EarningsBeats.com
Market Recap for Friday, January 27, 2017
Last week was a milestone week for U.S. equities as the Dow Jones closed above 20000 for the first time in its history and the S&P 500 tagged 2300 for the first time as well. But that doesn't...
READ MORE
MEMBERS ONLY
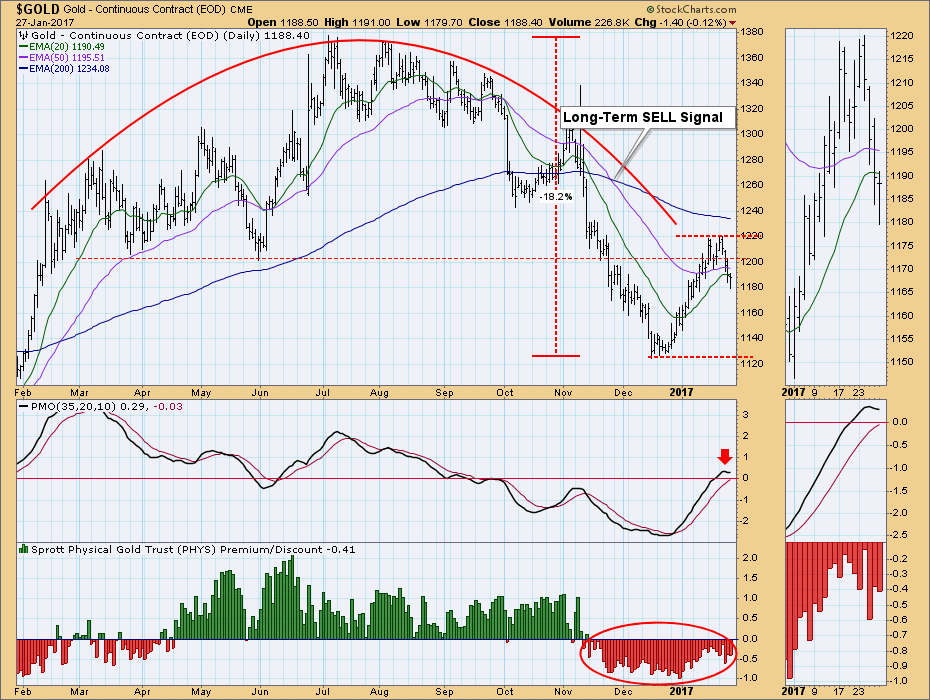
Gold Rally Stumbles

by Carl Swenlin,
President and Founder, DecisionPoint.com
After correcting nearly -20% from the July 2016 top, gold rallied off the December low, hitting a rally high on Monday. Then it spent the rest of the week correcting, dropping below horizontal support set last year. It also dropped below the 20EMA and 50EMA, which action turned those EMAs...
READ MORE
MEMBERS ONLY
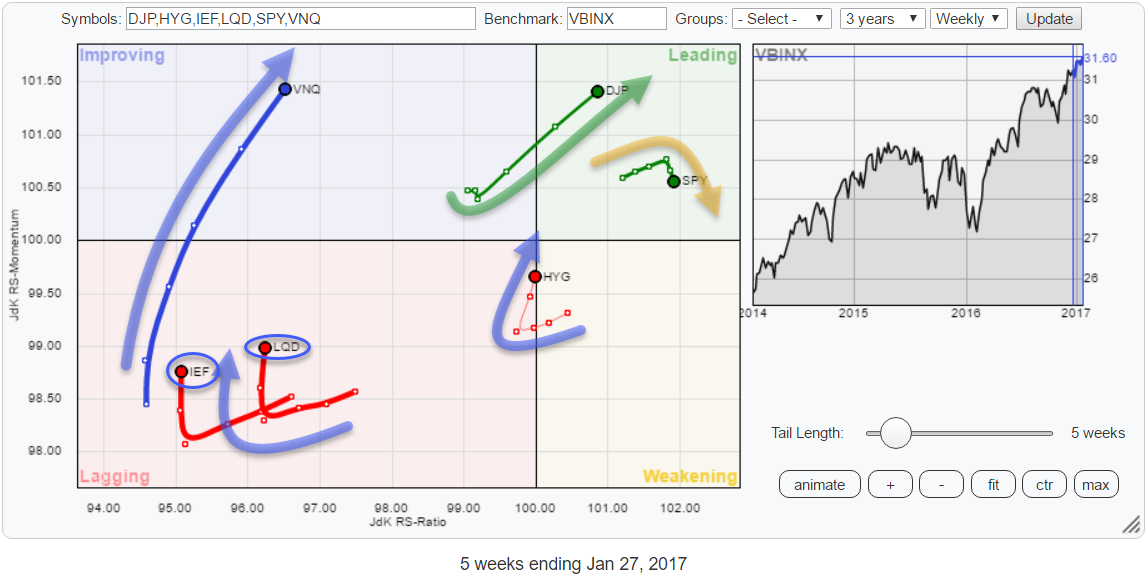
RRG shows money flowing into commodities!

by Julius de Kempenaer,
Senior Technical Analyst, StockCharts.com
The Relative Rotation Graph holding a number of asset class ETFs is showing a strong push of commodities (DJP) into the leading quadrant. Together with Real Estate (VNQ), these two asset classes are showing the most powerful headings in combination with the longest tails.
They deserve a further investigation.
Summary...
READ MORE
MEMBERS ONLY
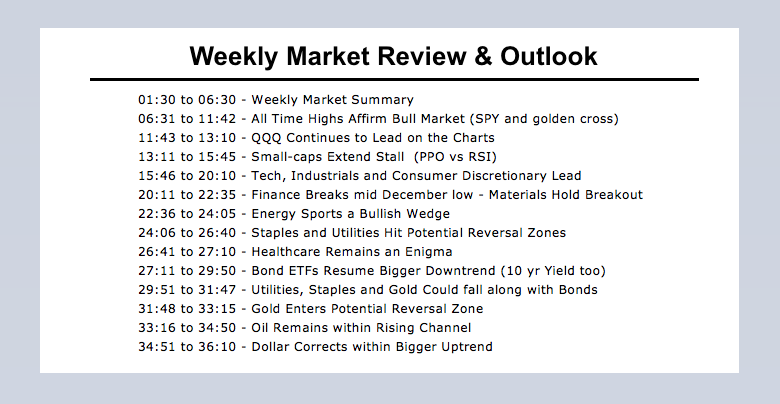
Weekly Market Review & Outlook Video - Bullish Percent Index Rankings and High-Low Percent Rankings
by Arthur Hill,
Chief Technical Strategist, TrendInvestorPro.com
This is a companion video to the written Weekly Market Review & Outlook. After starting with an overview of the weekly standouts, I also look into the components for the Cyber Security ETF (06:50 mark), scanning for High-Low Percent (18:00 mark) and a table ranking the Bullish Percent...
READ MORE
MEMBERS ONLY

In Gear with Relative Strength

by Bruce Fraser,
Industry-leading "Wyckoffian"
Wyckoffians find Relative Strength analysis to be very useful and illuminating. Relative Strength studies can be like having X-ray vision. With Relative Strength tools, one can see important hidden secrets about the health of a stock or industry group. Relative Strength analysis is simple and straightforward to apply and is...
READ MORE
MEMBERS ONLY
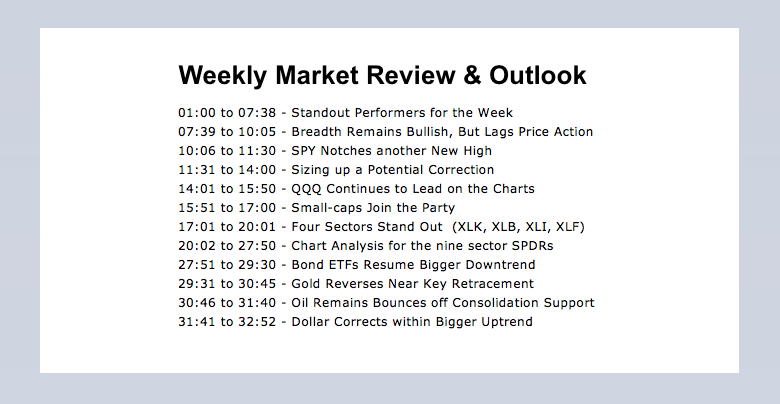
Weekly Market Review & Outlook - Breadth Remains Bullish, but Lags Price Action - Ranking the Sector by Bullish Percent and High-Low Percent - Bonds, Gold, Oil and Dollar
by Arthur Hill,
Chief Technical Strategist, TrendInvestorPro.com
.... Weekly Market Review & Outlook
.... Breadth Remains Bullish, But Lags Price Action
.... SPY Notches another New High
.... Sizing up a Potential Correction
.... QQQ Continues to Lead on the Charts
.... Small-caps Join the Party with Flag Breakout
.... Four Sectors Stand Out (XLK, XLI, XLB, XLF)
.... Materials Sector Extends Breakout
.... Energy Sports...
READ MORE
MEMBERS ONLY

Charts I'm Stalking: Action Practice #10

by Gatis Roze,
Author, "Tensile Trading"
Profits and Consistency — these should both go hand-in-hand and be goals for every successful investor. Profits are the result of a methodology that you can apply with clarity and understanding. Consistency is the result of being able to replicate your winning methodology in a recurring manner.
Action Practice #9 challenged...
READ MORE
MEMBERS ONLY

STOXX EUROPE 600 STOCK INDEX REACHES HIGHEST LEVEL IN A YEAR -- EUROPEAN BOND YIELDS ARE ALSO RISING -- A WEAK EURO MAKES EURO COMMODITY INFLATION EVEN HIGHER -- DOLLAR IS TRYING TO BOUNCE OFF CHART SUPPORT -- GOLD STRUGGLES WITH RESISTANCE
by John Murphy,
Chief Technical Analyst, StockCharts.com
STOXX EUROPE 600 HITS 52-WEEK HIGH... My last message focused on the idea that foreign stocks were also turning up which has strengthened the global rally. My main focus was on Europe which I'm returning to today. First, the rally the stocks. Chart 1 shows the STOXX Europe...
READ MORE
MEMBERS ONLY

World Equities Surging to New Highs
by Martin Pring,
President, Pring Research
* Global A/D Line breaks to the upside
* Post-election trends
* US equities
* The 10-year Yield
* Gold
* The Dollar Index
* Commodities
Global A/D Line breaks to the upside
This week has seen an important breakout for equities. I am not referring to Dow 20,000 but to my Global A/...
READ MORE
MEMBERS ONLY
Russell 2000 Advance Measures to 1450 Or Another 5-6%
by Tom Bowley,
Chief Market Strategist, EarningsBeats.com
Market Recap for Thursday, January 26, 2017
It was another bifurcated day on the U.S. stock market Thursday as the Dow Jones was able to muster up another gain after piercing the psychological 20000 level on Wednesday. It was a small gain and it wasn't mirrored by...
READ MORE
MEMBERS ONLY

Natural Gas (UNG) Analysis Request - Heating Up?

by Erin Swenlin,
Vice President, DecisionPoint.com
I've begun taking symbol requests prior to my Wednesday and Friday webinars. Viewers are treated to a DecisionPoint viewpoint on their favorite symbols. This is an excellent opportunity to understand how to look at a chart and find what you need to in order to make an educated...
READ MORE
MEMBERS ONLY
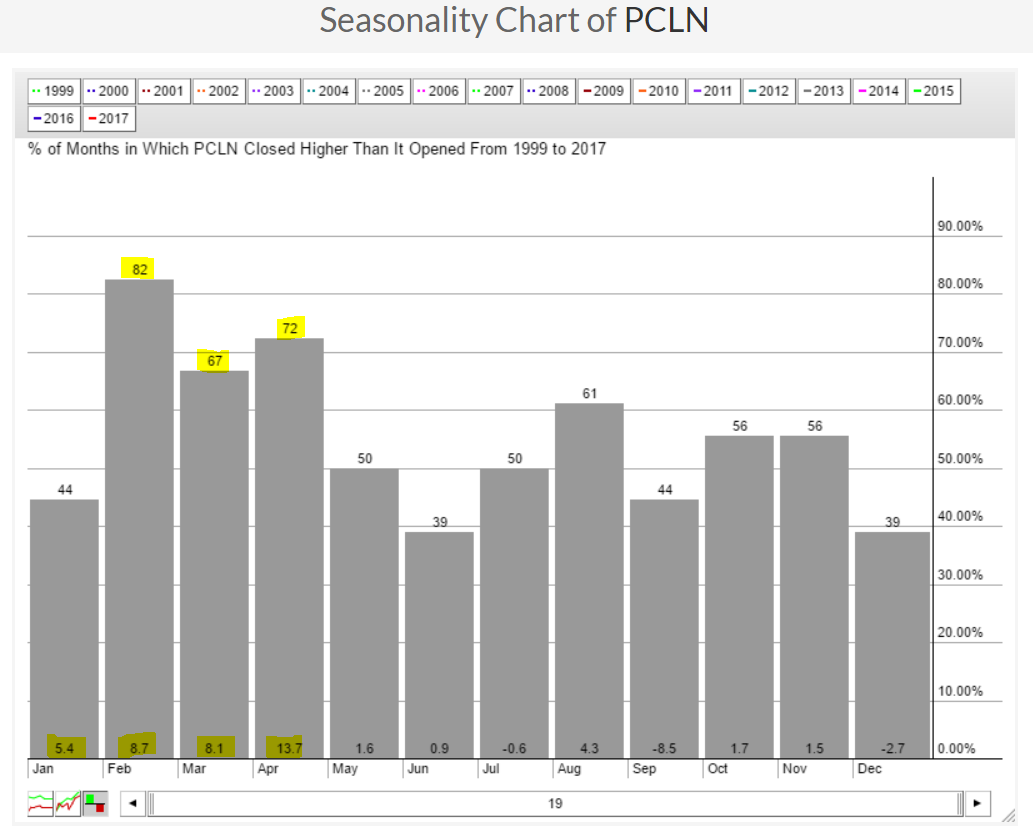
Seasonality Tool Helps You Plan Your Trades
by Tom Bowley,
Chief Market Strategist, EarningsBeats.com
I am always aware of typical historical strength that lies ahead. Along those lines, it's important to note that the Dow Jones U.S. Travel & Tourism Index ($DJUSTT) has been the fourth best industry group in terms of February performance. priceline.com (PCLN), a component of this...
READ MORE
MEMBERS ONLY
Transports and Financials Drive Dow Jones Above 20000
by Tom Bowley,
Chief Market Strategist, EarningsBeats.com
Market Recap for Wednesday, January 25, 2017
The Dow Jones kept searching for a catalyst to finally break that psychological 20000 barrier and it came in the form of a one-two punch from transports ($TRAN, +1.43%) and financials (XLF, +1.67%) that left no doubt about the strength of...
READ MORE
MEMBERS ONLY
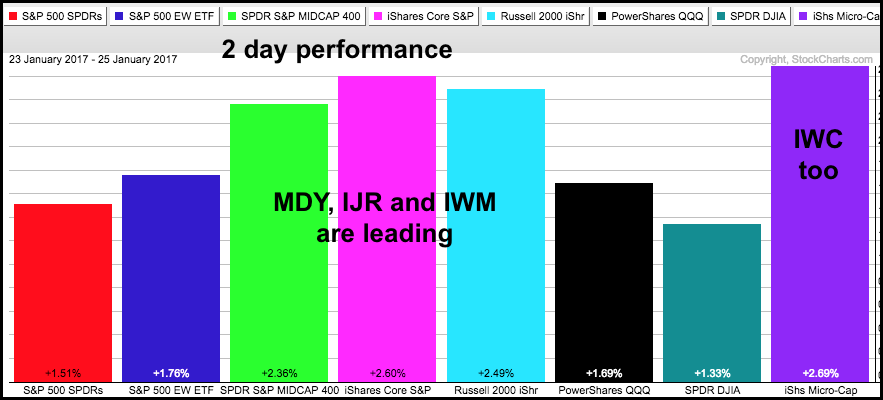
Mid-caps Leading - IJR Breaks Flag Resistance - New Highs Abound - 14 Stock Charts
by Arthur Hill,
Chief Technical Strategist, TrendInvestorPro.com
Small-caps Surge, but Mid-caps Lead Year-to-date .... IJR Breaks Flag Resistance .... SPY and QQQ Hit New Highs .... 14 Stocks Added to ChartList .... Food for Thought.... //// ....
I will start with the S&P SmallCap iShares (IJR) because it led the bounce over the last two days. The PerfChart shows the eight...
READ MORE
MEMBERS ONLY

GLOBAL STOCKS RALLY AS DOW CROSSES 20K -- ALL COUNTRY WORLD STOCK INDEX HITS NEW RECORD -- FOREIGN STOCK INDEX ACHIEVES BULLISH BREAKOUT -- DO DOES EUROPE -- RISING BOND YIELDS DRIVE MONEY OUT OF BONDS AND INTO STOCKS
by John Murphy,
Chief Technical Analyst, StockCharts.com
ALL COUNTRY WORLD INDEX HITS NEW RECORD ... The Dow Industrials finally exceeded the 20K threshold that everyone in the media has been focused on. That's puts all major U.S. stock indexes in record highs. What's also impressive is that the current stock rally is global...
READ MORE
MEMBERS ONLY
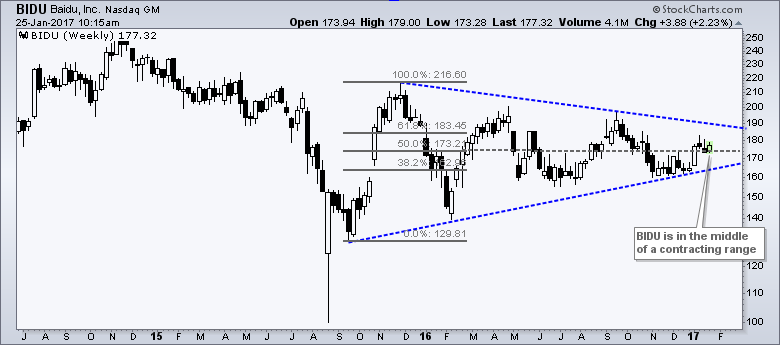
Baidu Forms a Bullish Pattern within a Massive Triangle (plus a Chaikin Money Flow Technique)
by Arthur Hill,
Chief Technical Strategist, TrendInvestorPro.com
Baidu (BIDU) has gone nowhere for a year as a large triangle pattern formed on the weekly chart. There are, however, signs of support and a short-term bullish pattern is emerging on the daily chart. First, the weekly chart shows a triangle that extends from around 120 to 218 at...
READ MORE
MEMBERS ONLY
FCX Confirms Inverse H&S Breakout; Materials Dominate
by Tom Bowley,
Chief Market Strategist, EarningsBeats.com
Market Recap for Tuesday, January 24, 2017
The S&P 500 and NASDAQ both closed at new all-time highs on Tuesday as basic materials (XLB, +2.58%) soared. Freeport-McMoran (FCX) was huge performer in the group and FCX is featured below in the Sector/Industry Watch section. But other...
READ MORE
MEMBERS ONLY

Rainy Weather is Sunny for California Water Services Group (CWT)
by Erin Swenlin,
Vice President, DecisionPoint.com
As I can attest to, California has been hit with a deluge of rain. We have needed it for a very long time to alleviate almost non-stop drought conditions. I found it interesting when I did a Short-Term Trend Model (STTM) technical scan, California Water Services Group (CWT) had just...
READ MORE
MEMBERS ONLY

MATERIALS SPDR HITS NEW HIGH -- LEADERS ARE CENTURY ALUMINUM, FREEPORT MCMORAN, INTERNATIONAL PAPER, AND DOW CHEMICAL -- DR HORTON LEADS HOMEBUILDERS HIGHER -- CONSUMER DISCRETIONARY SPDR REACHES NEW HIGH -- S&P 500 IS CLOSE
by John Murphy,
Chief Technical Analyst, StockCharts.com
MATERIALS SPDR HITS NEW RECORD ... Chart 1 shows the Materials Sector SPDR (XLB) surging to a record high. Equally impressive is that the fact that the XLB/SPX ratio (top of chart) has turned up as well. The XLB/SPX ratio has risen to the highest level in eighteen months...
READ MORE
MEMBERS ONLY
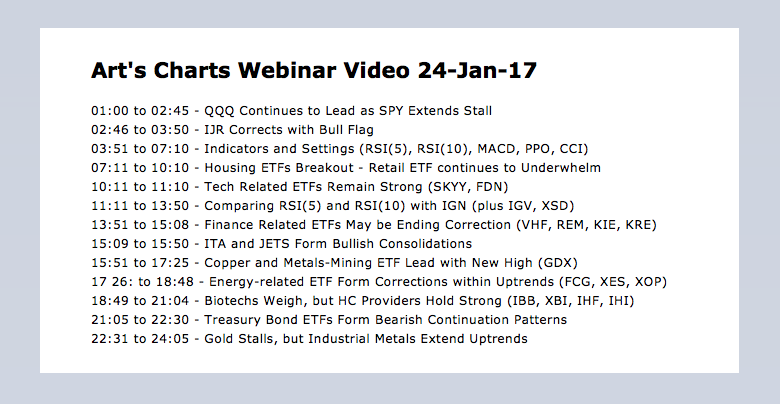
Webinar Video - Small-cap ETF Corrects with Bull Flag - Tech-related ETFs Continue to Lead - Housing, Retail and Banks Hold Market Back
by Arthur Hill,
Chief Technical Strategist, TrendInvestorPro.com
Webinar Video ..... QQQ Continues to Lead as SPY Extends Stall .... IJR Corrects with Bull Flag .... Indicators and Settings .... Housing ETFs Remain in Corrective Mode .... Retail ETF continues to Underwhelm .... Tech Related ETFs Remain Strong .... Comparing RSI(5) and RSI(10) with IGN .... Finance Related ETFs are Correcting .... RSI Enters Oversold...
READ MORE
MEMBERS ONLY
Internet Stocks Jump, Threaten Breakout
by Tom Bowley,
Chief Market Strategist, EarningsBeats.com
Market Recap for Monday, January 23, 2017
Materials (XLB, +0.20%) and technology (XLK, +0.18%) were the leading sectors on Monday as our major indices traded in negative fashion throughout the day. The finish, however, was fairly strong as the S&P 500 finished in the upper end...
READ MORE
MEMBERS ONLY
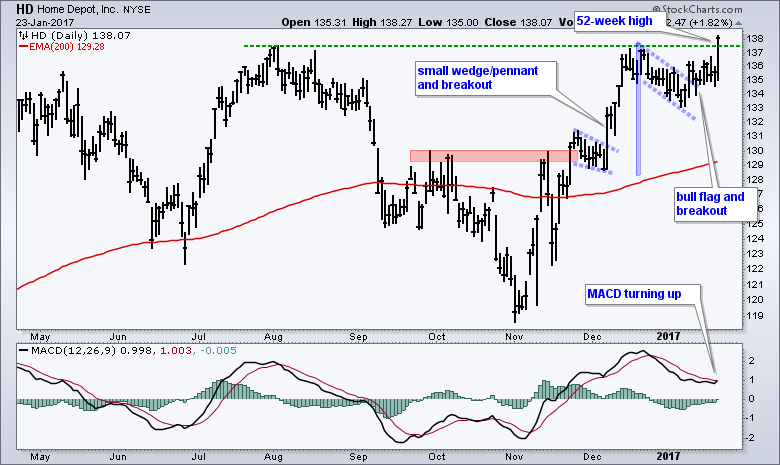
Home Depot Leads with Flag Breakout and 52-week High
by Arthur Hill,
Chief Technical Strategist, TrendInvestorPro.com
In what could be a good sign for housing and the economy, Home Depot (HD) exceeded its summer highs and hit a 52-week high. Home Depot is an interesting company because can be considered part of the housing industry and the retail industry. These two industries are very important to...
READ MORE
MEMBERS ONLY

Diversification and Multicollinearity
by Greg Morris,
Veteran Technical Analyst, Investor, and Author
Di-ver-si-fi-ca-tion
1. the act or process of diversifying; state of being diversified.
2. the act or practice of manufacturing a variety of products, investing in a variety of securities, selling a variety of merchandise, etc., so that a failure in or an economic slump affecting one of them will not...
READ MORE
MEMBERS ONLY
Computer Services Latest Technology Group To Break Out
by Tom Bowley,
Chief Market Strategist, EarningsBeats.com
Market Recap for Friday, January 20, 2017
Basic materials (XLB, +0.89%) led yet another U.S. stock market rally on Friday as the Dow Jones gained close to 100 points to once again approach what could become its first all-time closing high above 20000. After Friday's gain,...
READ MORE
MEMBERS ONLY
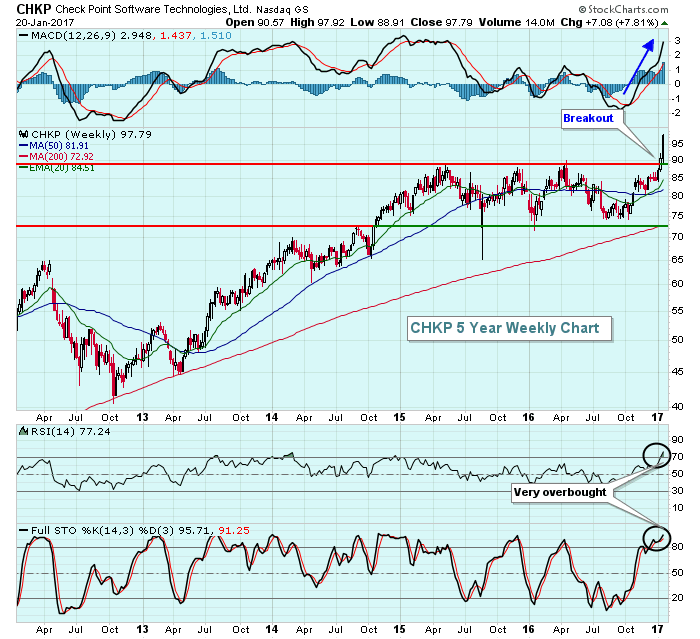
Check Point Breaks Out Of Very Bullish Pattern
by Tom Bowley,
Chief Market Strategist, EarningsBeats.com
My favorite kind of stocks are those that advance and then base for an extended period of time before breaking out. The consolidation period rids the stock of weak holders, providing a much better foundation for a sustainable rally. Check Point Software Technologies (CHKP) fits the bill after reacting quite...
READ MORE
MEMBERS ONLY
Dow Stocks in Bear Markets
by Carl Swenlin,
President and Founder, DecisionPoint.com
The Dow Jones Industrial Average is clearly in a bull market, having made a strong move in November and December to new, all-time highs and coming within less than a half point of reaching 20,000; however, as I perused the charts of the 30 Dow components I found three...
READ MORE
MEMBERS ONLY
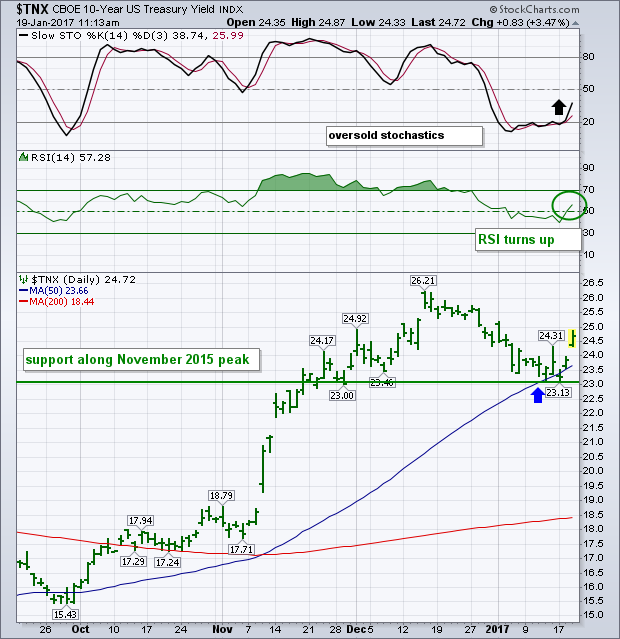
10-Year Treasury Yield Is Bouncing Off It's 50-Day Average, As is The Dollar
by John Murphy,
Chief Technical Analyst, StockCharts.com
The pullback in Treasury yields (coinciding with an oversold bounce in Treasury prices) may have run its course. Chart 1 shows the 10-Year Treasury Yield ($TNX) bouncing sharply off its 50-day moving average. The two momentum indicators above Chart 1 are also supportive. The 14-day RSI (green) line is back...
READ MORE
MEMBERS ONLY
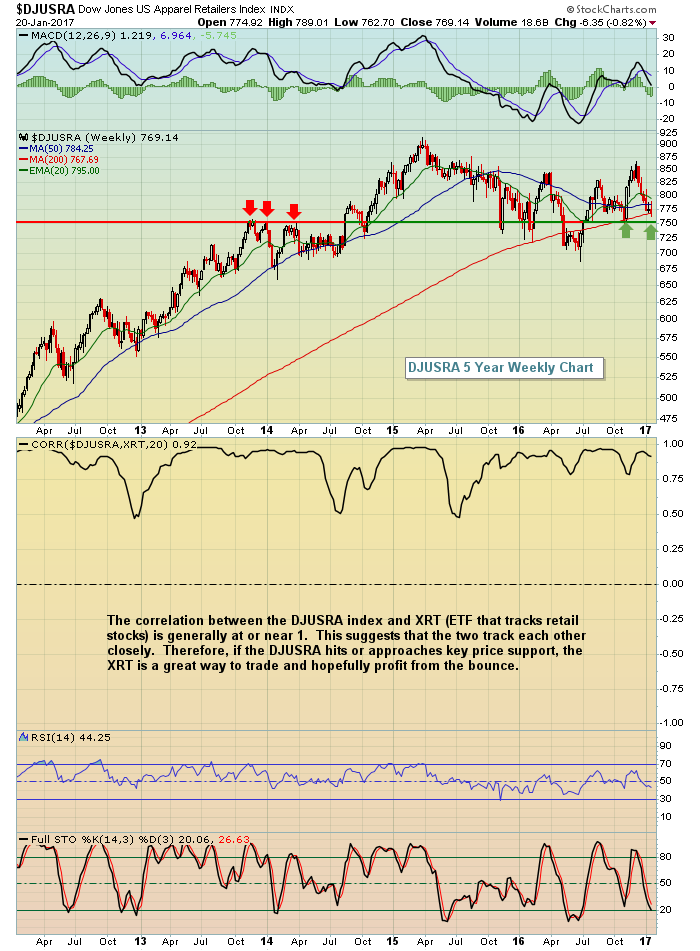
This Weak Industry Group Approaching Very Bullish Historical Period
by Tom Bowley,
Chief Market Strategist, EarningsBeats.com
There haven't been too many areas of the market that have performed worse than retail stocks over the past month. While the NASDAQ 100 ($NDX) has jumped to record highs over the past month, weak retail stocks in that index like Dollar Tree (DLTR), Walgreens (WBA), O'...
READ MORE
MEMBERS ONLY
Weekly Market Review & Outlook Video
by Arthur Hill,
Chief Technical Strategist, TrendInvestorPro.com
This is a companion video to go with the full written commentary (here). I will start out with a review of the weekly performers using the summary format on a ChartList. I will then move into the major index ETFs with special attention to SPY. I will also discuss the...
READ MORE
MEMBERS ONLY

Stair Step to Profits
by Bruce Fraser,
Industry-leading "Wyckoffian"
Let’s look back at 2016, Wyckoff style. As Wyckoffians, our mission is to sharpen our skills and to gain some ideas about how 2017 could unfold. The past year began with a stiff correction that cascaded into a Selling Climax in January. A classic Accumulation formed between January and...
READ MORE