MEMBERS ONLY
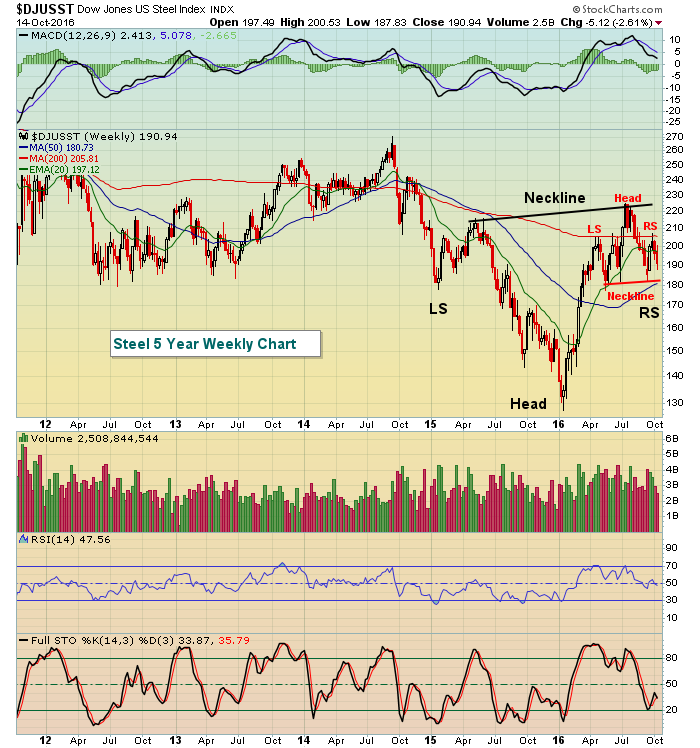
Looking Ahead To Potential November Strength

by Tom Bowley,
Chief Market Strategist, EarningsBeats.com
We've entered a very strong historical part of the year for our major indices and most sectors and industry groups. Today, I want to focus on one of the best of the best, the Dow Jones U.S. Steel Index ($DJUSST). Average DJUSST monthly gains over the past...
READ MORE
MEMBERS ONLY

Wyckoff Nation

by Bruce Fraser,
Industry-leading "Wyckoffian"
In the Wyckoff Nation we appreciate how the Wyckoff Method provides context. This is an advantage unique to this approach of chart analysis. We have learned that a process unfolds during the formation of Accumulation and Distribution. The perspective of context follows from becoming intimate with the nuances of this...
READ MORE
MEMBERS ONLY
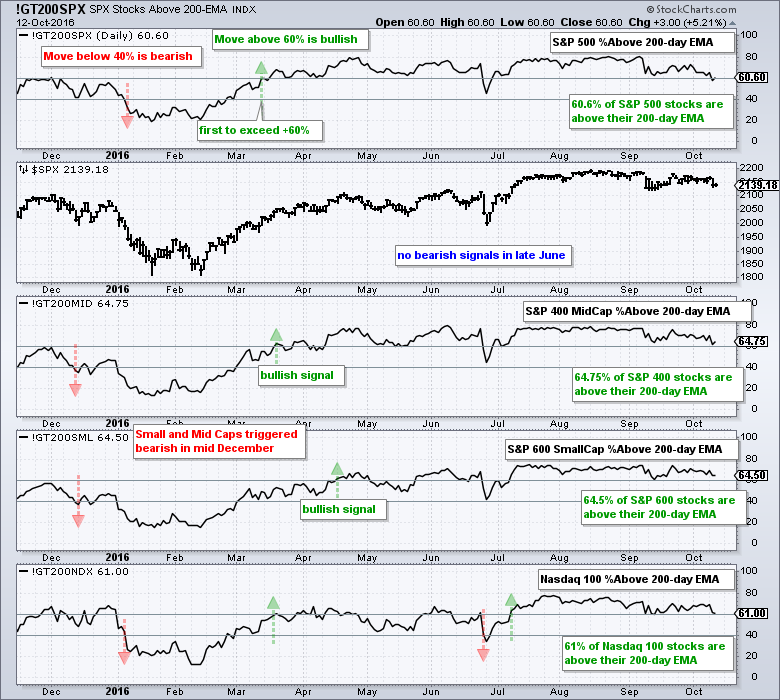
When Does a Correction Become Something More? - Using Small and Mid Cap Breadth to Foreshadow Broad Market Shifts

by Arthur Hill,
Chief Technical Strategist, TrendInvestorPro.com
A Negative Week, but a Positive Year .... Broader Market is Seriously Mixed .... S&P 500 Stalls above its Breakout Zone .... Small-caps and Mid-caps Sport Corrective Patterns .... Breadth Indicators Can Foreshadow Significant Changes .... Large-cap Breadth Remains Bullish .... Weight of the Evidence Table.... //// ....
A Negative Week, but a Positive Year
It...
READ MORE
MEMBERS ONLY
Broad Market is Seriously Mixed, but Breakouts are Holding
by Arthur Hill,
Chief Technical Strategist, TrendInvestorPro.com
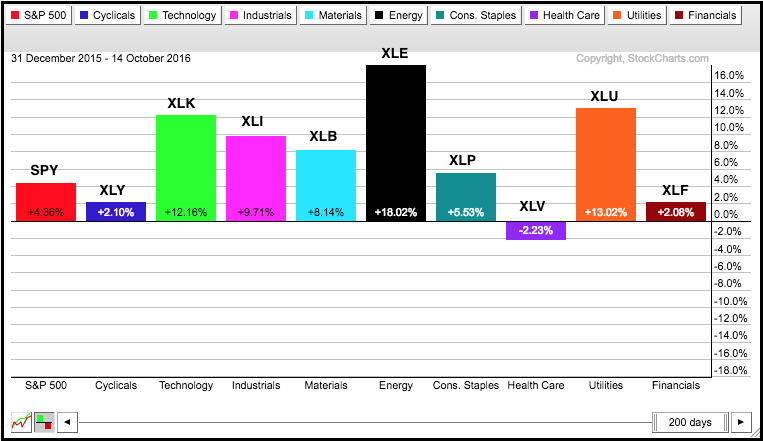
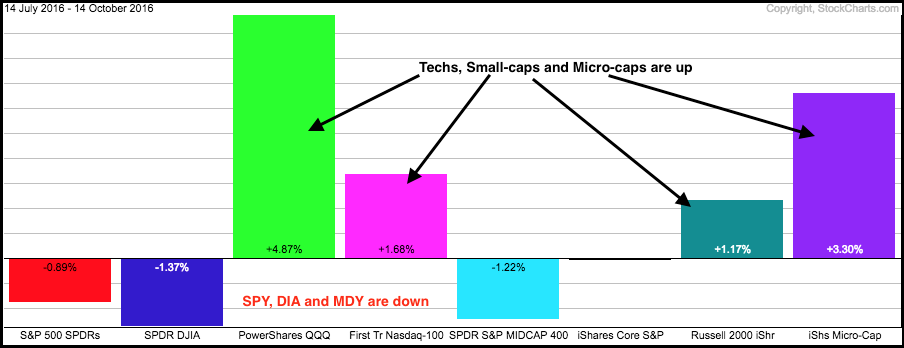
The broader market is incredibly mixed over the last three months. Even though performance divergences reflect a divided market, the major index ETFs are holding above their June highs and I view this as a correction within an uptrend. The PerfChart below shows eight major index ETFs with four up...
READ MORE
MEMBERS ONLY
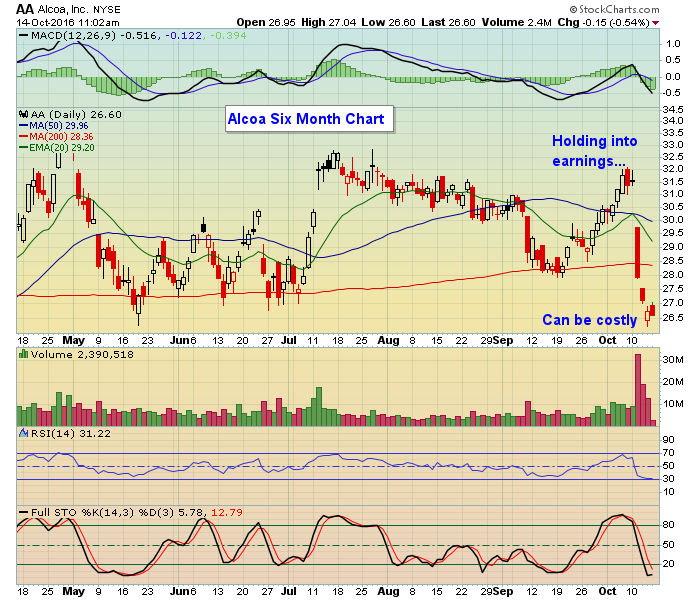
Holding Stocks into Earnings can be Costly

by John Hopkins,
President and Co-founder, EarningsBeats.com
We're now in the thick of Q3 earnings season when thousands of companies will report their numbers over the next several weeks. Earning season kicked off when Alcoa reported its numbers early last week and served as the poster child of why it's a crap shoot...
READ MORE
MEMBERS ONLY
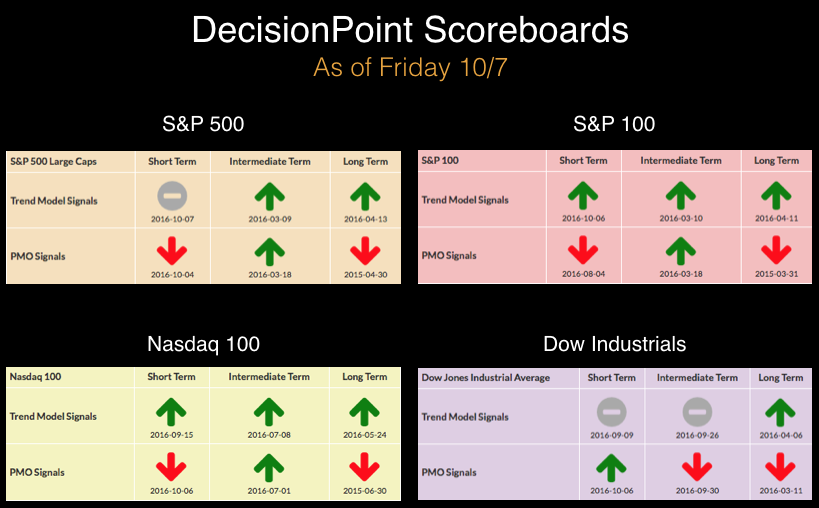
March Intermediate-Term BUY Signals Abort

by Erin Swenlin,
Vice President, DecisionPoint.com
The DecisionPoint Scoreboards had significant changes this week. Note the difference between last Friday's DP Scoreboard and today's. Scoreboards went from very bullish to very bearish in one week. The intermediate-term BUY signals that were replaced on the SPX and OEX had been in place since...
READ MORE
MEMBERS ONLY

EARLY STOCK BOUNCE FADES --BOND YIELD CONTINUES TO CLIMB -- SO DOES THE DOLLAR

by John Murphy,
Chief Technical Analyst, StockCharts.com
STOCK BOUNCE FADES AS YIELD CONTINUE TO RISE... A morning bounce in stocks faded by the end of the day. Chart 1 shows the S&P 500 ending the day at its low. That keeps stocks in a short-term downside correction and well below a falling 50-day average (blue...
READ MORE
MEMBERS ONLY

Charts I'm Stalking: Action Practice #4

by Gatis Roze,
Author, "Tensile Trading"
I’ve annotated the six charts I presented to you in my September 20, 2016 blog which was an exercise in Selling. If you missed that blog, I suggest you review the un-annotated charts first, and then mark them up yourself before you peek at my annotations. Here’s the...
READ MORE
MEMBERS ONLY
U.S. Stocks Hammer Out Support
by Tom Bowley,
Chief Market Strategist, EarningsBeats.com
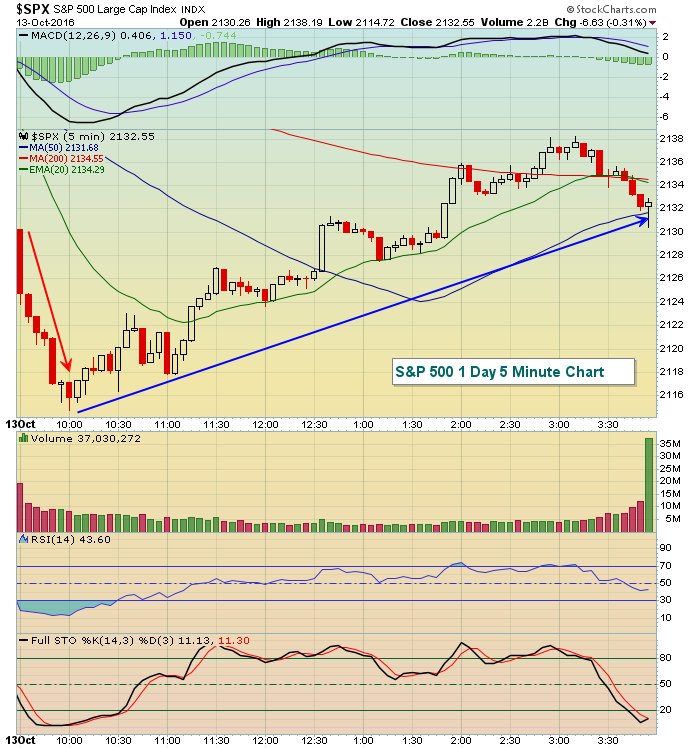
Market Recap for Thursday, October 13, 2016
It got a little scary during Thursday's morning session as key support was lost on an intraday basis. Fortunately for the bulls, it wasn't lost for very long as U.S. equities rallied and printed hammers across the board....
READ MORE
MEMBERS ONLY
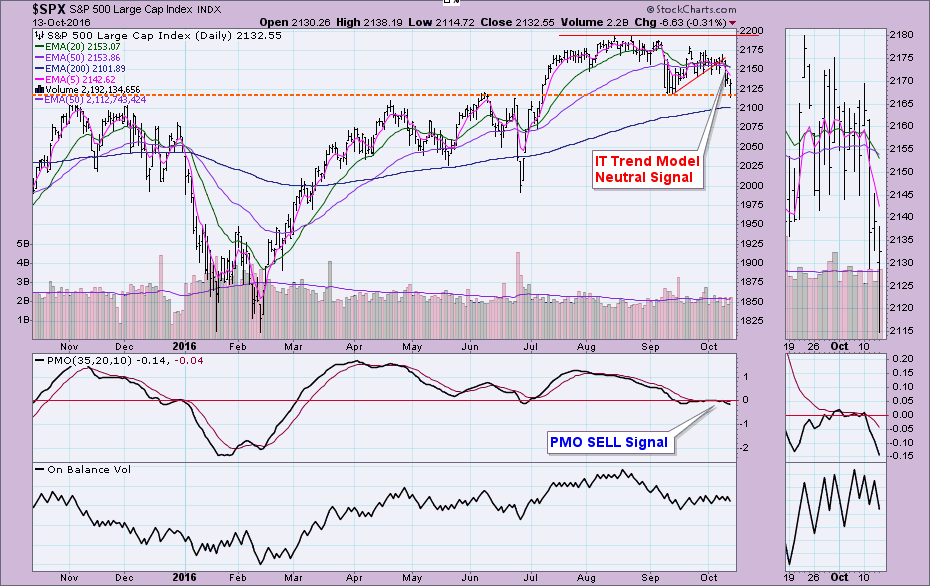
New Intermediate-Term Trend Model Neutral Signal Triggers on SPX
by Erin Swenlin,
Vice President, DecisionPoint.com
The DecisionPoint Scoreboards have been flipping out. Whipsaw has wreaked havoc on the Short-Term Trend Models (STTMs) and Price Momentum Oscillator (PMO). However, today's signal change is from the Intermediate-Term Trend Model (ITTM). Whipsaw isn't out of the question, but typically it doesn't happen...
READ MORE
MEMBERS ONLY

If The Market Gets Liftoff, Which Sectors Are Likely To Lead?

by Martin Pring,
President, Pring Research
* The long-term perspective
* Short-term indicators partially bullish
* Sectors offering positive relative action
The Long-term perspective
The US equity market has been moving sideways since July and has certainly worked off any short-term overbought condition. Some indicators are oversold, while others are still declining. During a bear market, these short-term indicators...
READ MORE
MEMBERS ONLY
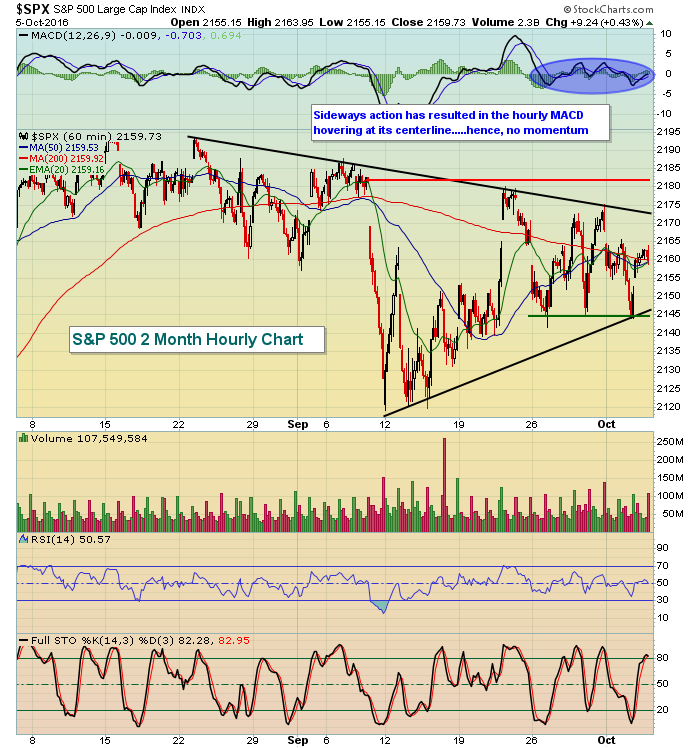
Here's How To Use The MACD For A Sell Signal
by Tom Bowley,
Chief Market Strategist, EarningsBeats.com
My favorite indicator, other than the combination of price and volume, is definitely the MACD. I've studied it for years and I use it as a very important momentum indicator in my trading strategy. It's mostly a lagging indicator as it uses prior closing prices to...
READ MORE
MEMBERS ONLY
Stocks Hold Steady Wednesday, HUGE Test Today
by Tom Bowley,
Chief Market Strategist, EarningsBeats.com
Market Recap for Wednesday, October 12, 2016
Considering the selling that began early Monday and continued all day Tuesday, Wednesday provided some relief to the bulls. The U.S. market did finish in bifurcated fashion with the Dow Jones and S&P 500 gaining fractionally while both the NASDAQ...
READ MORE
MEMBERS ONLY
Using Breadth For Trading Bias and Overbought/Oversold Setups - A Mean-Reversion System for SPY
by Arthur Hill,
Chief Technical Strategist, TrendInvestorPro.com
Using Breadth to Determine a Long-term Bias .... Short-term Breadth Indicators Become Oversold .... The 800-pound Gorilla in the Room .... Six of Nine Sectors Remain with Long-term Bullish Signals .... Revisiting the RSI Mean-Reversion System for SPY .... SPY Breaks Triangle Trend Line .... Further Study .... //// ....
Using Breadth to Determine a Long-term Bias
My long-term...
READ MORE
MEMBERS ONLY
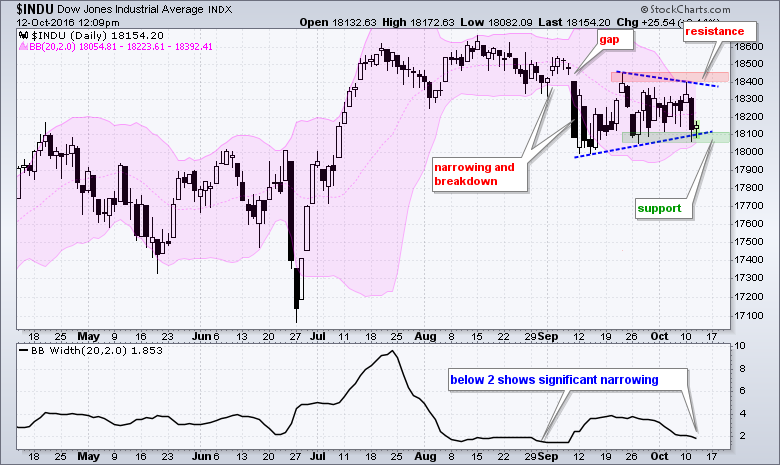
Bollinger Bands Narrow as Dow Gears Up for a Move
by Arthur Hill,
Chief Technical Strategist, TrendInvestorPro.com
The Dow Industrials remains locked in a trading range since the 11-Sept breakdown and chartists should watch this range for the next directional clue. The chart shows the Bollinger Bands in pink and the indicator window shows BandWidth. A move below 2 shows a significant narrowing of the bands and...
READ MORE
MEMBERS ONLY
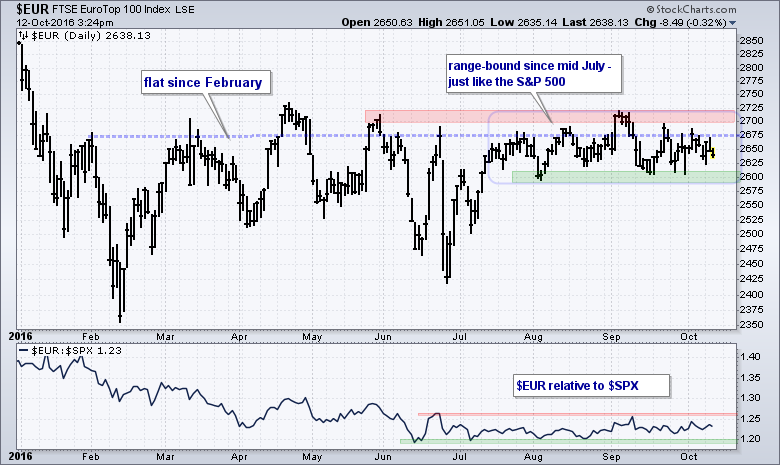
EuroTop 100 Index Remains Stuck as Peripheral Countries Weigh
by Arthur Hill,
Chief Technical Strategist, TrendInvestorPro.com
As with the S&P 500, the Eurotop 100 ($EUR) has gone nowhere since mid July and I am focused on the recent range for the first directional clues. Trading is quite choppy within the range and it remains anyone's guess what will happen within this range....
READ MORE
MEMBERS ONLY
Stocks Are Hammered Tuesday But Here's Why The Selling Is Not Likely To Last
by Tom Bowley,
Chief Market Strategist, EarningsBeats.com
Market Recap for Tuesday, October 11, 2016
There was a lot of carnage on Tuesday for sure. Every sector declined, led by a very weak healthcare sector (XLV, -2.51%). Biotechs ($DJUSBT) were primarily responsible for the sector's underperformance as this aggressive part of healthcare tumbled 3.27%...
READ MORE
MEMBERS ONLY
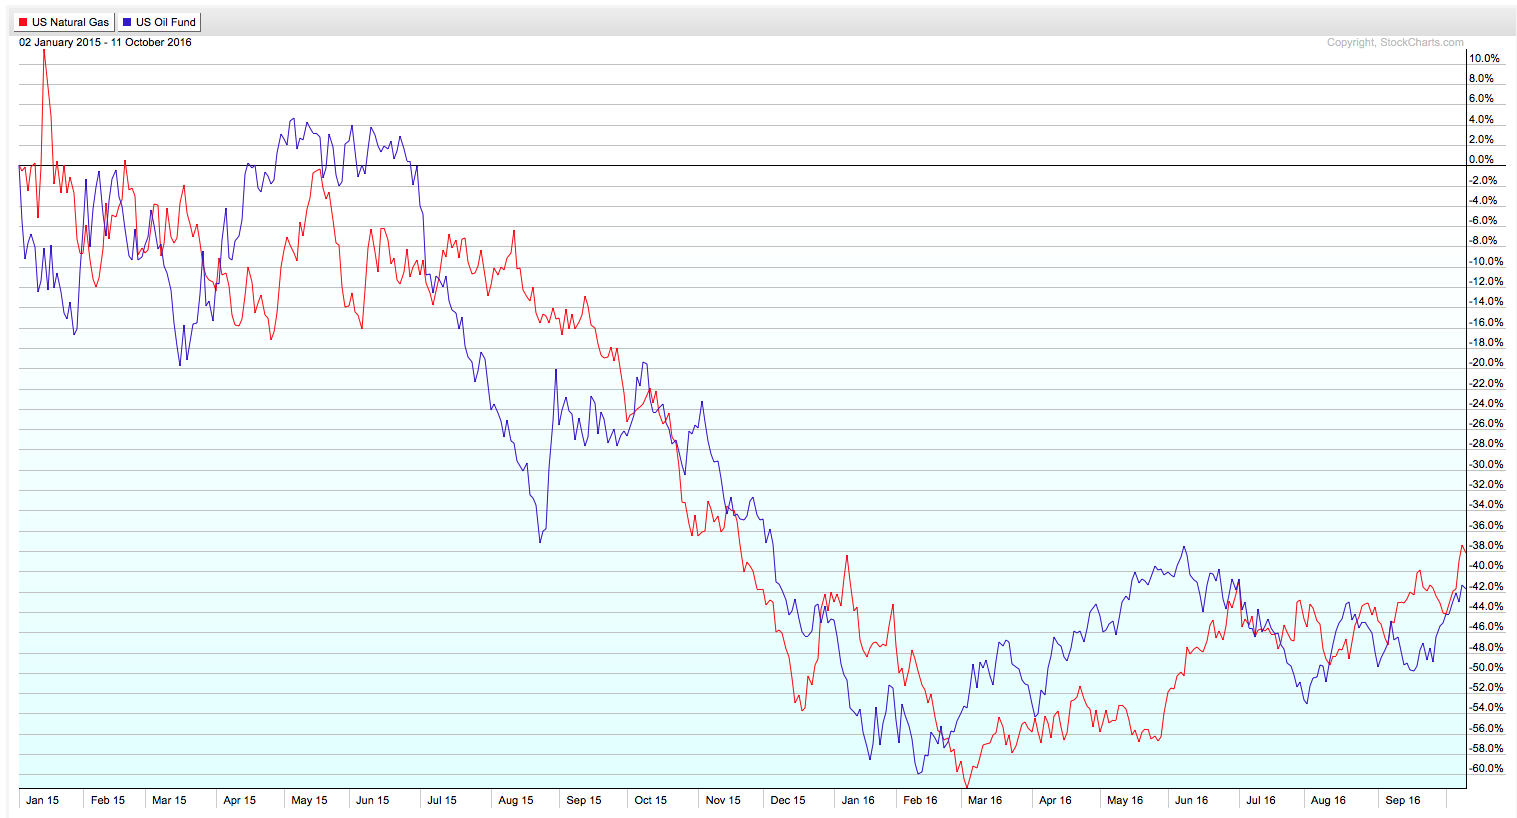
New Long-TermTrend Model BUY Signal for Natural Gas (UNG)
by Erin Swenlin,
Vice President, DecisionPoint.com
I recently received a request from a webinar viewer to make a comparison between Natural Gas (UNG) and US Oil Fund (USO). As I pulled up the daily chart for UNG, I noted a very important signal. The 50-EMA just crossed above the 200-EMA! This triggers a Long-Term Trend Model...
READ MORE
MEMBERS ONLY

TEN-YEAR TREASURY YIELD HITS FOUR-MONTH HIGH -- RISING TWO-YEAR YIELD SUGGESTS RATE HIKE THIS YEAR -- HIGHER RATES PUSH DOLLAR TO SEVEN-MONTH HIGH -- THE COMBINATION OF HIGHER RATES AND STRONGER DOLLAR ARE PUSHING GLOBAL STOCKS LOWER
by John Murphy,
Chief Technical Analyst, StockCharts.com
TEN-YEAR TREASURY YIELD CLEARS 200-DAY LINE... Bond yields around the world continue to climb, led by U.S. Treasuries. Chart 1 shows the 10-Year Treasury Yield ($TNX) climbing 4 basis points to 1.76% which is the highest level in four months. The TNX has also moved above its 200-day...
READ MORE
MEMBERS ONLY
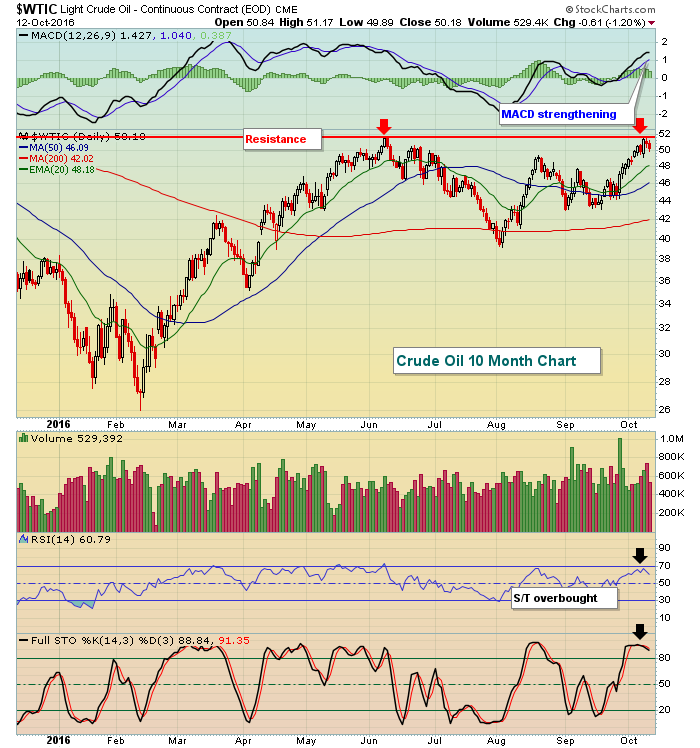
Crude Oil On Verge Of Major Breakout
by Tom Bowley,
Chief Market Strategist, EarningsBeats.com
Market Recap for Monday, October 10, 2016
Crude oil ($WTIC) rose more than 3% on Monday and energy (XLE, +1.57%) was easily the best performing sector as a result. Utilities (XLU, +0.83%) saw surprising strength as did REITs. The strength for the XLU and REITs, however, is not...
READ MORE
MEMBERS ONLY
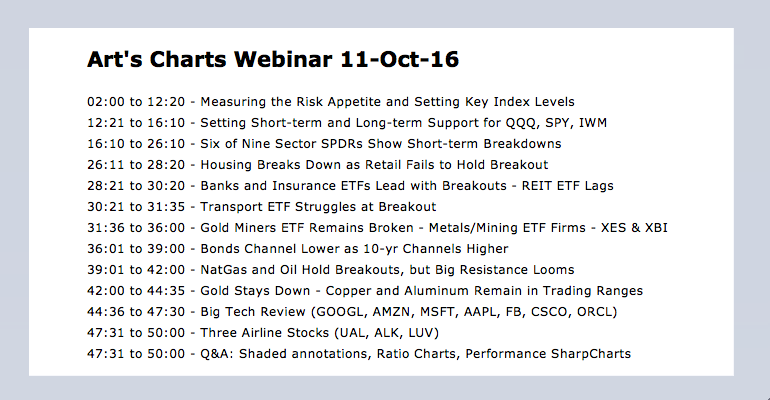
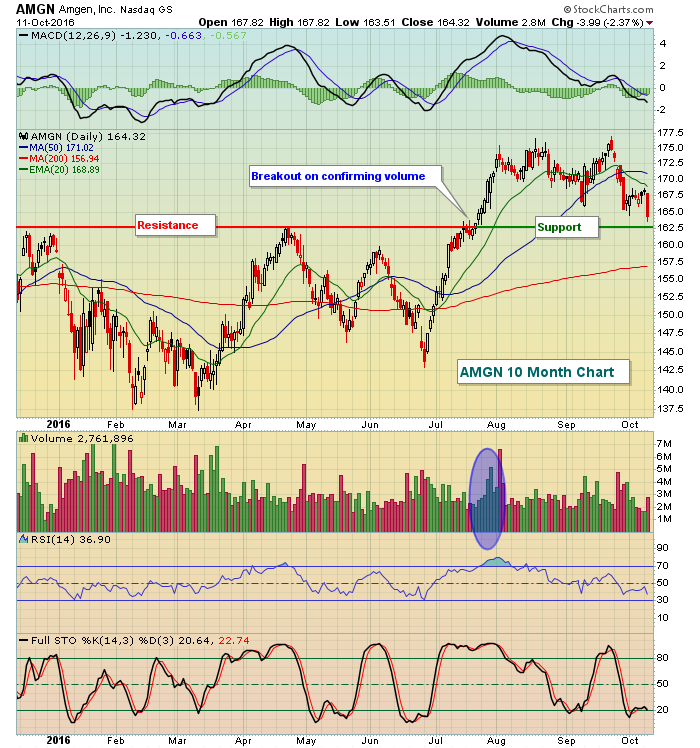
Is this Stall Bullish or Bearish? - Measuring the Risk Appetite - XLK, XLF and XLE Lead - XRT Attempts Breakout - Webinar Video
by Arthur Hill,
Chief Technical Strategist, TrendInvestorPro.com
Is Stalling Bullish or Bearish? .... Key Risk Indicators Remain Net Bullish .... Technology, Finance and Energy Lead .... Consumer Discretionary Groups Lag Long-term, But Lead Short-term .... Retail SPDR Attempts Breakout, But Housing Breaks Down .... //// ....
Is Stalling Bullish or Bearish?
Stocks started their stall in mid July and continued that stall into early...
READ MORE
MEMBERS ONLY

WTI CRUDE NEARS TEST OF NECKLINE -- BRENT TOUCHES ONE-YEAR HIGH -- ENERGY SPDR HITS NEW RECOVERY HIGH -- LED BY PIONEER NATURAL RESOURCES AND HALLIBURTON -- OIL SERVICES ETF ALSO NEARS NECKLINE -- LEADERS INCLUDE NABORS AND HELMERICH & PAYNE
by John Murphy,
Chief Technical Analyst, StockCharts.com
BRENT HITS ONE-YEAR HIGH -- WTIC IS CLOSE... The pledge of a joint Russian and Saudi agreement to limit oil output has pushed the commodity even higher, and has increased the odds of a major bottom being completed. Chart 1 shows the price of Light Crude Oil ($WTIC) gaining 3%...
READ MORE
MEMBERS ONLY
High Low Validation

by Greg Morris,
Veteran Technical Analyst, Investor, and Author
This is an attempt to help validate new high and new low data and, to be honest, is still a “work in progress.” If you consider the facts relating to new highs and new lows, you will see the necessity for this. A new high means that the closing price...
READ MORE
MEMBERS ONLY
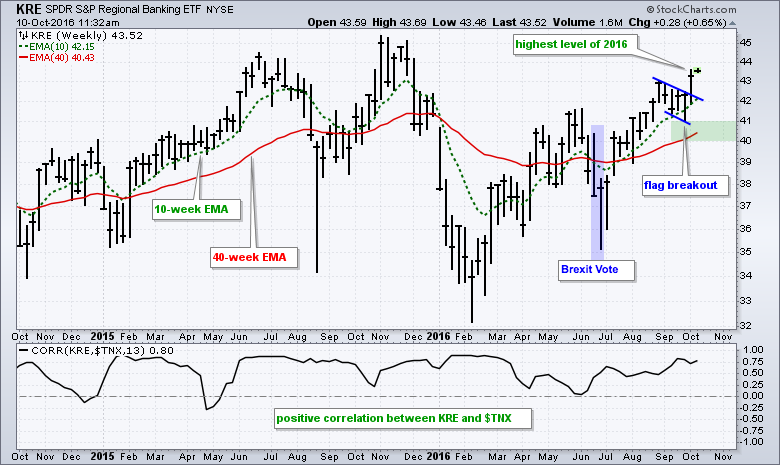
Rising Rates and Strong Seasonality are Part of a Bullish Recipe for Banks
by Arthur Hill,
Chief Technical Strategist, TrendInvestorPro.com
The rise in Treasury yields and bullish fourth quarter provide a strong tail-wind for banking stocks as we head into year-end. After experiencing a wicked whipsaw in June from the Brexit vote, the Regional Bank SPDR (KRE) surged in early July and resumed an uptrend that began with the February...
READ MORE
MEMBERS ONLY

Addressing RRG - Feedback and questions from ChartCon 2016

by Julius de Kempenaer,
Senior Technical Analyst, StockCharts.com
From a 100 degrees in beautiful Napa, via 70 degrees in Boston and New Hampshire, back to 50 and dropping in Amsterdam.
That pretty much sums up the excitement level that surrounds my ChartCon 2016 experience of last month!
Btw. In case you are wondering, the stop-over in Boston was...
READ MORE
MEMBERS ONLY
Crude Oil Prices Rise Slightly, Aiding U.S. Futures
by Tom Bowley,
Chief Market Strategist, EarningsBeats.com
Market Recap for Friday, October 7, 2016
It was another down day on Friday for Wall Street, but there were no technical breakdowns to suggest we'd see follow through this week. Instead, we saw the materials sector (XLB, -1.86%) endure a painful session after two decent days...
READ MORE
MEMBERS ONLY

British Pound Headed For Par, But Not Now
by Martin Pring,
President, Pring Research
* Long-term technicals for the pound
* Short-term technicals for the pound
* TIP of the day!
* The potential spoiler?
Long-term technicals for the pound
Chart 1 shows that the British Pound has completed a 30-year top. The price objective, calculated by taking the maximum depth of the formation and projecting it down...
READ MORE
MEMBERS ONLY
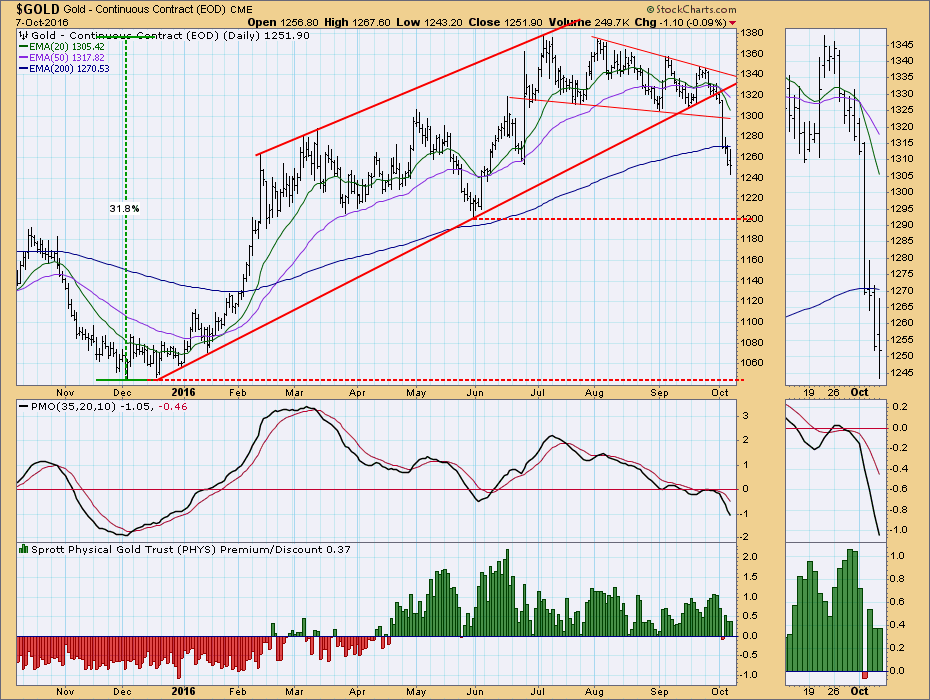
Downside Potential for Gold

by Carl Swenlin,
President and Founder, DecisionPoint.com
Gold had a bad week, decisively breaking down through a rising trend line drawn from the December low. Note that the PMO crossed down through its signal line (PMO SELL signal) a few days before the price break, and the 20EMA crossed down through the 50EMA (IT Trend Model NEUTRAL...
READ MORE
MEMBERS ONLY
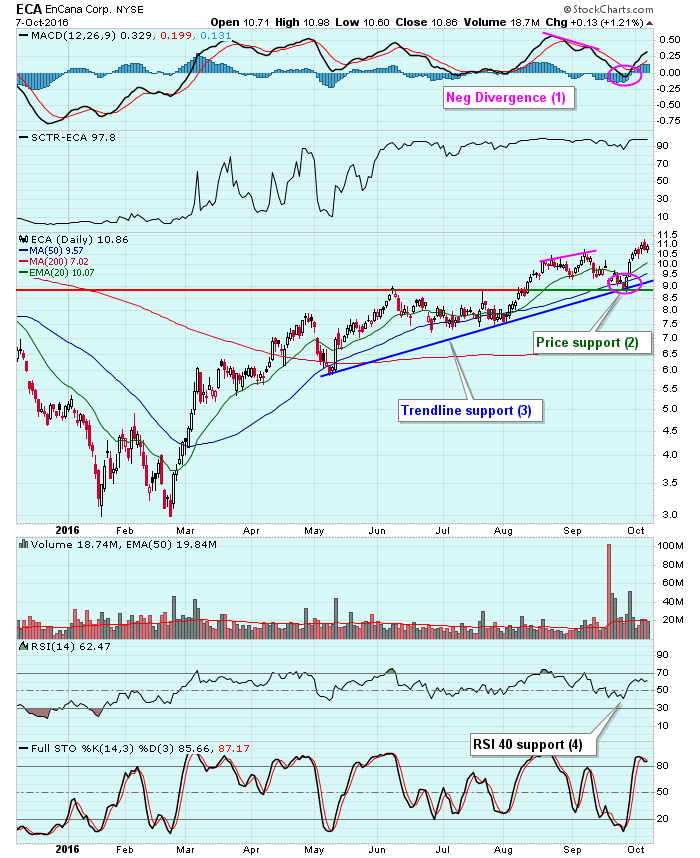
Lining Up Multiple Buy Signals To Minimize Risk
by Tom Bowley,
Chief Market Strategist, EarningsBeats.com
There is no such thing as a guarantee when it comes to stock trading. However, using technical analysis as a predictive tool to manage your risk is the key to success in my opinion. Let's take EnCana Corp (ECA) as an example. ECA lost more than 15% over...
READ MORE
MEMBERS ONLY
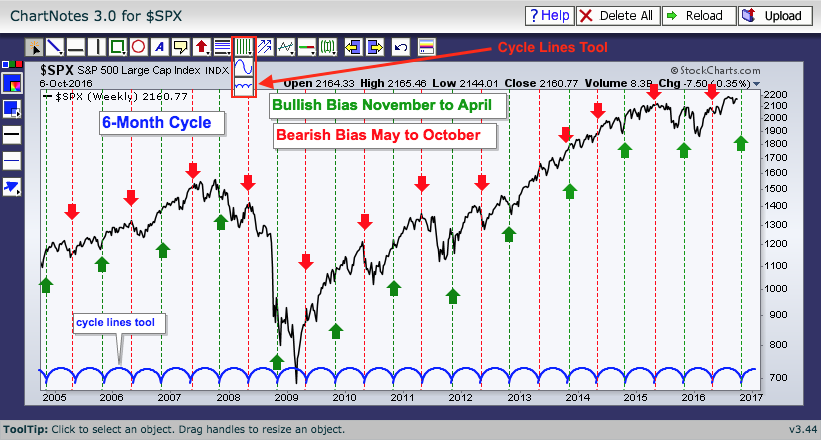
SystemTrader - Testing the Best Six Months Strategy - Tweaking and Adding MACD - Comparing to Market Timing - Historically Strong Q4 Arrives
by Arthur Hill,
Chief Technical Strategist, TrendInvestorPro.com
Introduction .... Background for the Best Six Month Strategy .... Seasonal Patterns Don't Always Work .... Testing the Classic Six-Month Cycle .... Tweaking the Cycle to Account for Seasonality .... Add Market Timing with weekly MACD .... SPY, MACD and Seasonality Now .... Tough to Beat EMA Crossover System .... Final Thoughts as Q4 Hits .... //// ....
Introduction...
READ MORE
MEMBERS ONLY

The Magic and Power of a "Four Leaf Clover" Investor
by Gatis Roze,
Author, "Tensile Trading"
In my commentary to the 1,400 investors participating in ChartCon 2016, I reinforced an essential investing insight that I had many years ago which has served me well for over two decades.
If I focused on the execution of my methodology instead of meditating on profits, the bottom line...
READ MORE
MEMBERS ONLY
Dollar's Two Month High Spells Trouble For Gold
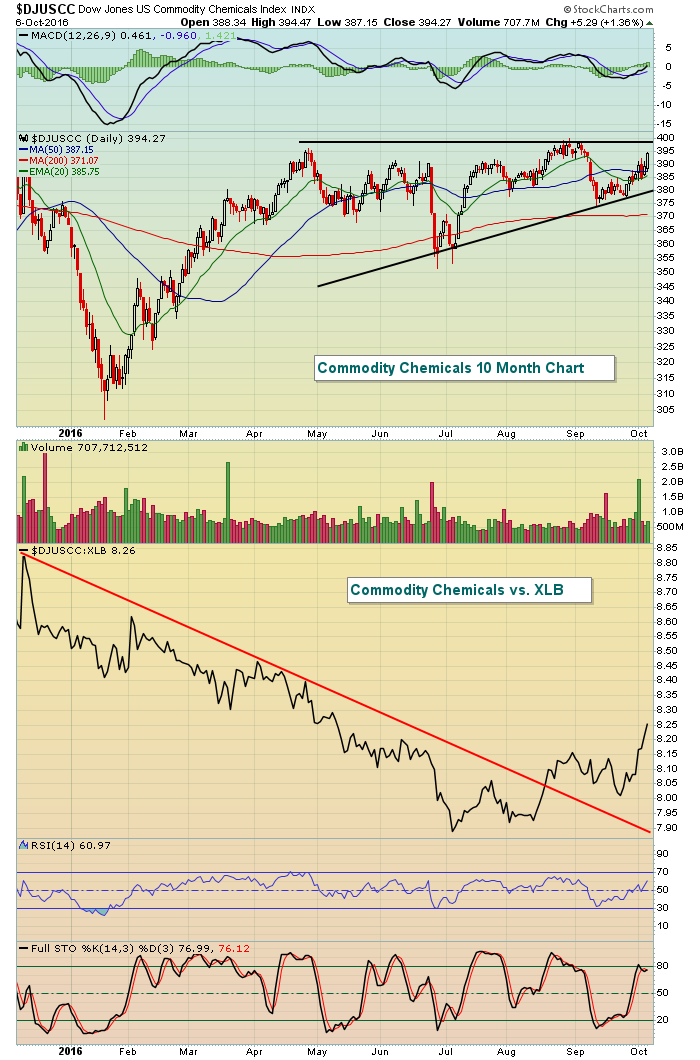
by Tom Bowley,
Chief Market Strategist, EarningsBeats.com
Market Recap for Thursday, October 7, 2016
It was mostly a flat day, although basic materials (XLB, +0.82%) managed to produce a stronger gain on a relative basis. Paper, aluminum and commodity chemicals were the three industry groups helping to lead the materials sector. While commodity chemicals ($DJUSCC) have...
READ MORE
MEMBERS ONLY

Wyckoff Bonding
by Bruce Fraser,
Industry-leading "Wyckoffian"
The US Treasury Bond market is largely dominated by the activities of the Federal Reserve Bank. For seven years the Fed has maintained a policy of zero to one quarter percent interest rates. In December 2015 the Fed raised the Fed Funds rate to a range of ¼% to ½%, and since...
READ MORE
MEMBERS ONLY

Technical Alerts Go Hand in Hand with DP Scoreboards
by Erin Swenlin,
Vice President, DecisionPoint.com
In Tuesday's blog, "YOU to Can Create DP Scoreboards - Visually Stunning", I explained to you how to find the signals on the charts to create your own DP Scoreboards like the ones located in the DP Chart Galleries. The questions that followed were how to...
READ MORE
MEMBERS ONLY

THE JAPANESE YEN MAY BE PEAKING -- THAT WOULD BE GOOD FOR JAPANESE STOCKS WHICH MAY BE BOTTOMING -- THE WISDOM TREE JAPAN HEDGED EQUITY ETF OFFERS A WAY TO BUY JAPANESE STOCKS WITHOUT CURRENCY RISK
by John Murphy,
Chief Technical Analyst, StockCharts.com
CURRENCY DIRECTION REALLY MATTERS IN JAPAN... My Tuesday message explained why foreign currency direction is important when investing in foreign stocks. That message showed why a falling British pound hurts American investors investing in U.K. stocks. Currency direction is also important when investing in Japanese stocks. Chart 1 is...
READ MORE
MEMBERS ONLY
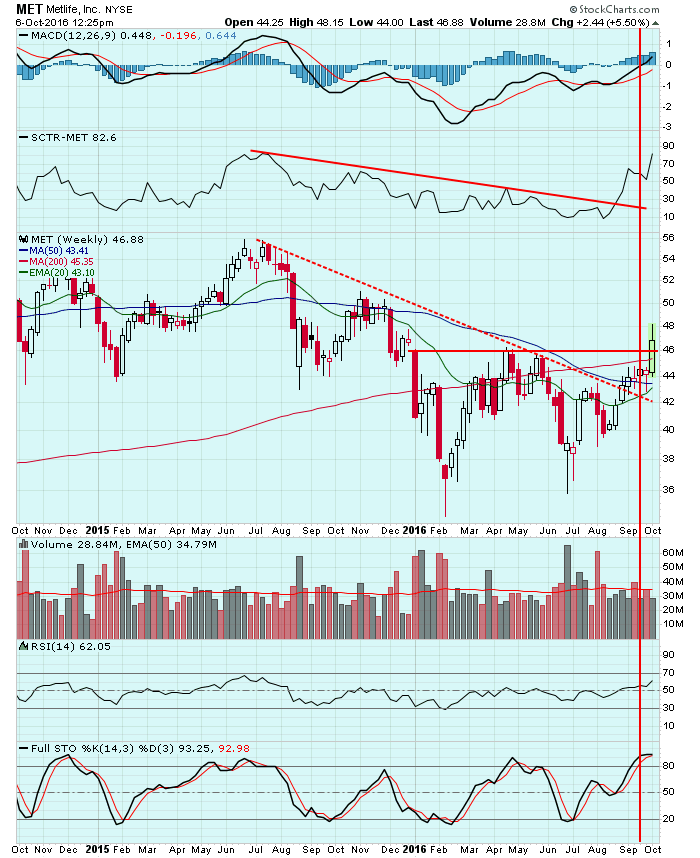
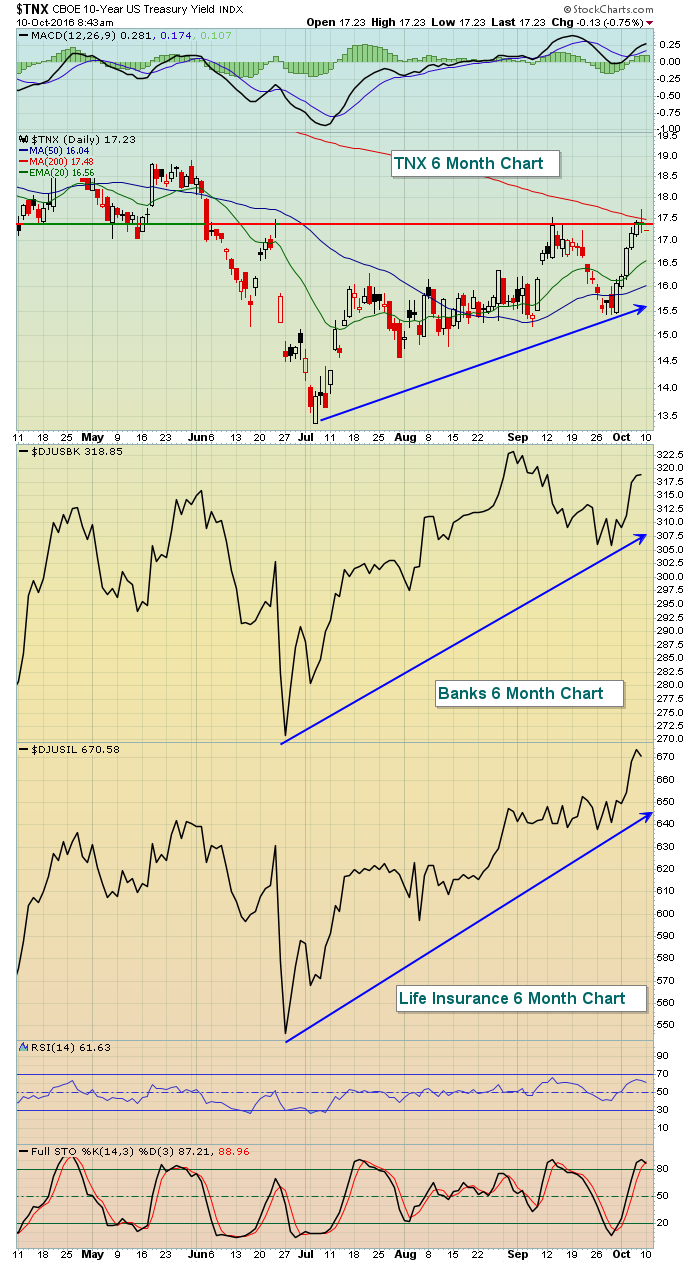
MetLife Leads Strong Life Insurance Group
by Tom Bowley,
Chief Market Strategist, EarningsBeats.com
The Dow Jones U.S. Life Insurance index ($DJUSIL) broke above 650 for the first time in 2016, buoyed by suddenly surging 10 year treasury yields ($TNX). Leading the charge in the group is MetLife (MET), which at today's high had gained 33% since its post-Brexit low near...
READ MORE
MEMBERS ONLY
Selling Of Treasuries Helping Banks, Life Insurers
by Tom Bowley,
Chief Market Strategist, EarningsBeats.com
Market Recap for Wednesday, October 5, 2016
Well, the market rotation continues unabated. It was bounce back day on Wednesday, although no key levels of price resistance were cleared. Volume did accelerate, however, as a shorter-term triangle unfolds on the S&P 500. You can check out the recent...
READ MORE
MEMBERS ONLY
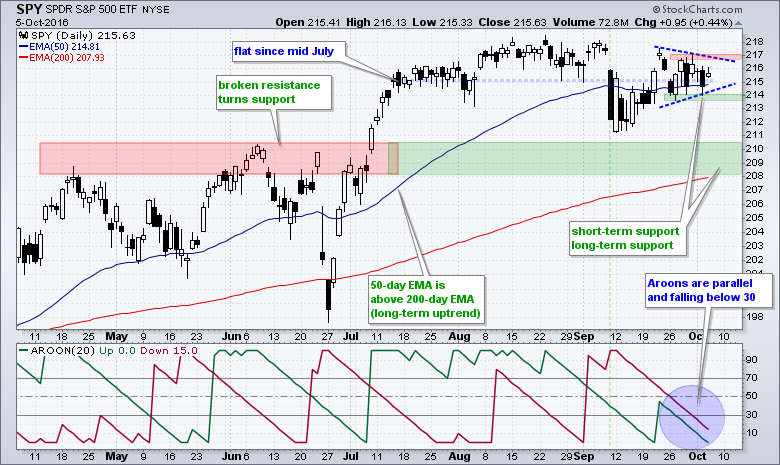
Aroons Crash on SPY Chart - Short-Term Yields Rising Faster - Charting and Scanning Bollinger Band Width - ChartList Update
by Arthur Hill,
Chief Technical Strategist, TrendInvestorPro.com
Aroon Indicators Crash on SPY Chart .... IWM and QQQ Continue to Outperform .... Financials, Utilities and the 10-yr Yield .... Short-term Yields Rising Faster than Long-term Yields .... Plotting, Analyzing and Scanning with Bollinger Bands .... ChartList Update .... //// ....
The S&P 500 SPDR (SPY) moved back above 215 on Wednesday, but remains range...
READ MORE
MEMBERS ONLY

Commodities: On Your Mark, Get Set, Go?
by Martin Pring,
President, Pring Research
* Long-term picture at a critical juncture point
* Global commodities poised for an upside breakout
* What about commodities against other assets?
* If commodities break out so will yields?
Long-term picture at a critical juncture point
Chart 1 shows the long-term technical position of the CRB Composite ($CRB), where you can see...
READ MORE
MEMBERS ONLY

FINANCIAL SPDR CLEARS 50-DAY AVERAGE -- S&P BANK SPDR HITS NEW 2016 HIGH -- BANK BREAKOUTS ARE ACHIEVED BY COMERICA, SUNTRUST BANKS, AND REGIONS FINANCIAL -- FINANCIALS/ UTILITIES RATIO SCORES BULLISH BREAKOUT
by John Murphy,
Chief Technical Analyst, StockCharts.com
FINANCIAL SPDR CLEARS 50-DAY AVERAGE... With bond yields on the rise, financial stocks are starting to show market leadership. Chart 1 shows the Financial Sector SPDR (XLF) rising above its 50-day average in today's trading. It's only the fourth sector SPDR to do that (after technology,...
READ MORE