MEMBERS ONLY

Two Indicators to Improve Your Edge

by Arthur Hill,
Chief Technical Strategist, TrendInvestorPro.com
KEY TAKEAWAYS
* Trend and momentum are proven concepts we can use to improve our edge.
* Longer timeframes are better for trend-momentum
* CandleGlance charts make it easy to rank and sort for momentum.
There are no magic bullets, but we can improve our trading edge by starting our selection process with...
READ MORE
MEMBERS ONLY

Week Ahead: NIFTY Violates Key Support Levels; Drags Resistance Lower

by Milan Vaishnav,
Founder and Technical Analyst, EquityResearch.asia and ChartWizard.ae
The over-deviated markets continued to extend their losses for the fourth week in a row. The Nifty remained largely under sustained selling pressure over the past five days, barring a few feeble attempts to stage a technical rebound. The markets extended their downsides while giving up key supports on the...
READ MORE
MEMBERS ONLY

The Future of Options Trading: Real-Time Technical & Options Ideas

by Tony Zhang,
Chief Strategist, OptionsPlay
In the fast-paced world of trading, success often hinges on screening for the best ideas in real-time to find trading opportunities. At OptionsPlay, we are committed to providing our users with the latest cutting-edge tools to automate the manual process of researching options trades. This is why we are thrilled...
READ MORE
MEMBERS ONLY
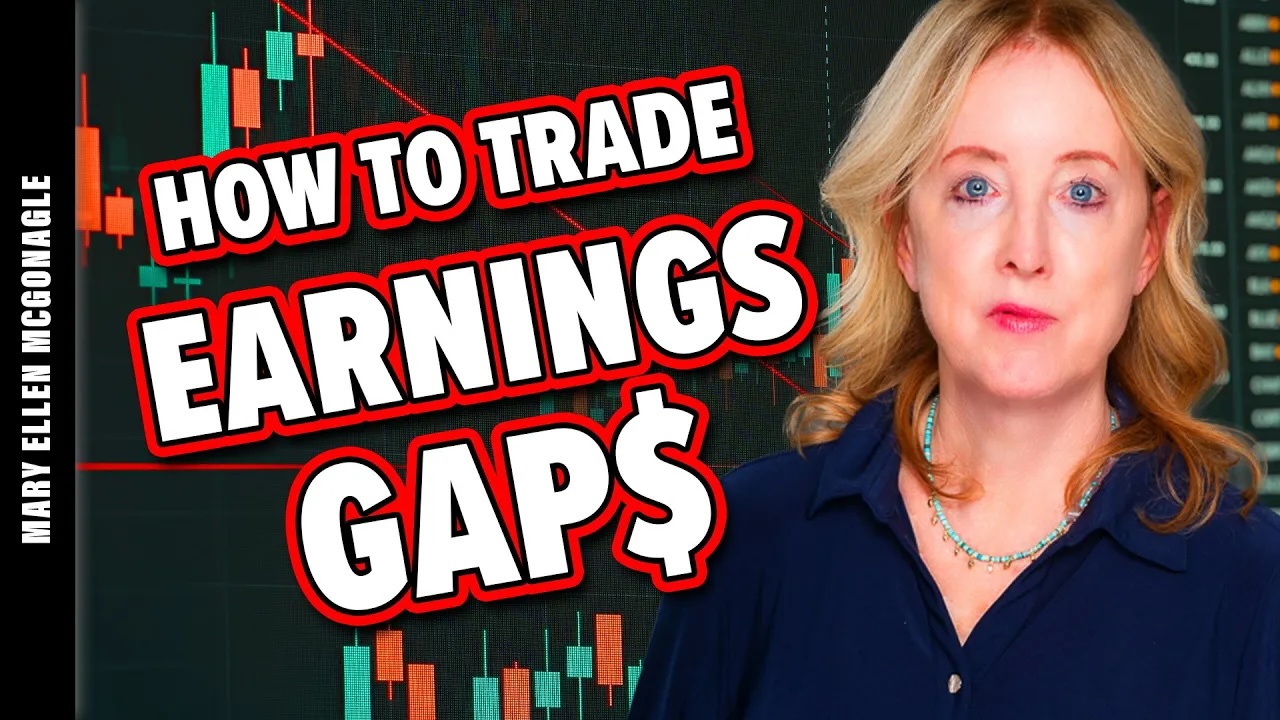
How to Trade Gaps Up (and Down) After Earnings

by Mary Ellen McGonagle,
President, MEM Investment Research
In this StockCharts TV video, Mary Ellen shares how the markets trade right before the elections, and also reviews the move in Tesla (TSLA) after reporting earnings. She shares examples of what to watch for if your stock is due to report earnings - and what to do if it...
READ MORE
MEMBERS ONLY
Election Season: Keep Calm and Optimize Your Portfolio

by Jayanthi Gopalakrishnan,
Director of Site Content, StockCharts.com
KEY TAKEAWAYS
* Tech stocks gained some ground this week after better-than-expected earnings from Tesla.
* US Treasury yields continue to rise.
* Bullish momentum keeps gold prices rising higher.
Although earnings season is in full swing, trading volume has been relatively light this week. Perhaps investors are waiting for the stock market...
READ MORE
MEMBERS ONLY
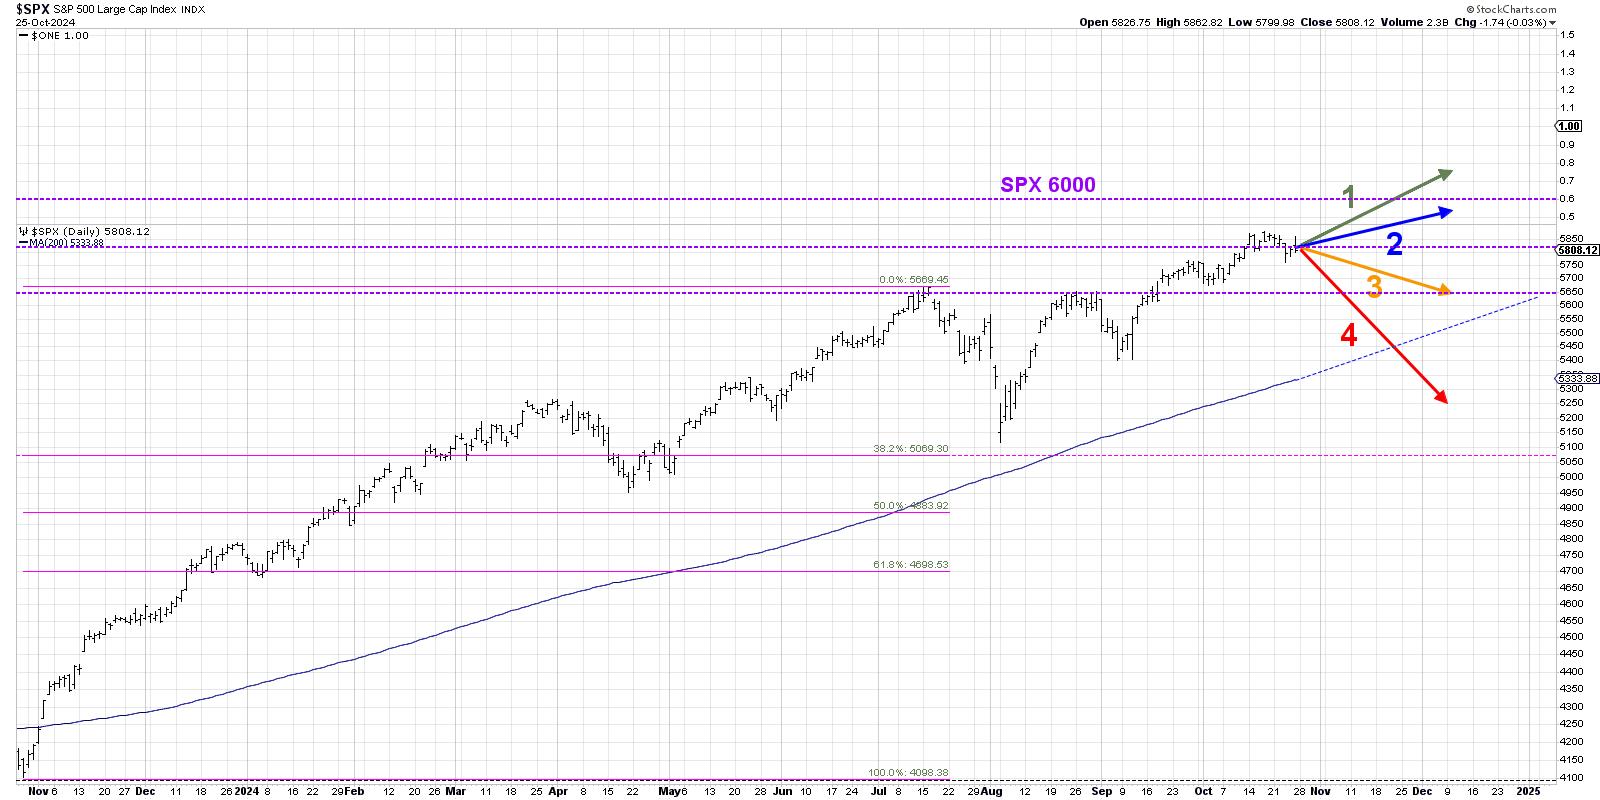
Why the S&P 500 Won't Break 6000 (Yet)

by David Keller,
President and Chief Strategist, Sierra Alpha Research
When I was growing up, I loved Choose Your Own Adventure books. I see the world in shades of gray instead of black-and-white, so I was immediately drawn to the seemingly endless scenarios that the main characters could experience as I made different choices for them.
As investors, we often...
READ MORE
MEMBERS ONLY
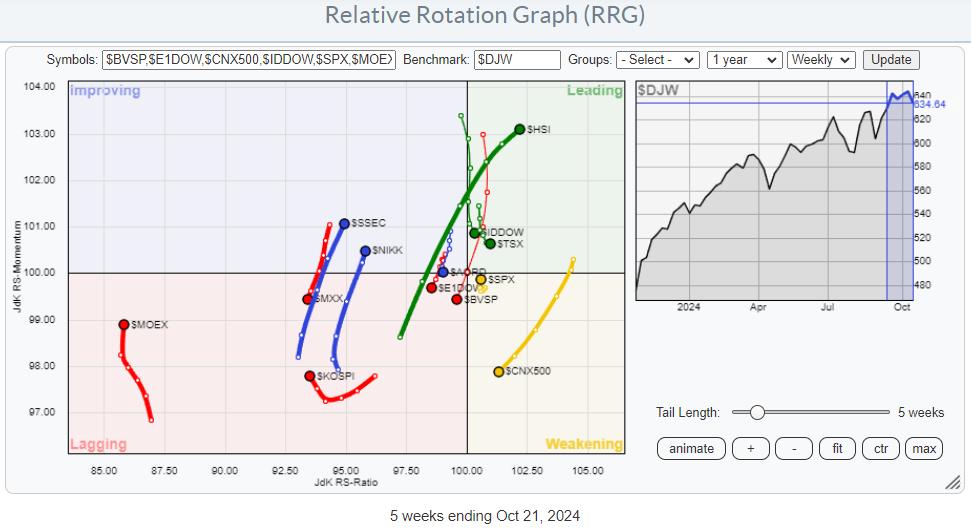
The US is Not the Only Stock Market in the World

by Julius de Kempenaer,
Senior Technical Analyst, StockCharts.com
KEY TAKEAWAYS
* Asian stock markets showing strong relative trends.
* Meanwhile, India, Mexico, and Brazil are nosediving.
* Overall, the US is stull beating Europe.
The global stock market is a big place, and it extends far beyond the borders of the United States. While the US market is undeniably the largest...
READ MORE
MEMBERS ONLY
PMO SELL Signals on All Indexes But One

by Erin Swenlin,
Vice President, DecisionPoint.com
In today's article and video, we'll discuss the weakness that pervades nearly all index charts.
Over the past few days, many of the indexes have lost their PMO BUY Signals. Nearly all have crossed beneath their signal lines, with the exception of the Nasdaq which is...
READ MORE
MEMBERS ONLY

SCTR Report: Unlocking TSLA's Potential—What Every Investor Needs to Know Now
by Jayanthi Gopalakrishnan,
Director of Site Content, StockCharts.com
KEY TAKEAWAYS
* TSLA stock soared on upbeat Q3 earnings report.
* TSLA's stock price has broken above the upper Keltner Channel, indicating strength and the early stages of an uptrend.
* Adding a momentum indicator like the StochRSI to Tesla's stock analysis can help make smart trading decisions....
READ MORE
MEMBERS ONLY

Forex Secrets: How to Profit When EUR/USD Goes Nowhere

by Karl Montevirgen,
The StockCharts Insider
KEY TAKEAWAYS
* The Euro has been trading sideways against the US dollar for the past two years.
* If you switch to a mean-reversion mindset, this may present quite a few attractive opportunities.
* You could trade ETFs such as FXE and UUP as an alternative to trading forex currency pairs.
For...
READ MORE
MEMBERS ONLY
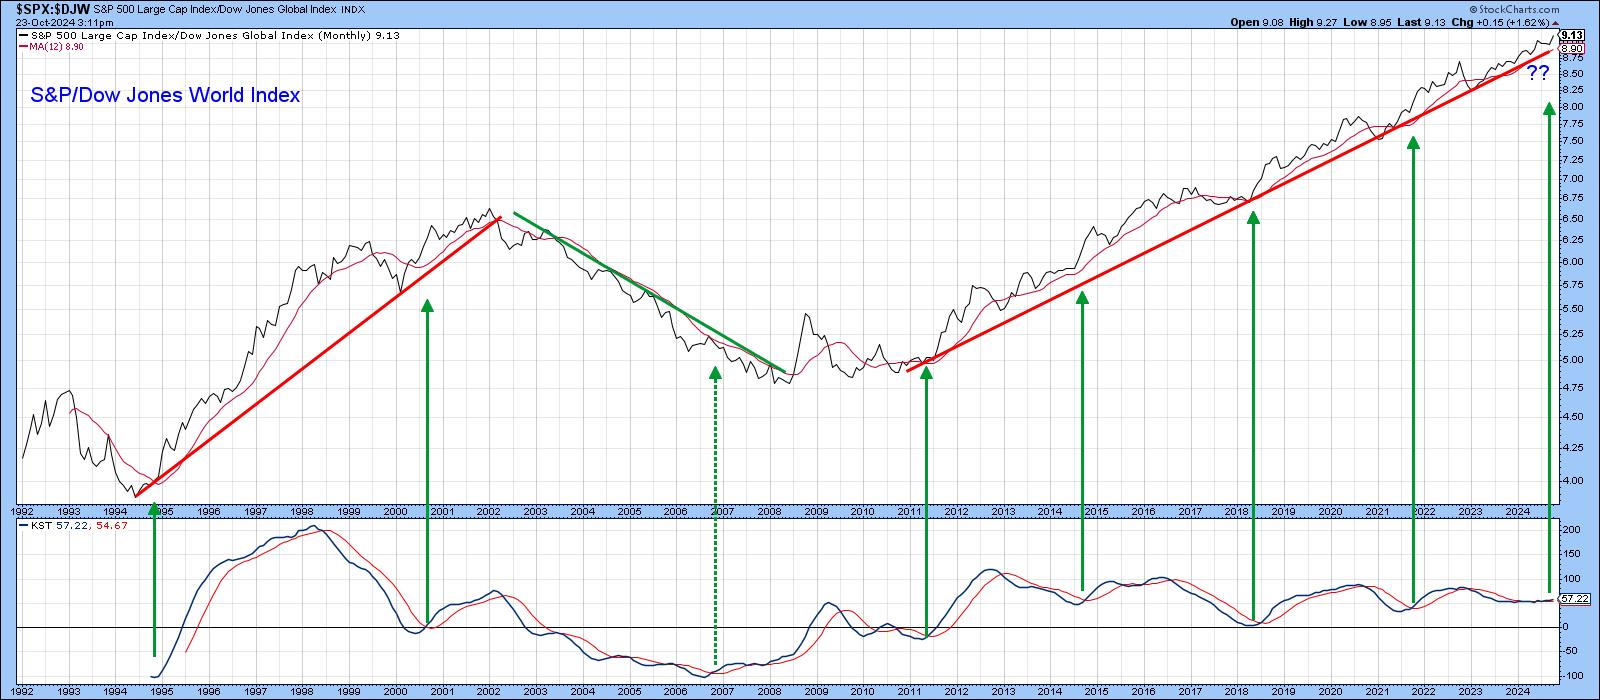
This Stock Market Will Likely Outperform the World Index, But Could Be Outshone by Something Completely Different

by Martin Pring,
President, Pring Research
Since 2011, the US stock market, represented by the S&P Composite, has outperformed the world. In the last couple of weeks or so, it has managed to break out from a trading range in its relationship with the rest of the world and looks headed even higher on...
READ MORE
MEMBERS ONLY

My Favorite RSI Signal

by Joe Rabil,
President, Rabil Stock Research
In this exclusive StockCharts video, Joe shows how he sets up the RSI 20 and 5 in ACP to save space and improve analysis. He explains how he uses RSI for both reading the trend and for fine-tuning entry in a strong trend. He gives examples using weekly, daily, and...
READ MORE
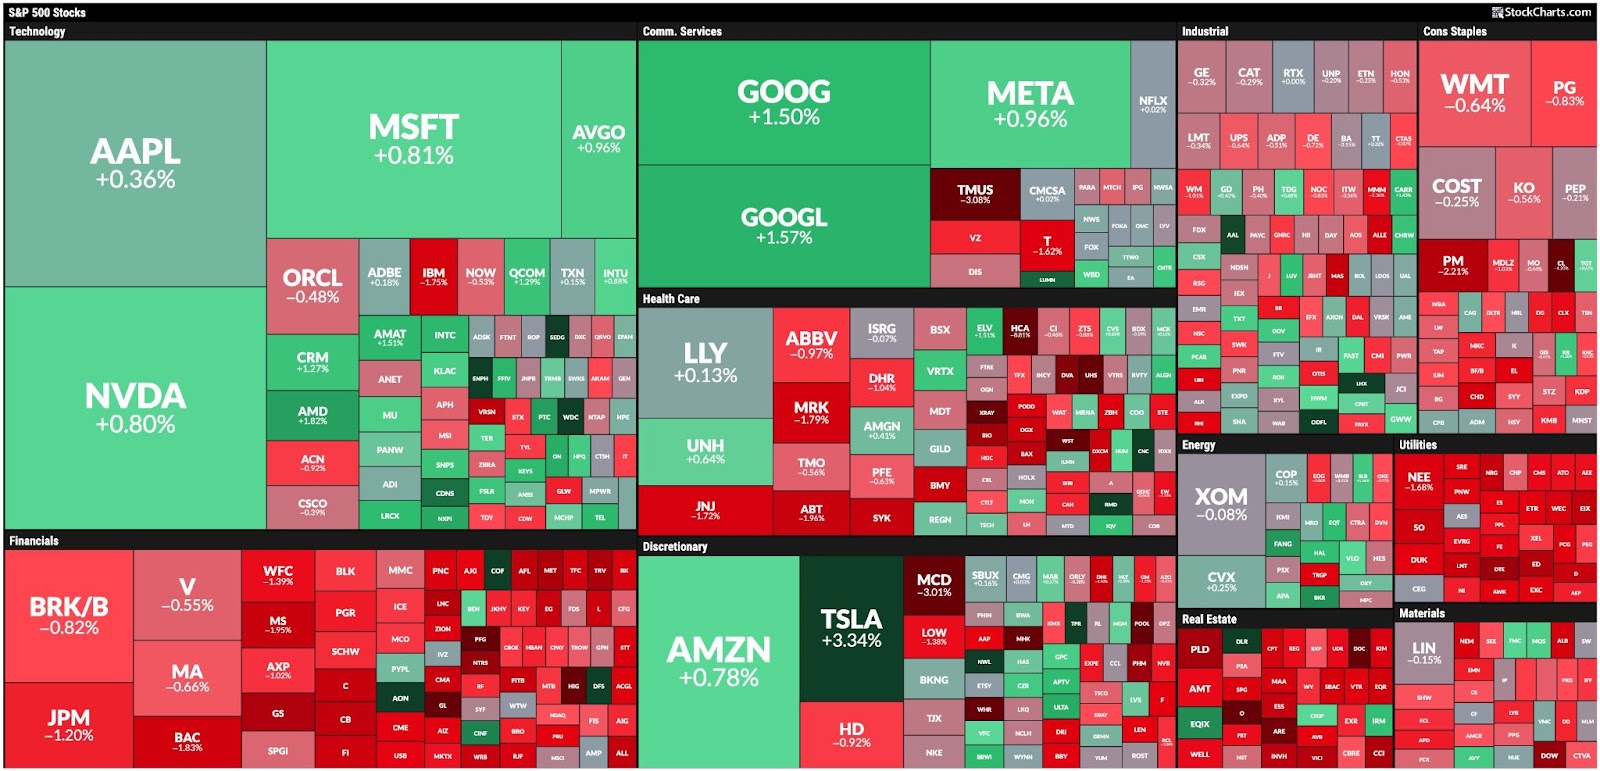
MEMBERS ONLY

Three Ways to Visualize the Start of a Potential Distribution Phase
by David Keller,
President and Chief Strategist, Sierra Alpha Research
KEY TAKEAWAYS
* The S&P 500 is nearing trendline support, which could provide a crucial signal of downside rotation.
* Market breadth indicators are beginning to diverge from the index, trending lower in the month of October.
* The MarketCarpet visualization shows a concerning drop in the mega-cap growth names which...
READ MORE
MEMBERS ONLY

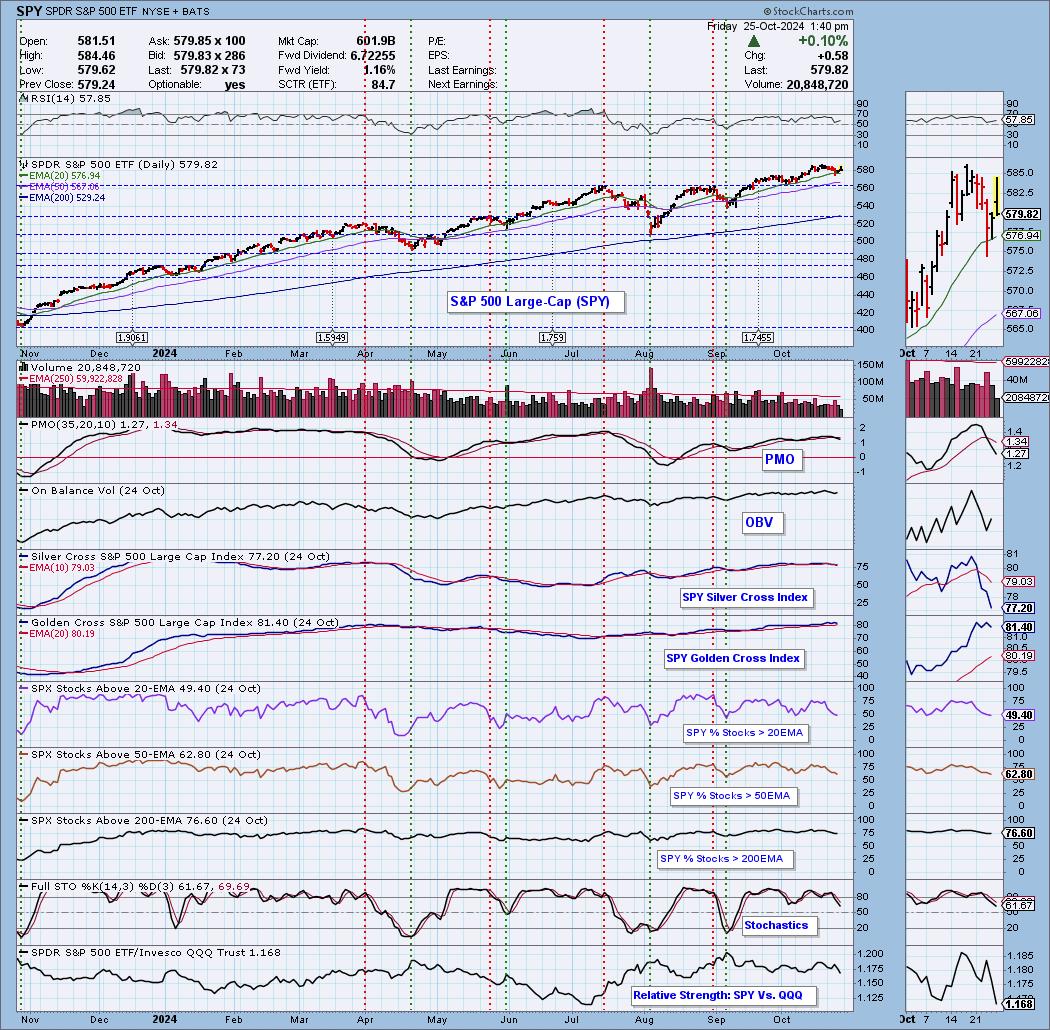
Stocks Regain Some Ground Amid Rising Yields, Gold Prices, US Dollar
by Jayanthi Gopalakrishnan,
Director of Site Content, StockCharts.com
KEY TAKEAWAYS
* Stock market is treading softly as uncertainties loom on the horizon.
* Consumer Staples is the best-performing sector.
* Nasdaq breaks out above a consolidation pattern ahead of Tech earnings.
The overall trend in the stock market's broader indexes remains bullish. While the indexes were trading lower on...
READ MORE
MEMBERS ONLY

DISCOVER the Top Consumer Discretionary Stocks
by Julius de Kempenaer,
Senior Technical Analyst, StockCharts.com
In this video from StockCharts TV,Julius begins by looking back at the completed monthly bars for October to assess the long term trends in the 11 S&P sectors. He follows that up with an updated view for SPY in coming weeks. After that, Julius looks forward using...
READ MORE
MEMBERS ONLY
Unlock the Secret To Finding Strong Stocks in Weak Markets
by Karl Montevirgen,
The StockCharts Insider
KEY TAKEAWAYS
* Predefined Scans is a tool you can use to find tradable opportunities in up and down markets.
* Coordinating your scans with the SCTR Report can increase your chances of finding strong stocks to trade.
* Applovin Corp has been on the radar for months, and its chart displays the...
READ MORE
MEMBERS ONLY
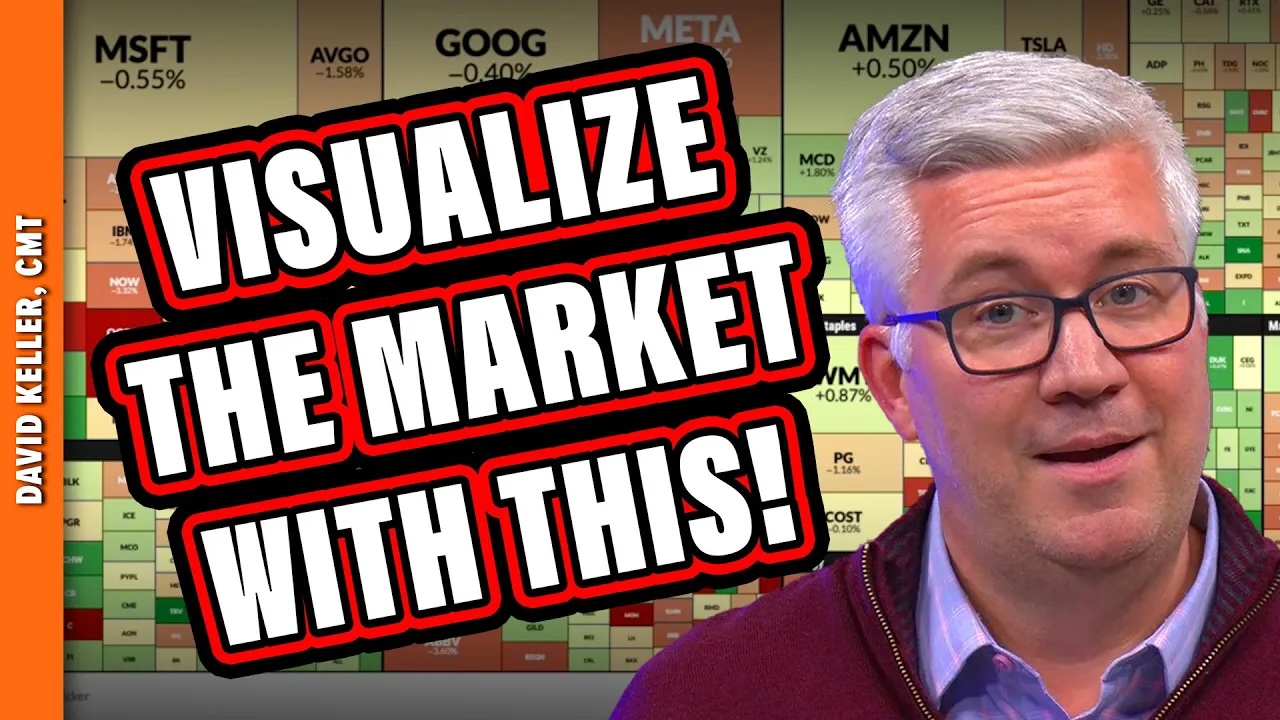
What's the BEST Market Visualization Tool?
by David Keller,
President and Chief Strategist, Sierra Alpha Research
How do you track movements of all the S&P 500 stocks on any given trading day? In this video, Dave will show you how he uses the StockCharts MarketCarpet to evaluate broad equity market conditions, assess the changes in the mega-cap stocks which dominate the benchmarks, and identify...
READ MORE
MEMBERS ONLY
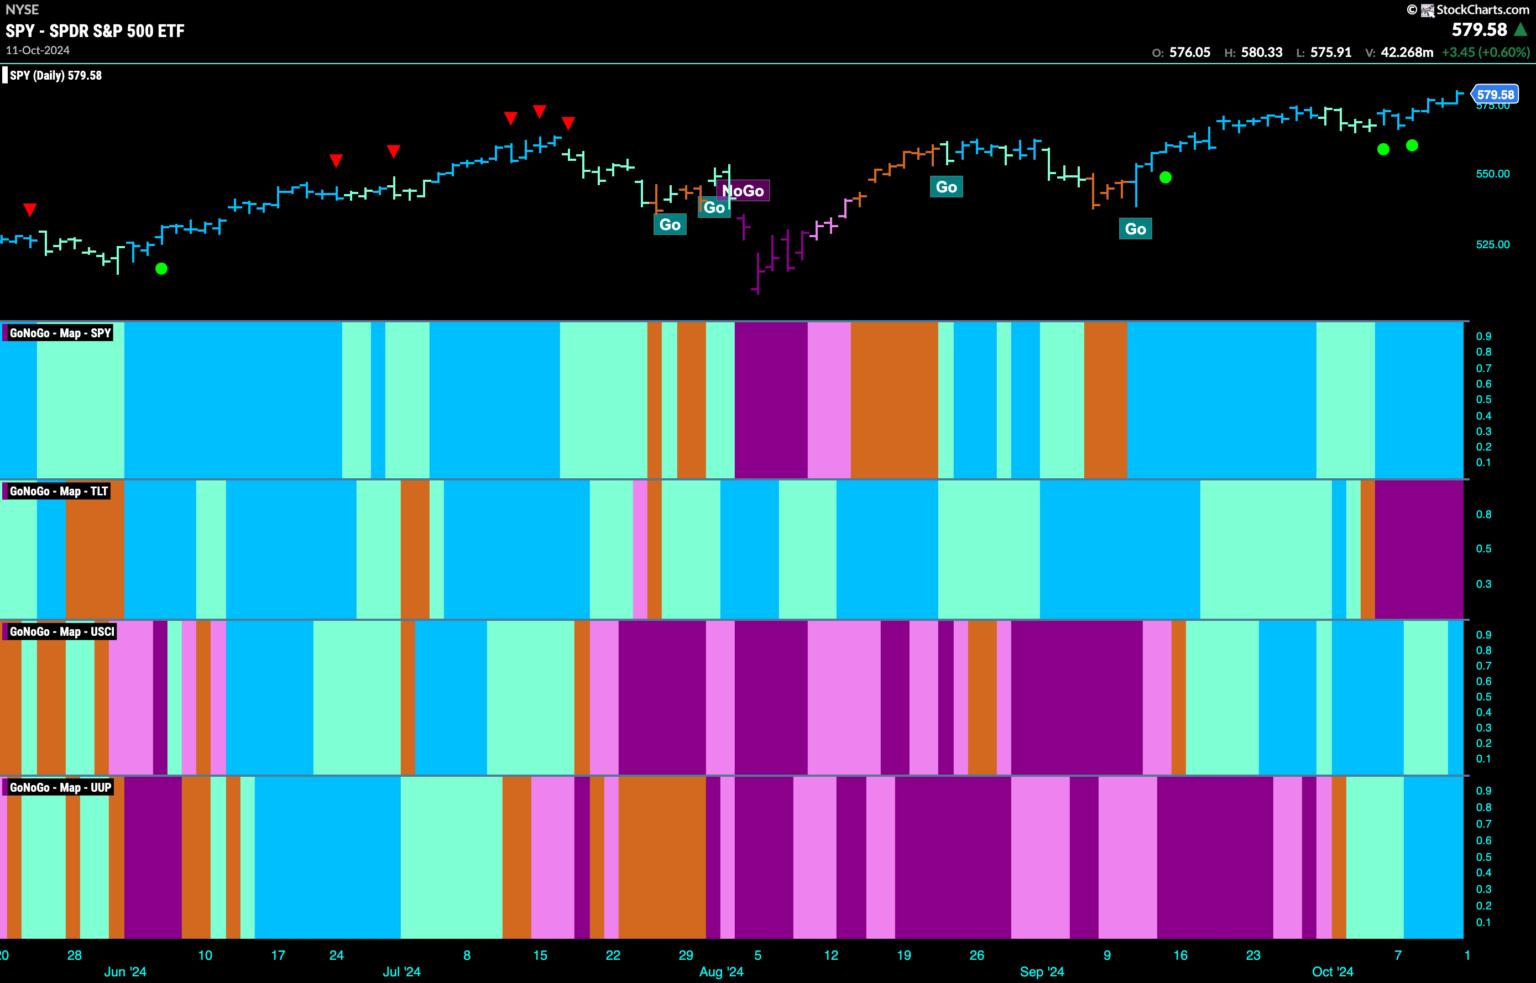
Equities Remain in "Go" Trend as We See Rotation into Utilities

by Alex Cole,
Co-founder, GoNoGo Charts®

by Tyler Wood,
Co-founder, GoNoGo Charts®
Good morning and welcome to this week's Flight Path. Equities saw the "Go" trend continue this week as the indicator painted strong blue bars the entire week. Treasury bond prices saw the "NoGo" trend continue with a week of strong purple bars. U.S....
READ MORE
MEMBERS ONLY

DP Trading Room: Which is Better? SP600 (IJR) or Russell 2000 (IWM)
by Erin Swenlin,
Vice President, DecisionPoint.com
Carl explores which index is best...the SP600 (IJR) or Russell 2000 (IWM). He makes a comparison over time and reveals which tends to be the better performer. Which one should you use to analyze what is happening in small-caps?
Carl gives us his market outlook as prices pullback today....
READ MORE
MEMBERS ONLY
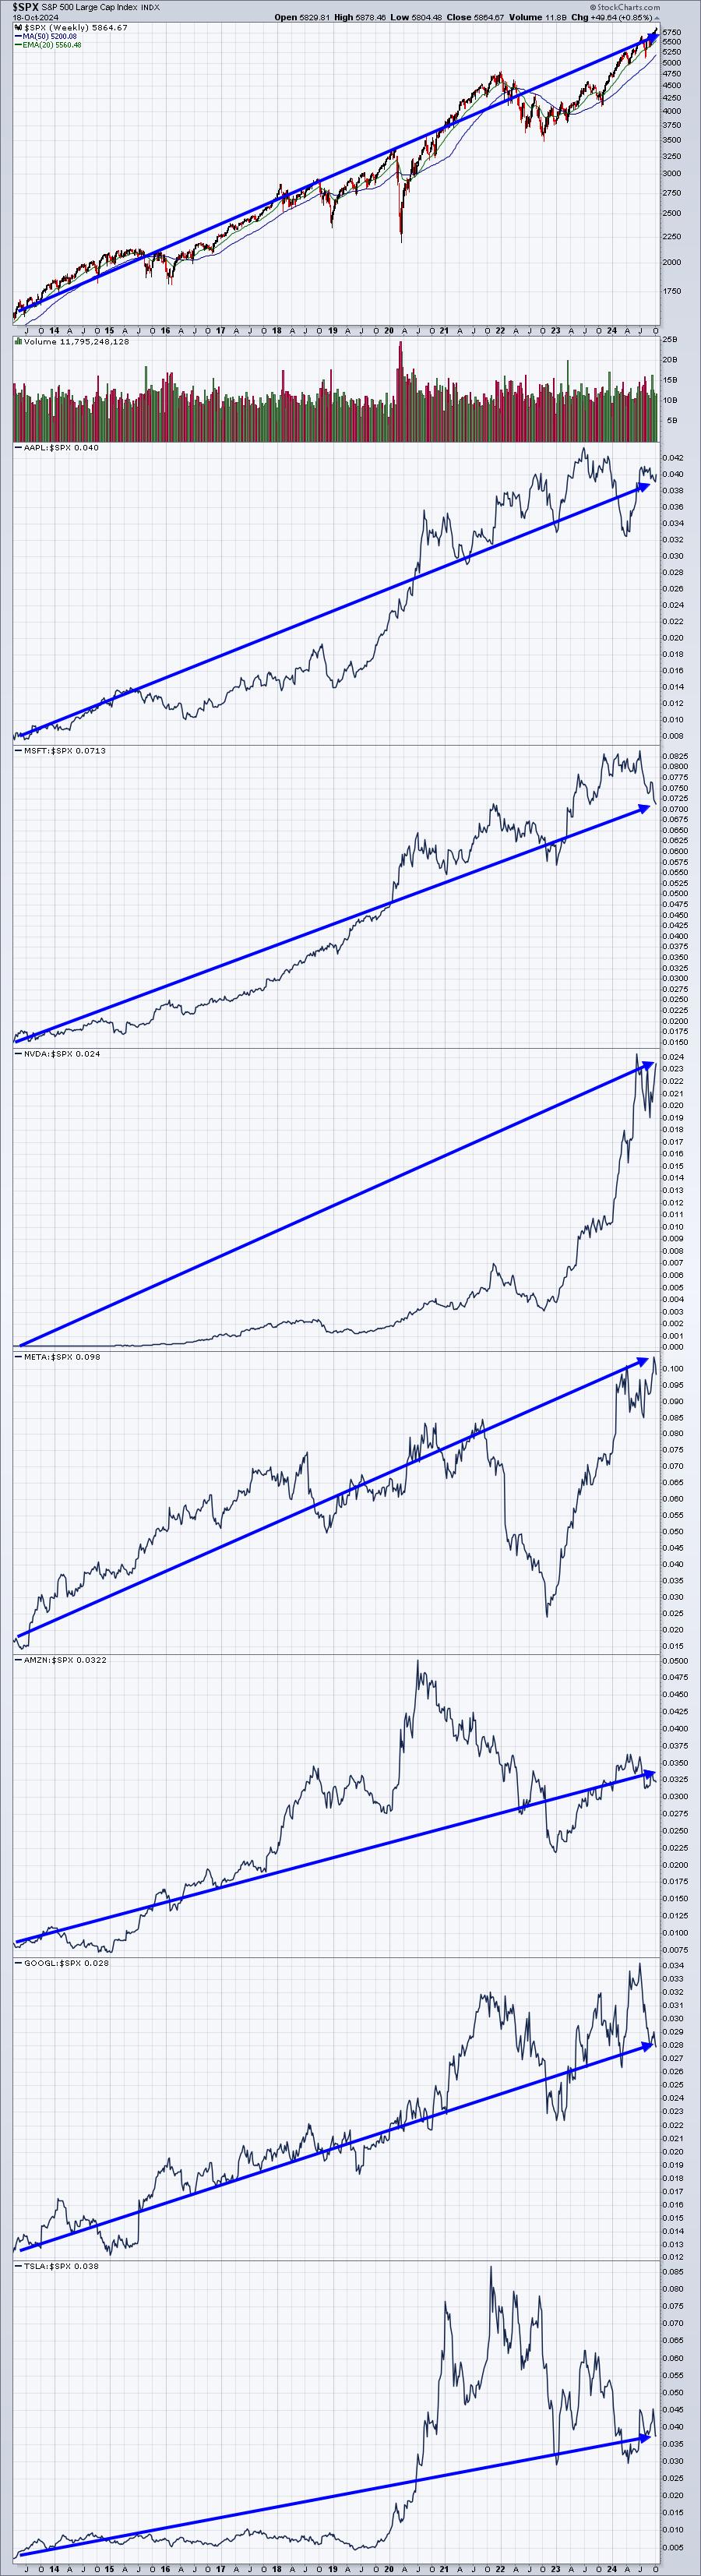
Only 3 Of The 7 Mag Stocks Are Worth Owning Right Now

by Tom Bowley,
Chief Market Strategist, EarningsBeats.com
The "Magnificent 7", comprised of Apple (AAPL), Microsoft (MSFT), NVIDIA (NVDA), Meta Platforms (META), Amazon.com (AMZN), Alphabet (GOOGL), and Tesla (TSLA) have carried the S&P 500 during this secular bull market - since its breakout in April 2013 above its 2000 and 2007 highs. Here&...
READ MORE
MEMBERS ONLY

Week Ahead: NIFTY May Stay Ranged; Trending Moves to Occur Only If These Edges are Breached
by Milan Vaishnav,
Founder and Technical Analyst, EquityResearch.asia and ChartWizard.ae
The markets closed on a negative note for the third week in a row; over the past five sessions, the Nifty remained largely on a declining trajectory, except for the last trading day where it saw some relief rally from the lower levels. Following a strong weekly decline of 1167...
READ MORE
MEMBERS ONLY

Be On the Lookout for THIS During Earnings Season!
by Mary Ellen McGonagle,
President, MEM Investment Research
In this StockCharts TV video, Mary Ellen reviews what's driving the markets higher and how you can capitalize. Moves in TSLA, NVDA, and NFLX are highlighted. She also reviews price action greatly impacted by earnings, many driven by analyst upgrades and downgrades.
This video originally premiered October 18,...
READ MORE
MEMBERS ONLY
Does the MACD Histogram Hold the Secret to Anticipating Trend Changes?
by David Keller,
President and Chief Strategist, Sierra Alpha Research
KEY TAKEAWAYS
* The MACD and PPO indicators are trend-following devices designed to confirm a trend reversal has occurred.
* The histogram shows when the MACD indicator is showing signs of a potential reversal, providing more of a leading indicator.
* Investors can use other indicators, such as the Chandelier Exit system, on...
READ MORE
MEMBERS ONLY

A Strong Week: Stocks, Gold, and Crypto's Robust Performance
by Jayanthi Gopalakrishnan,
Director of Site Content, StockCharts.com
KEY TAKEAWAYS
* The S&P 500 and Dow Jones Industrial Average closed at record highs.
* Gold prices are on fire, closing at a record high.
* Bitcoin breaks out of a consolidation pattern.
Despite a light economic data week, the stock market continued its rally, with the S&P...
READ MORE
MEMBERS ONLY

Is This Still a Bull Market? | Larry's "Family Gathering" October 18, 2024 Recording

by Larry Williams,
Veteran Investor and Author
Are we still in a bull market? That's a key question Larry considers in his final "Family Gathering" video, examining all the information available and what kind of conclusions about the state of the market we can draw from it.
Larry begins with a careful market...
READ MORE
MEMBERS ONLY
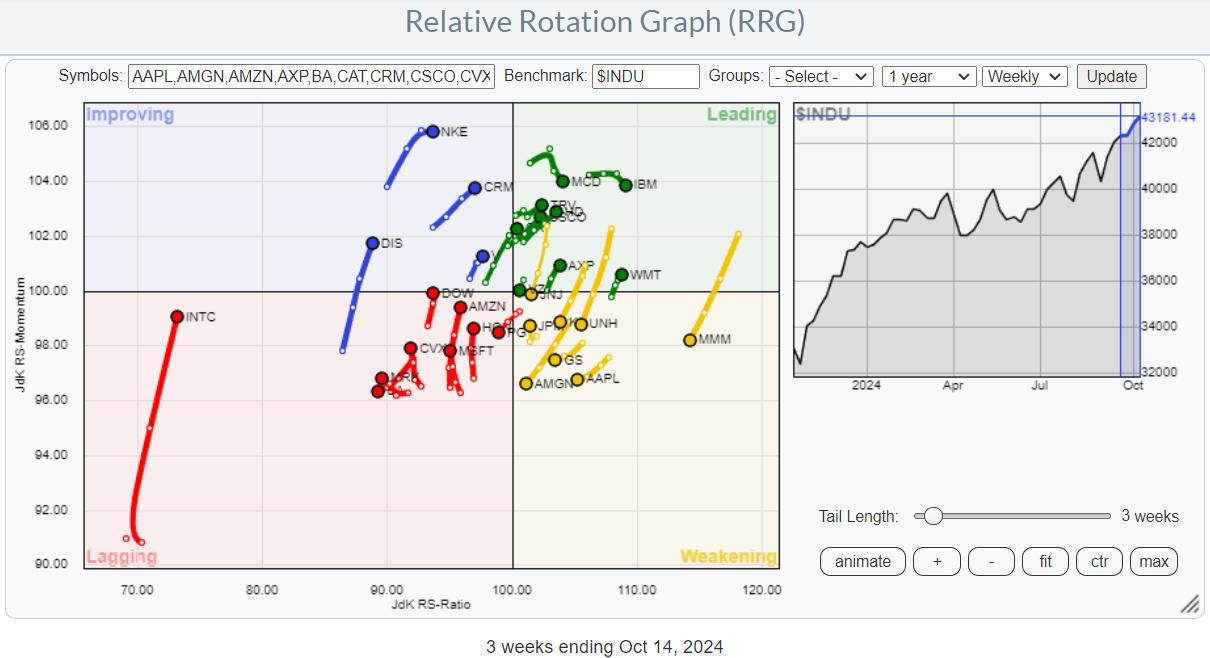
Using RRG To Find Best Three Stocks inside the DJ Industrials Index
by Julius de Kempenaer,
Senior Technical Analyst, StockCharts.com
KEY TAKEAWAYS
* Sector Rotation Model and current sector rotation are not supporting broad market strength.
* Plotting the members of $INDU on a Relative Rotation Graph helps find the best names in that universe.
* TRV, WMT, and AXP are still strong, but now have too much risk for new positions.
* CAT,...
READ MORE
MEMBERS ONLY

Disney Stock Options Strategy: A Detailed Guide to Boost Your Earnings
by Tony Zhang,
Chief Strategist, OptionsPlay
KEY TAKEAWAYS
* Disney's stock price has the potential to rise higher.
* A call vertical spread could be a viable strategy to trade Disney stock as a less expensive alternative to trading a long call.
* The long call vertical for DIS can also offset some of your risks.
Walt...
READ MORE
MEMBERS ONLY
Final "Family Gathering" Meeting Today at 2 PM Eastern
Today, Larry Williams will be hosting his final "Family Gathering" meeting at 2pm Eastern Daylight Time (11am Pacific). Sign-in in begins 5 minutes prior. The show, which will include both a presentation from Larry and a viewer Q&A session, will be recorded and posted online for...
READ MORE
MEMBERS ONLY

Dell's Bullish Climb: Should You Get In Now?
by Karl Montevirgen,
The StockCharts Insider
KEY TAKEAWAYS
* Dell's stock price continues its near-term uptrend after bottoming in August.
* A cross above 70 in the SCTR line will signal increasing technical strength for Dell stock.
* Set price alerts for Dell stock so you're notified when the stock price hits a specific threshold....
READ MORE
MEMBERS ONLY
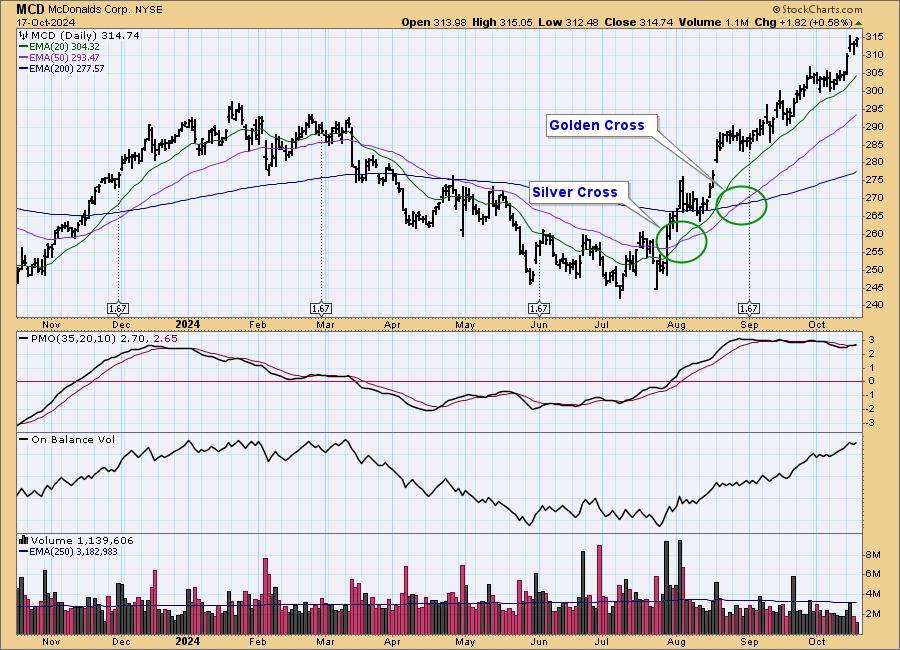
Signal Scoreboard As Good As It Gets

by Carl Swenlin,
President and Founder, DecisionPoint.com
At DecisionPoint, we track intermediate-term and long-term BUY/SELL signals on twenty-six market, sector, and industry group indexes. The long-term BUY signals are based upon the famous Golden Cross, which is when the 50-day moving average crosses up through the 200-day moving average. (We use exponential moving averages -- EMAs....
READ MORE
MEMBERS ONLY

United Airlines Stock Soars: Watch For a Promising Buying Opportunity
by Jayanthi Gopalakrishnan,
Director of Site Content, StockCharts.com
KEY TAKEAWAYS
* United Airlines stock took off on solid earnings.
* UAL has broken above a consolidation pattern and is ascending to a higher altitude.
* Look for a pullback before entering a long position in UAL.
Airline stocks had a strong day, with United Airlines (UAL), American Airlines (AAL), and Delta...
READ MORE
MEMBERS ONLY

Why the MACD Crossover Signal is SO Important
by Joe Rabil,
President, Rabil Stock Research
In this exclusive StockCharts TV video, Joe shares the MACD downside crossover signal and explains the different ways it can play out when it takes place above the MACD zero line. These downside crossovers can lead to opportunities depending on other criteria, including the ADX action. He then shows how...
READ MORE
MEMBERS ONLY

Sector Rotation is Giving Conflicting Stories!
by Julius de Kempenaer,
Senior Technical Analyst, StockCharts.com
In this video from StockCharts TV,Julius dives in to the sector rotation model, trying to find any alignment between theoretical and real-life rotations of sectors in combination with the economic cycle. The positions of the various sectors and the economic indicators that are part of this model are not...
READ MORE
MEMBERS ONLY

The Master Sentiment Chart You Need to Follow
by David Keller,
President and Chief Strategist, Sierra Alpha Research
KEY TAKEAWAYS
* The put/call ratio measures volumes in the options market to compare bullish vs. bearish positioning.
* The AAII Survey is close to the 50% bullish level, which often coincides with major market tops.
* The NAAIM Exposure Index, currently just above 90%, tells us that money managers are not...
READ MORE
MEMBERS ONLY

Larry's Final LIVE "Family Gathering" Webinar Airs THIS WEEK - Friday, October 18 at 2 PM EDT!
Larry is going LIVE! Don't miss the upcoming final "Family Gathering" webinar with Larry Williams, airing live through Zoom on Friday, October 18 at 2:00pm Eastern Daylight Time.
In this must-see event, Larry will be presenting his current opinions on a broad variety of current...
READ MORE
MEMBERS ONLY

SCTR Report: American Tower is Breaking Out Now; Don't Miss It!
by Jayanthi Gopalakrishnan,
Director of Site Content, StockCharts.com
KEY TAKEAWAYS
* American Tower is a Real Estate Investment Trust (REIT) stock that's on the verge of an upside breakout.
* The weekly chart of American Tower shows clear resistance and support levels that can help identify entry points.
* Look for American Tower's stock price to reach...
READ MORE
MEMBERS ONLY

The Next Big Move in Yields May Be Different Than You Think
by Martin Pring,
President, Pring Research
Below, Chart 1 shows a weekly plot for the 30-year yield, where we can see a perfectly formed top whose completion was followed by a negative 65-week EMA crossover. At the time of the breakdown, there were few grounds for suspecting a false break. However, in the last couple of...
READ MORE
MEMBERS ONLY
Stay Ahead: Key Sentiment Indicators to Track in October 2024!
by David Keller,
President and Chief Strategist, Sierra Alpha Research
Which market sentiment indicators should we follow to validate the current bull market phase and anticipate a potential market top? David Keller, CMT breaks down three sentiment indicators he's watching in October 2024, explains their calculations and methodology, reviews their signals during previous bull market cycles, and describes...
READ MORE
MEMBERS ONLY

MarketCarpets: The Fastest Way to Scan for Hidden Market Opportunities
by Karl Montevirgen,
The StockCharts Insider
KEY TAKEAWAYS
* Use the StockCharts MarketCarpets to get a fast snapshot of market trends without sifting through endless news.
* Toggle between performance and technical rankings like SCTR to find hidden opportunities.
* Make MarketCarpets part of your daily routine to catch opportunities faster than traditional methods.
When Wall Street rings its...
READ MORE
MEMBERS ONLY
DP Trading Room: NVDA Lifts Semiconductors Higher
by Erin Swenlin,
Vice President, DecisionPoint.com
It's time to put Semiconductors in the spotlight. NVDA is starting to trade at all-time highs again and that is likely to bring the Semiconductor industry group up to its own all-time highs. Erin discusses Semiconductors "under the hood" and highlights the NVDA chart.
Carl brings...
READ MORE