MEMBERS ONLY
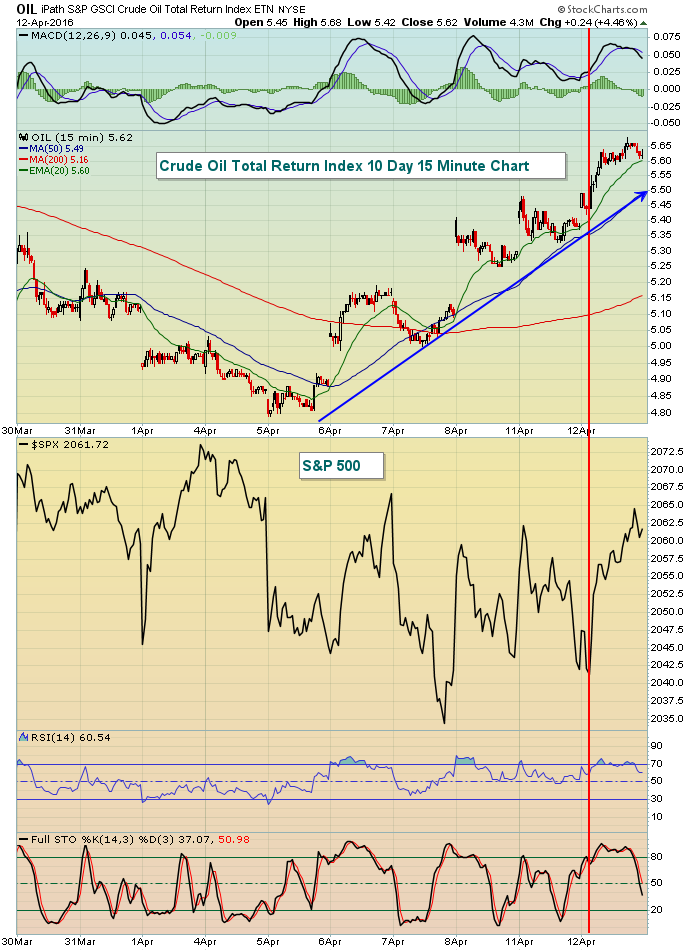
Energy Helps S&P 500 Hold Key Moving Average

by Tom Bowley,
Chief Market Strategist, EarningsBeats.com
Market Recap for Tuesday, April 12, 2016
Just before Tuesday's open, the International Monetary Fund (IMF) lowered its forecast for world economic growth. Then shortly after the open, all of our major indices lost recent price support and rising 20 day EMA support. Short-term prospects were worsening and...
READ MORE
MEMBERS ONLY
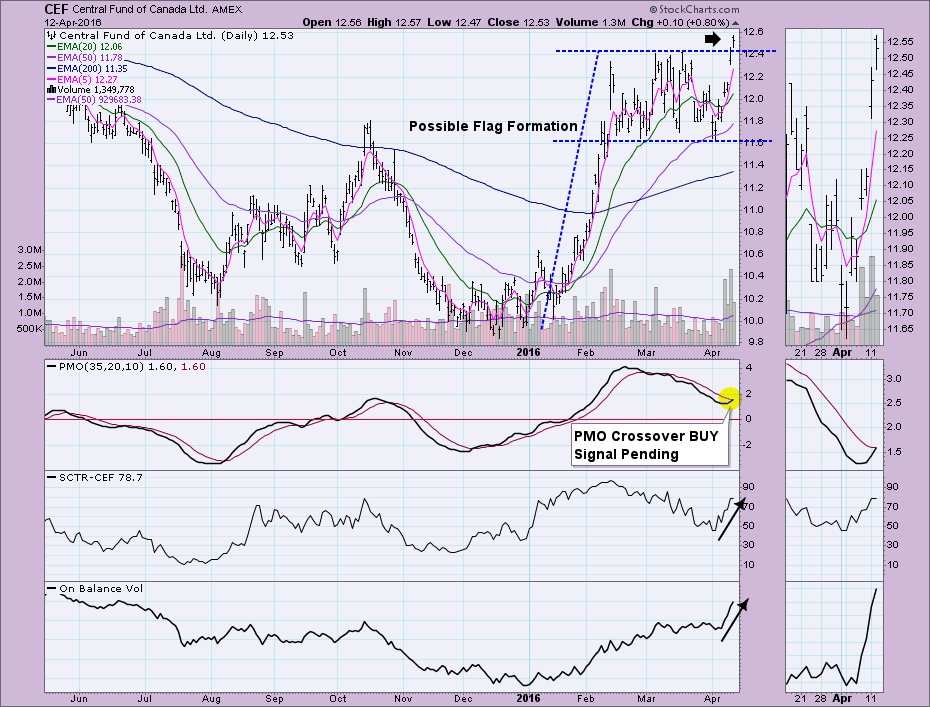
Beautiful Breakout on Central Fund of Canada (CEF)

by Erin Swenlin,
Vice President, DecisionPoint.com
Central Fund of Canada (CEF) is a closed-end fund that holds gold and silver bullion. I have been bullish on Gold (see the DecisionPoint Alert) so it wasn't a complete surprise when this ETF landed in the middle of my last Price Momentum Oscillator (PMO) scan. The bullishness...
READ MORE
MEMBERS ONLY

ENERGY SPDR CLEARS 200-DAY AVERAGE -- ENERGY LEADERS INCLUDE CHEVRON, EXXON MOBIL, PIONEER NATURAL RESOURCES, EOG, AND SCHLUMBERGER -- S&P METALS AND MINING SPDR REACHES NINE-MONTH HIGH

by John Murphy,
Chief Technical Analyst, StockCharts.com
ENERGY SPDR TRADES ABOVE 200-DAY MOVING AVERAGE... My weekend message showed the Energy Sector SPDR (XLE) rising up to test its 40-week moving average for the third time since last May. I also pointed out that weekly MACD lines had already exceeded their fourth quarter highs, which increased the odds...
READ MORE
MEMBERS ONLY
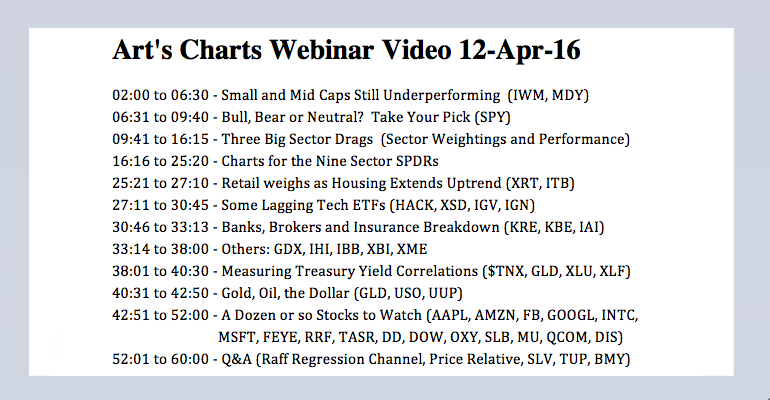
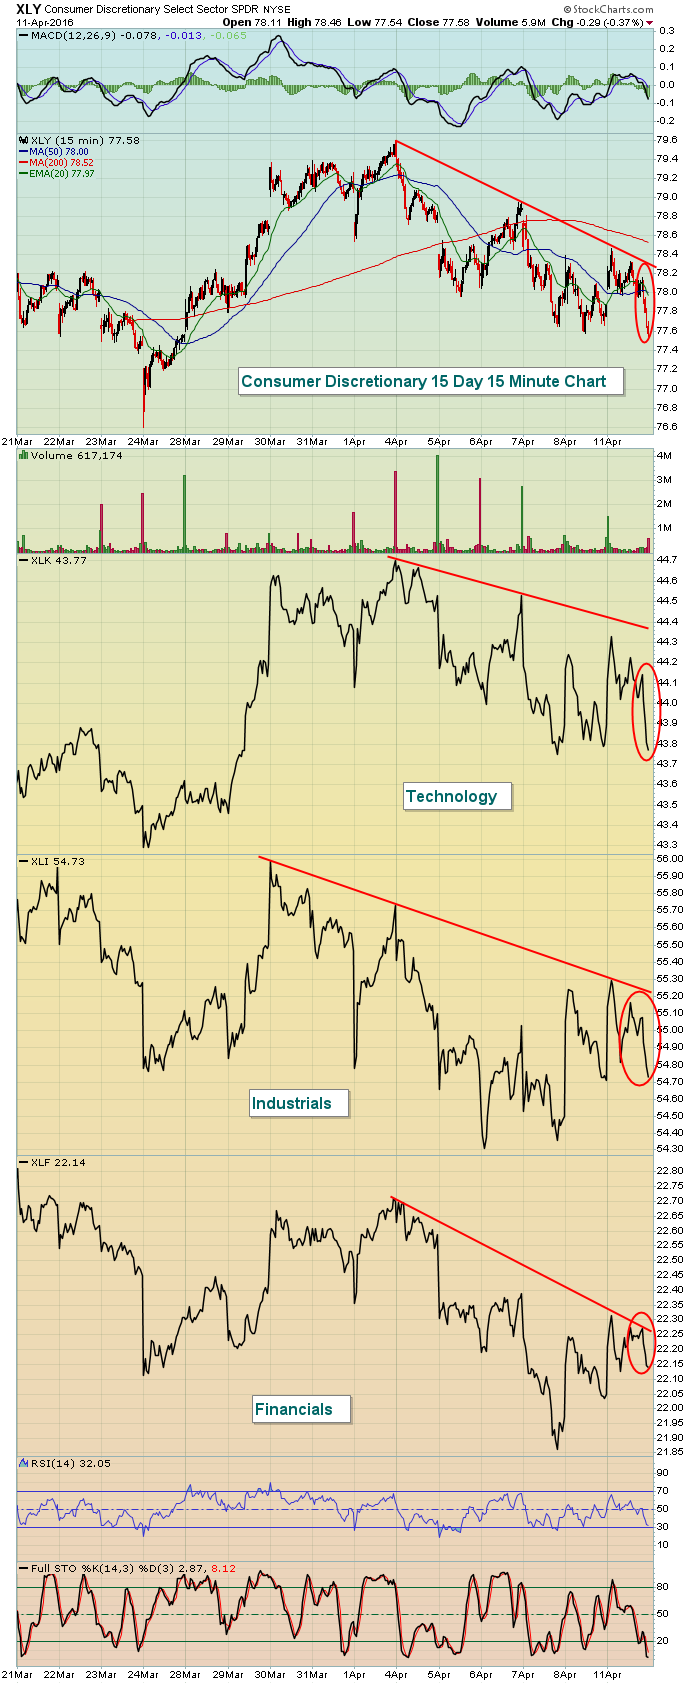
Bull, Bear or Neutral? - Small-Mids Underperforming - Three Big Sector Drags - Webinar Video

by Arthur Hill,
Chief Technical Strategist, TrendInvestorPro.com
Bull, Bear or Neutral? // Small and Mid Caps Still Underperforming // Three Big Sector Drags // Breaking Down Sector Weightings // Ranking the Nine Sector SPDRs // Webinar Video ////
Bull, Bear or Neutral?
There is an argument to be made that the S&P 500 SPDR (SPY) is in a big trading range....
READ MORE
MEMBERS ONLY
Dollar Reaches Six Month Low, Lifts Commodities
by Tom Bowley,
Chief Market Strategist, EarningsBeats.com
Market Recap for Monday, April 11, 2016
It was a disappointing day on Wall Street Monday as nice early gains vanished by the close with all of our major indices at the door step of 20 day EMA support. The Dow Jones was higher by 155 points 30 minutes into...
READ MORE
MEMBERS ONLY
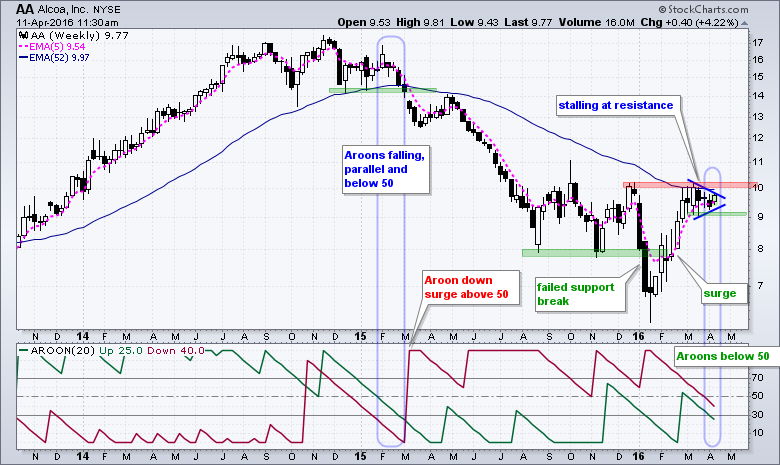
Alcoa Stalls at Resistance as Earnings Kickoff Looms
by Arthur Hill,
Chief Technical Strategist, TrendInvestorPro.com
Alcoa (AA) kicks off first quarter earnings with its report today after the market close. I have no idea about earnings or how the stock will react, but price is at a most interesting juncture as a consolidation takes place just below resistance. This weekly candlestick chart shows AA breaking...
READ MORE
MEMBERS ONLY
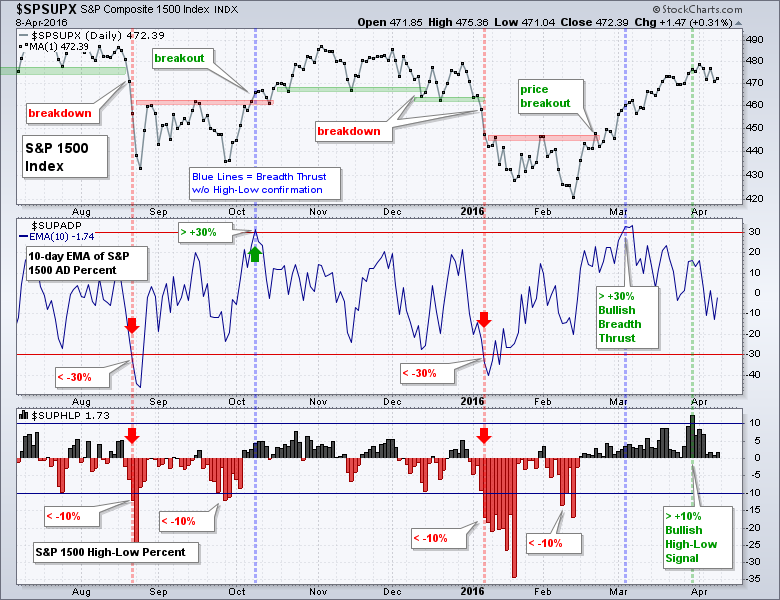
High-Low Percent Triggers - Risk Indicators Weaken - Gold Forms Bull Flag
by Arthur Hill,
Chief Technical Strategist, TrendInvestorPro.com
High-Low Percent Confirms Bullish Environment // Pullbacks Remain Shallow // IWM Forms Bullish Continuation Pattern // Risk Indicators Soften // Treasury Bond ETFs Break Out // Oil Corrects and Breaks Out // Gold Challenges Flag Resistance // Catching Up ////
High-Low Percent Confirms Bullish Environment
I am back in the saddle and not much has changed in the...
READ MORE
MEMBERS ONLY
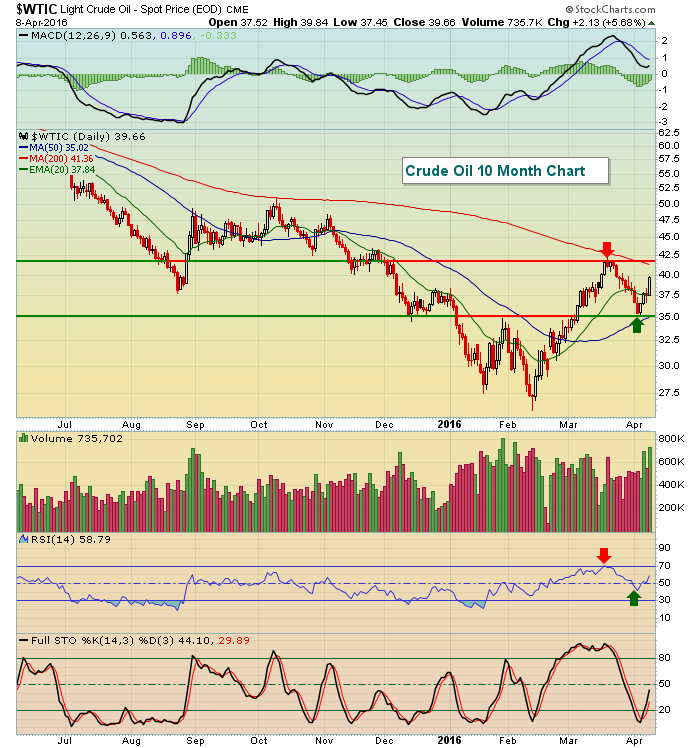
Energy Rebounds To Lead U.S. Equities On Friday
by Tom Bowley,
Chief Market Strategist, EarningsBeats.com
Market Recap for Friday, April 8, 2016
Our major indices gave up a big chunk of their earlier gains on Friday, but did manage to finish in positive territory. Crude oil ($WTIC) topped off a superb week (+8.27%) by rising 5.68% on Friday alone. The WTIC is now...
READ MORE
MEMBERS ONLY
Candlestick Analysis - Statistics III

by Greg Morris,
Veteran Technical Analyst, Investor, and Author
Additional information in regard to the determination of the suitability of candle patterns is to look at the Net Profit divided by the Net Loss per Trade. This would be a measure of the overall profitability of candle patterns based upon the prediction interval. Table A shows this data with...
READ MORE
MEMBERS ONLY
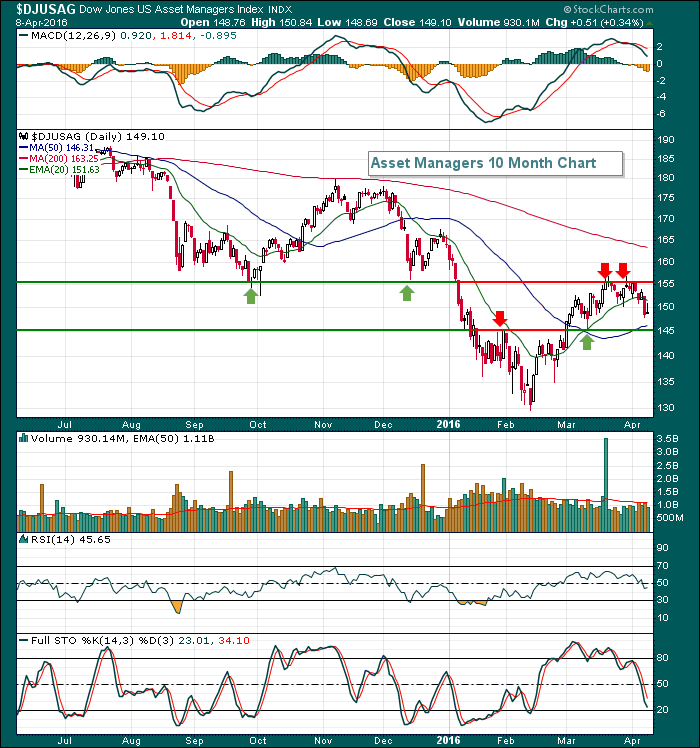
Asset Managers Failing At Price Resistance And Rolling Over
by Tom Bowley,
Chief Market Strategist, EarningsBeats.com
Last week was horrible for financial stocks as the XLF tumbled 2.86%. Investment services ($DJUSSB) and asset managers ($DJUSAG) were at the bottom of the heap with losses of 6.00% and 3.94%, respectively. The losses were technically damaging for both industry groups as both now appear to...
READ MORE
MEMBERS ONLY

FALLING BOND YIELDS HURT BANKS -- SAFE HAVEN BUYING OF TREASURIES, GOLD, AND YEN SHOW A CAUTIOUS MOOD -- HEALTH CARE SPDR RISES TO TEST 200-DAY AVERAGE -- ENERGY SPDR TESTS 40-WEEK AVERAGE -- MACD LINES LOOK POSITIVE
by John Murphy,
Chief Technical Analyst, StockCharts.com
FALLING BOND YIELDS HURTS BANKS ... Treasury bond yields continue to drop. Chart 1 shows the 10-Year Treasury Bond Yield touching the lowest level since February. Part of that is buying of Treasury bonds in an overbought stock market. Part of it is also historically low sovereign bond yields in Europe...
READ MORE
MEMBERS ONLY
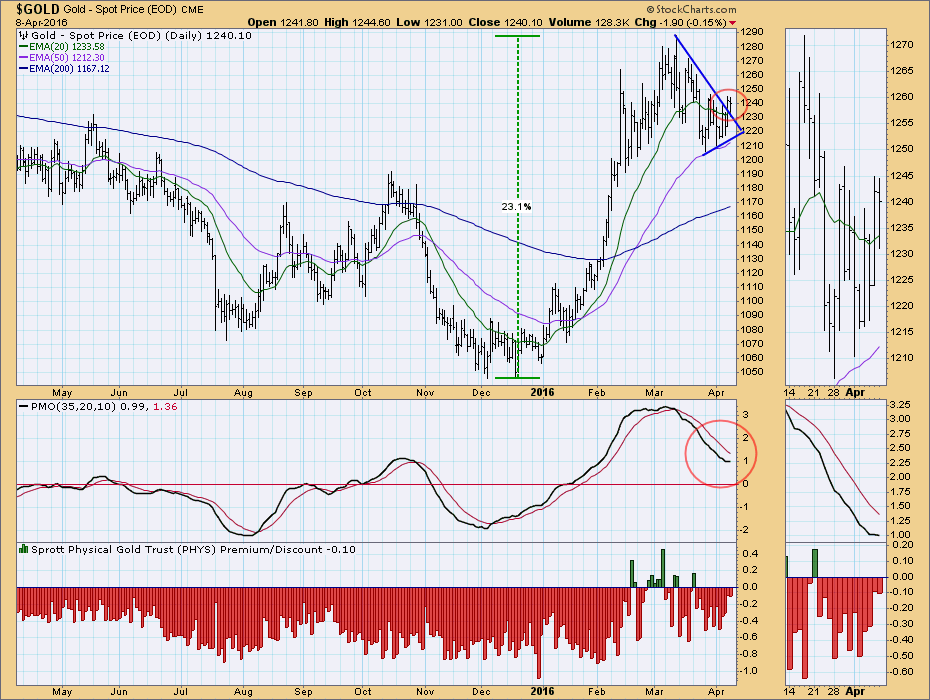
GOLD: Correction Over?

by Carl Swenlin,
President and Founder, DecisionPoint.com
After the 2011 top, gold entered a four-year bear market that trimmed nearly -50% off its value. In December 2015 the final price low was hit and gold subsequently rallied over +20%, making a new high in March of this year. Since then, it began a period of correction/consolidation,...
READ MORE
MEMBERS ONLY

Stalking the Trade

by Bruce Fraser,
Industry-leading "Wyckoffian"
No matter your investment timeframe, consider your trade to be a campaign. A campaign has steps or actions from beginning to end. A campaign has mental state management from beginning to end. Mental states vary from the patience of stalking to the aggressiveness of taking profits to conclude the trade....
READ MORE
MEMBERS ONLY

The Secret of Success Is...

by Gatis Roze,
Author, "Tensile Trading"
This past February, John Elway, General Manager of the Denver Broncos, achieved the pinnacle of success when his team won the 2016 Super Bowl. When I was a graduate student in business school, I had the privilege and good fortune of watching Elway play football as the quarterback for Stanford...
READ MORE
MEMBERS ONLY
The Key Short-Term Test Has Begun
by Tom Bowley,
Chief Market Strategist, EarningsBeats.com
Market Recap for Thursday, April 7, 2016
It was a rough day yesterday. All of our major indices were down. All nine sectors were lower. Unless you were trading gambling stocks or mining for gold, you probably saw red numbers. The selling was truly across the board. But there was...
READ MORE
MEMBERS ONLY

Equities Are Rolling Over Into Corrective Mode

by Martin Pring,
President, Pring Research
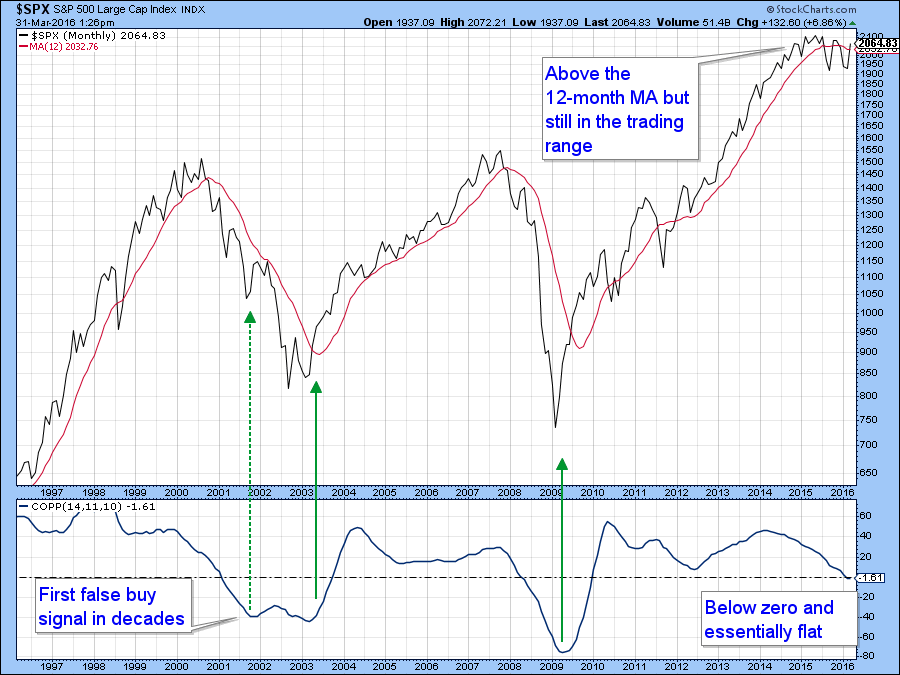
* The Coppock Curve tells us the market is at a significant juncture point
* Those pesky credit spreads are deteriorating again
* The US credit markets are close to some important signals
The Coppock Curve tells us the market is at a significant juncture point
Chart 1 features a long-term smoothed momentum...
READ MORE
MEMBERS ONLY
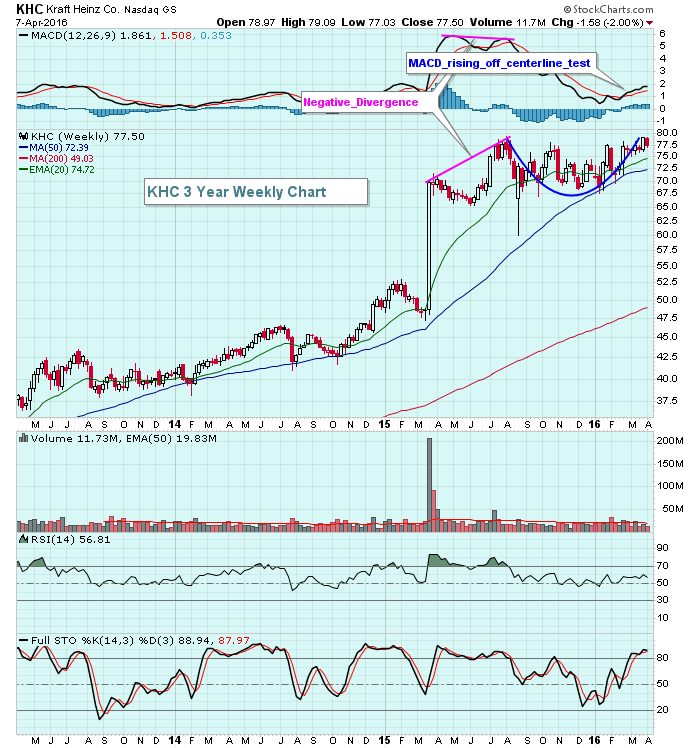
This Food Company Serving Up A Cup With Handle
by Tom Bowley,
Chief Market Strategist, EarningsBeats.com
Kraft Heinz Co (KHC) has been uptrending for several years. On its high in August, however, a negative divergence appeared on its weekly chart and, as a result, KHC sideways consolidated for the past 8 months. The good news is that it appears to be consolidating in a bullish cup...
READ MORE
MEMBERS ONLY
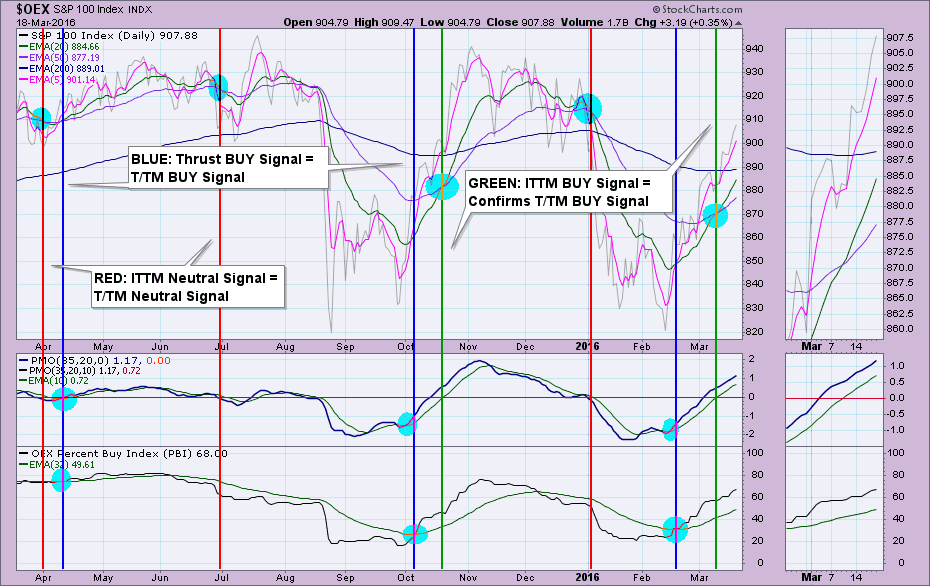
The DecisionPoint Thrust/Trend Model - Part III
by Erin Swenlin,
Vice President, DecisionPoint.com
In my previous two articles, I defined the components that make up the Thrust/Trend Model (T/TM). Now it is time to show you how those components generate the T/TM timing signals and how you can apply the T/TM to your analysis. If you haven't...
READ MORE
MEMBERS ONLY
The Direction Of Treasury Yields Remains A Major Concern
by Tom Bowley,
Chief Market Strategist, EarningsBeats.com
Market Recap for Wednesday, April 6, 2016
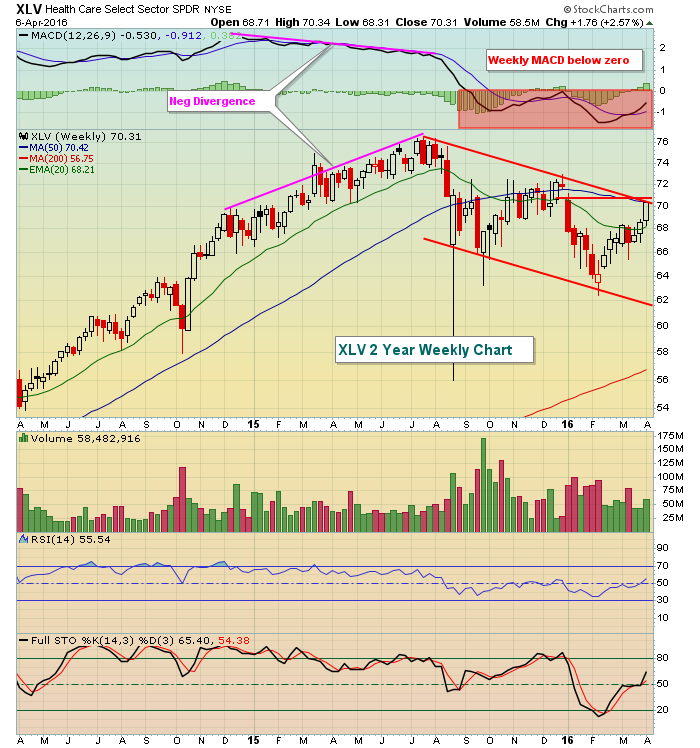
Healthcare (XLV) and energy (XLE) had huge days on Wednesday as our major indices rose throughout the day and finished on its high. Strength was seen across nearly every sector with only the defensive utilities down slightly. The best performing aggressive sector -...
READ MORE
MEMBERS ONLY
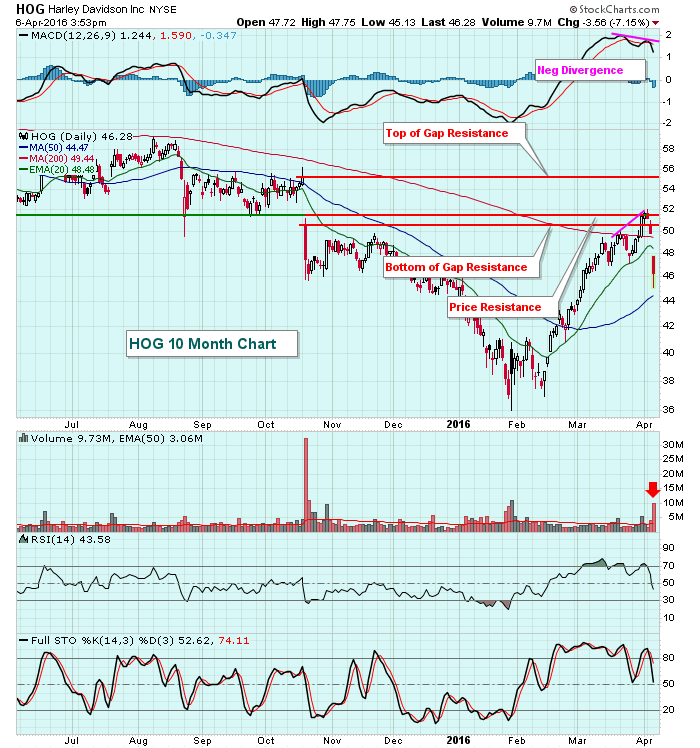
Harley Davidson (HOG) Goes Off Road
by Tom Bowley,
Chief Market Strategist, EarningsBeats.com
Volume is triple its normal daily volume and Harley Davidson (HOG) is down more than 7% today, but technical analysis flashed many warning signs on both the daily and weekly charts. First, let's look at the daily chart where price and gap resistance and a negative divergence all...
READ MORE
MEMBERS ONLY

FTSE ALL-WORLD INDEX STALLS AT RESISTANCE LINE -- RISING EURO HURTS GERMANY ISHARES -- SURGING YEN PUNISHES JAPANESE STOCKS -- OVERBOUGHT DOW INDUSTRIALS NEAR OVERHEAD RESISTANCE -- WILSHIRE 5000 TESTS MAJOR RESISTANCE LINE -- SO DO DOW TRANSPORTS
by John Murphy,
Chief Technical Analyst, StockCharts.com
FTSE WORLD INDEX BACK BELOW 200-DAY LINE... Last Wedneday's message showed the FTSE All World Stock Index ($FAW) trying to move above its 200-day moving average. Although it rose above that resistance line for a couple of days, Chart 1 shows that it's back below it...
READ MORE
MEMBERS ONLY
Article Summaries 12-2015 to 3-2016
by Greg Morris,
Veteran Technical Analyst, Investor, and Author
Most blog authors on StockCharts.com are writing about the current markets and do an exceptional job. I do not write about the current markets as I wanted to share my experiences after 40+ years as a technical analyst. Not only experiences with trading and investing, but model building and...
READ MORE
MEMBERS ONLY
German Shares Suggesting Caution In U.S.
by Tom Bowley,
Chief Market Strategist, EarningsBeats.com
Market Recap for Tuesday, April 5, 2016
U.S. equities had a rough day from the opening bell on Tuesday. The Dow Jones fell more than 100 points in a session for the first time in nearly a month as the rally off the February 11th bottom has continued to...
READ MORE
MEMBERS ONLY
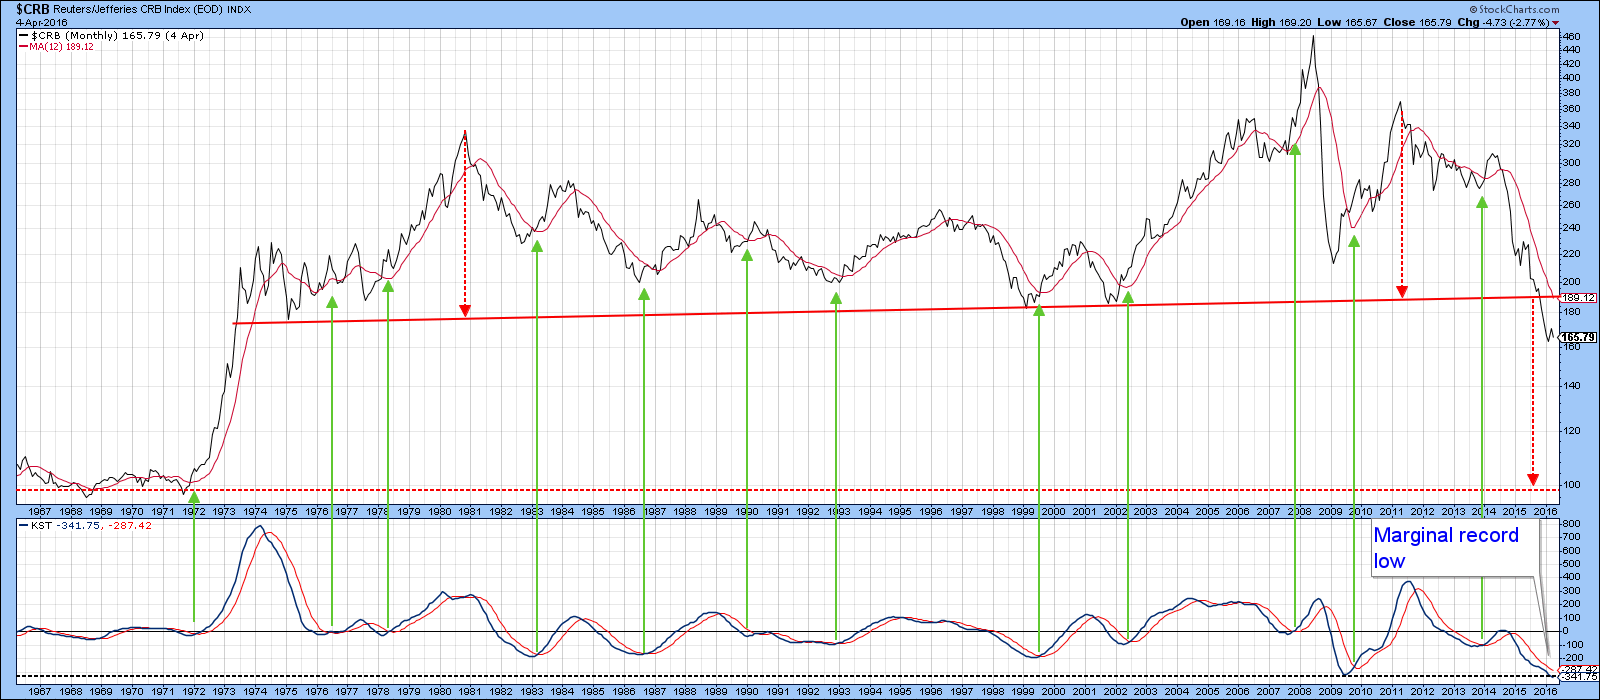
Could Commodities Be In The Process Of Forming A Major Bottom?
by Martin Pring,
President, Pring Research
* A test of the bear market low for commodities is underway
* Relative commodity action favors metals and agriculture
* Stocks to continue to outperform commodities
This week I am focusing on commodity prices, or more specifically on the Commodity Research Bureau Composite ($CRB) to see what might need to take place...
READ MORE
MEMBERS ONLY
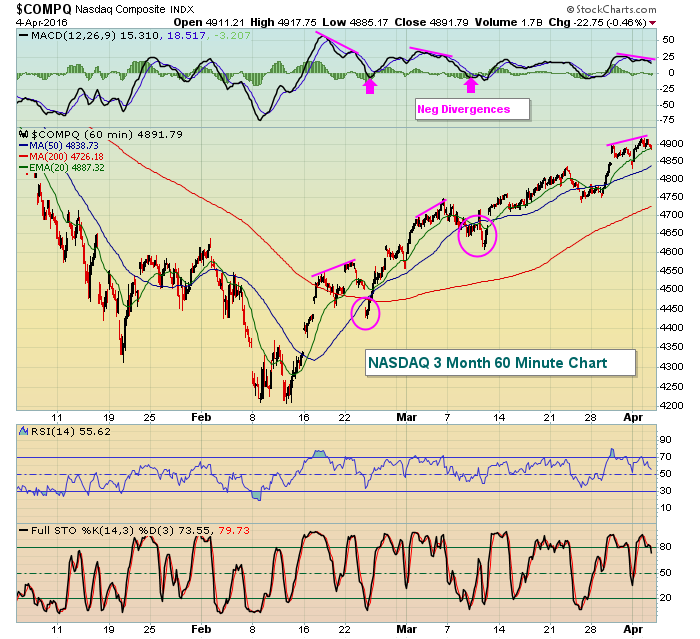
U.S. Futures Sink Amid Signs of Slowing Momentum
by Tom Bowley,
Chief Market Strategist, EarningsBeats.com
Market Recap for Monday, April 4, 2016
During my Monday webinar (CLICK HERE for recording), I highlighted a few red flags regarding a possible short-term market downturn. Among those were negative divergences across our major indices. The Moving Average Convergence Divergence (MACD) is a momentum oscillator designed to track price...
READ MORE
MEMBERS ONLY

HEALTHCARE SECTOR IS LOOKING HEALTHIER -- BOSTON SCIENTIFIC, THERMO FISHER SCIENTIFIC, AND ZIMMER BIOMET HOLDINGS ARE MEDICAL EQUIPMENT LEADERS -- BIOTECH LEADERS ARE ABBVIE, AMGEN, AND GILEAD -- THE LAST TWO ARE TESTING MAJOR DOWN TRENDLINES
by John Murphy,
Chief Technical Analyst, StockCharts.com
HEALTHCARE SPDR REACHES THREE-MONTH HIGH... Money is continuing to rotate into healthcare stocks which had been the year's weakest sector. It's been the market's strongest sector for the last two trading days. Chart 1 shows the HealthCare Sector SPDR (XLV) reaching the highest level...
READ MORE
MEMBERS ONLY
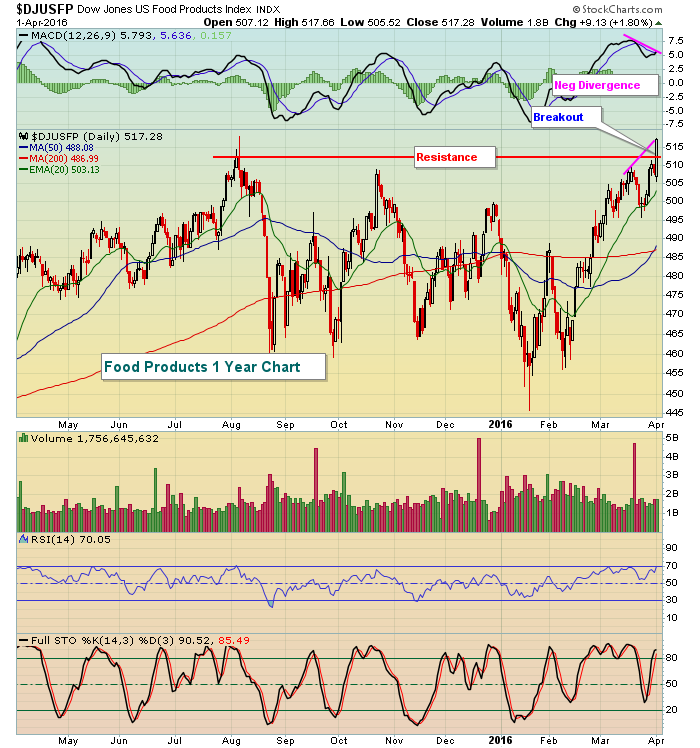
Traders Show Appetite For Food Products Friday
by Tom Bowley,
Chief Market Strategist, EarningsBeats.com
Market Recap for Friday, April 1, 2016
The market rally continues. While the majority of money seems to be flowing toward defense, which isn't a great sign of strength nor one of sustainability, it's difficult to argue with day after day of gains. So caution makes...
READ MORE
MEMBERS ONLY
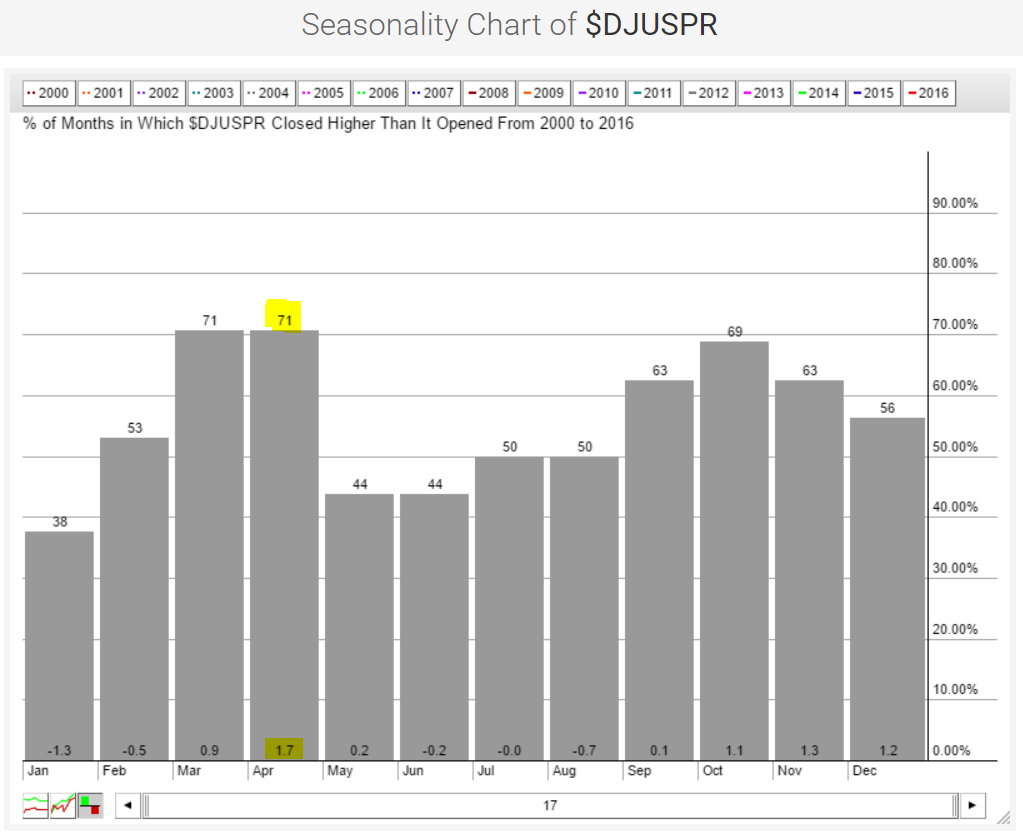
April Is A Good Prescription For Pharmaceuticals
by Tom Bowley,
Chief Market Strategist, EarningsBeats.com
The seasonality tool here at StockCharts.com provides an easy way to review historical results for indices, sectors, industry groups and individual stocks. I looked at financials and healthcare industry groups as these two sectors have performed the worst over the past three months. Perhaps seasonal strength can provide a...
READ MORE
MEMBERS ONLY
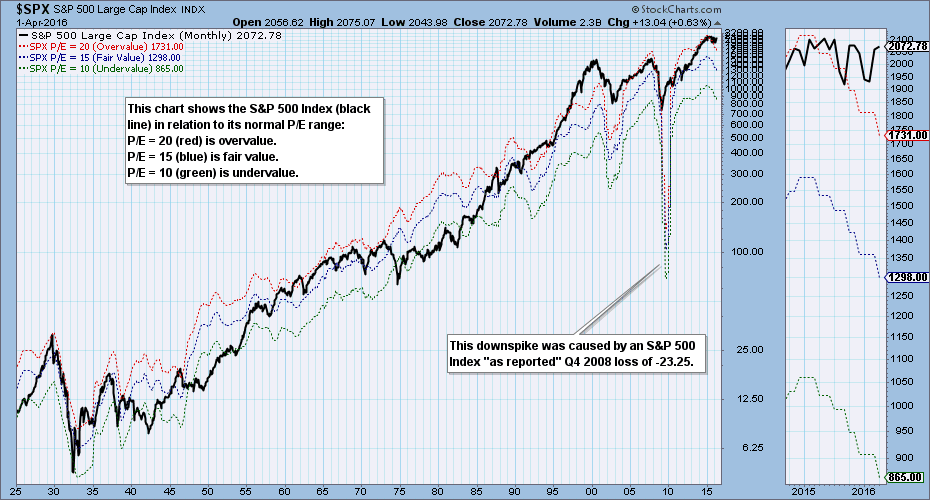
S&P 500 2015 Q4 Earnings Results: Market Even More Overbought
by Carl Swenlin,
President and Founder, DecisionPoint.com
The preliminary S&P 500 Index 2015 fourth quarter earnings results are in, and it is once again time to look at our earnings chart, which shows the S&P 500 in relation to its normal value range. (Note: The chart is a static graphic, not an active...
READ MORE
MEMBERS ONLY
Another Earnings Season Ready to Kick Off

by John Hopkins,
President and Co-founder, EarningsBeats.com
The first quarter has come and gone and now we are about to embark upon another earnings season that will officially kick off when Alcoa reports its numbers after the bell on Monday, April 11. Alcoa rarely sets the tone for earnings season but when they do report it'...
READ MORE
MEMBERS ONLY
ChartCon 2016 is Coming to a Computer Near You!
Hello Fellow ChartWatchers!
The markets continue to power higher with the S&P 500, Nasdaq and Wilshire 5000 all joining the Dow Jones Industrials in the "Above the 200-Day Moving Average" club. The Dow is now challenging its big overhead resistance area around 17,750. Last November,...
READ MORE
MEMBERS ONLY
S&P 500 2015 Q4 Earnings Results: Market Even More Overbought
by Carl Swenlin,
President and Founder, DecisionPoint.com
The preliminary S&P 500 Index 2015 fourth quarter earnings results are in, and it is once again time to look at our earnings chart, which shows the S&P 500 in relation to its normal value range. (Note: The chart is a static graphic, not an active...
READ MORE
MEMBERS ONLY
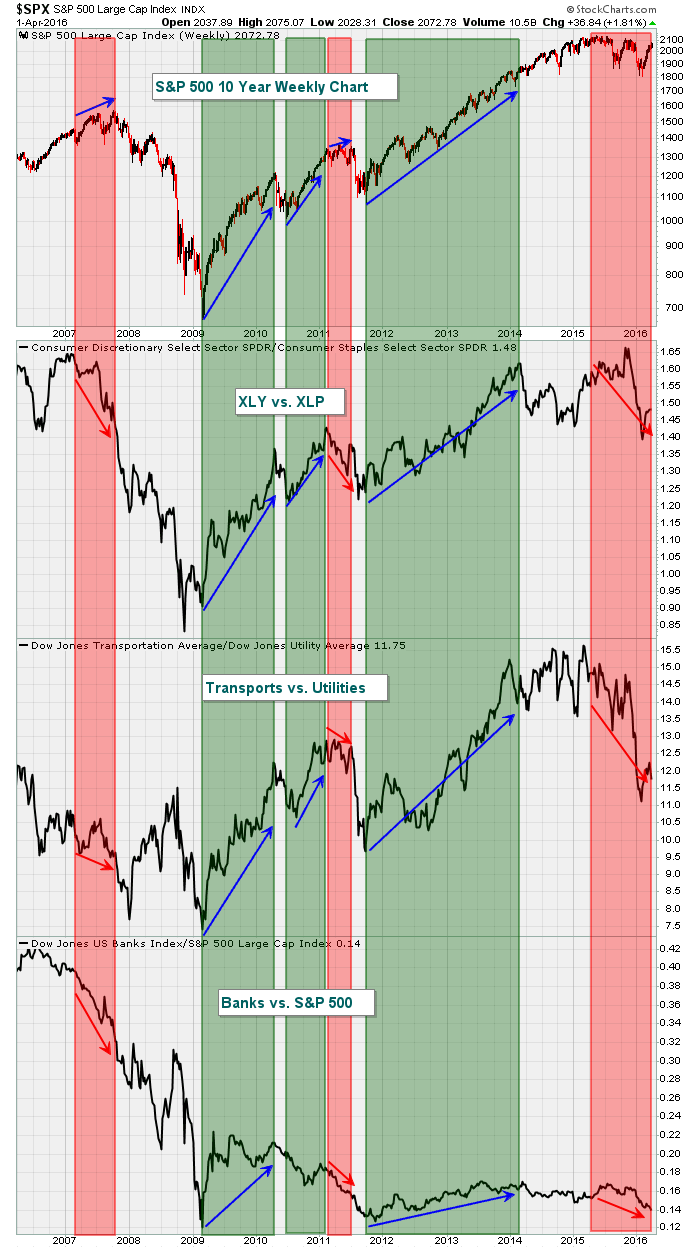
March Rotation Doesn't Support Rally
by Tom Bowley,
Chief Market Strategist, EarningsBeats.com
In order to determine the sustainability of market rallies, following the rotation between certain sectors or indices can be quite helpful. The chart below shows red shaded areas to highlight warning signs that appeared at the end of the prior bull market in 2007 and also warned of the 2011...
READ MORE
MEMBERS ONLY
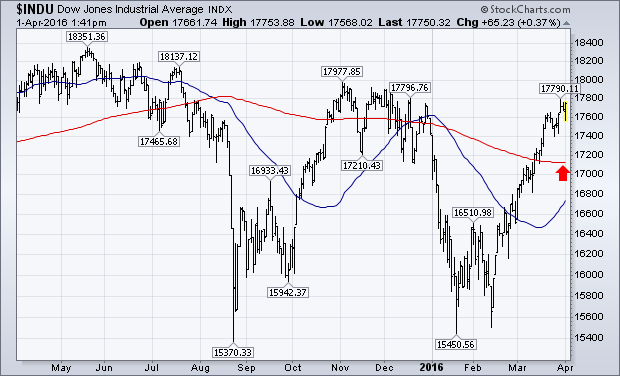
Dow and S&P 500 Near Fourth Quarter Highs
by John Murphy,
Chief Technical Analyst, StockCharts.com
The chart below shows the Dow Industrials moving closer to a test of its fourth quarter highs near 18000. Given the steepness of the recent rally, it might run into some resistance there. But its trend is still higher. The second chart shows the S&P 500 moving closer...
READ MORE
MEMBERS ONLY

How to Determine the Best Trade Entry Points
by Bruce Fraser,
Industry-leading "Wyckoffian"
Wyckoff is a complete Methodology which means that rules and processes guide when to enter a trade, how long to hold a position and when to exit the trade. We have explored the principles of stopping action, cause building and jumping into a trend. In Accumulation (as in Distribution) there...
READ MORE
MEMBERS ONLY

BIOTECHS LEAD HEALTHCARE HIGHER -- BOTH ETFS APPEAR TO BE BOTTOMING -- BIOTECH LEADERS ARE REGENERON, ILLUMINA, AND AMGEN -- NASDAQ COMPOSITE IS TRADING ABOVE 200-DAY LINE -- S&P 600 SMALL CAP INDEX IS TESTING RESISTANCE LINE
by John Murphy,
Chief Technical Analyst, StockCharts.com
BIOTECHS LEAD HEALTHCARE HIGHER... Last Friday's message showed that healthcare was the year's weakest sector, and most of that was because of a very weak biotech group. [It also mentioned that biotechs were holding back the QQQ. More on that later]. For the first time in...
READ MORE
MEMBERS ONLY

Wall Street's Free Lunch... But Investors Must Still Read the Menu
by Gatis Roze,
Author, "Tensile Trading"
To paraphrase Bill Murray from the movie “Aloha,” the future is not something that just happens. It’s a brutal force with a great sense of humor that will nickel and dime your investments until it’s totally steamrolled your portfolio if you aren’t watching.
I will concede that...
READ MORE
MEMBERS ONLY
Jobs Report Shows Slight Beat; Where Do We Go From Here?
by Tom Bowley,
Chief Market Strategist, EarningsBeats.com
Market Recap for Thursday, March 31, 2016
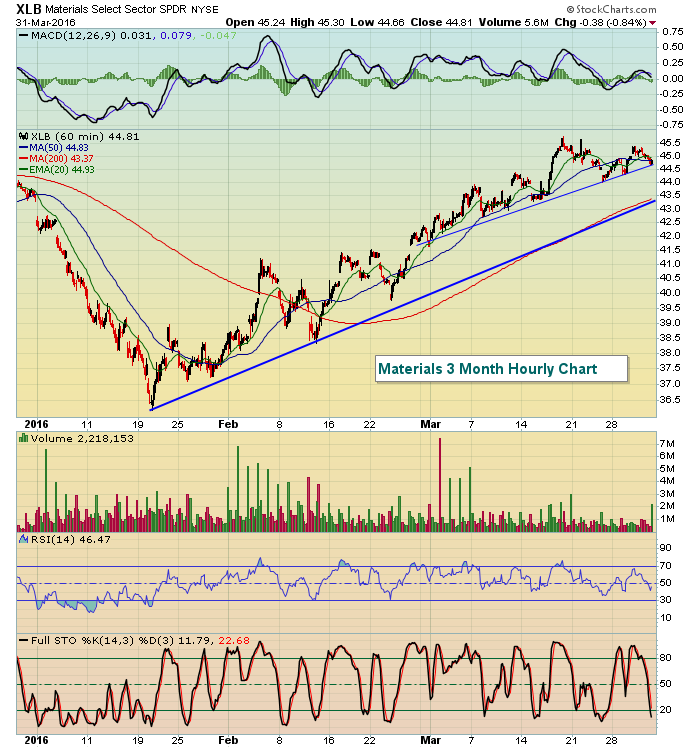
Utilities (XLU) were the only sector to finish in positive territory on Thursday, rising .59%. The remaining eight sectors fell, led by materials' (XLB) .84% decline. While the loss on Thursday was a problem for the materials bulls, weakness in the U....
READ MORE
MEMBERS ONLY
This Stock Awaiting Breakout In The Bullish Medical Supplies Group
by Tom Bowley,
Chief Market Strategist, EarningsBeats.com
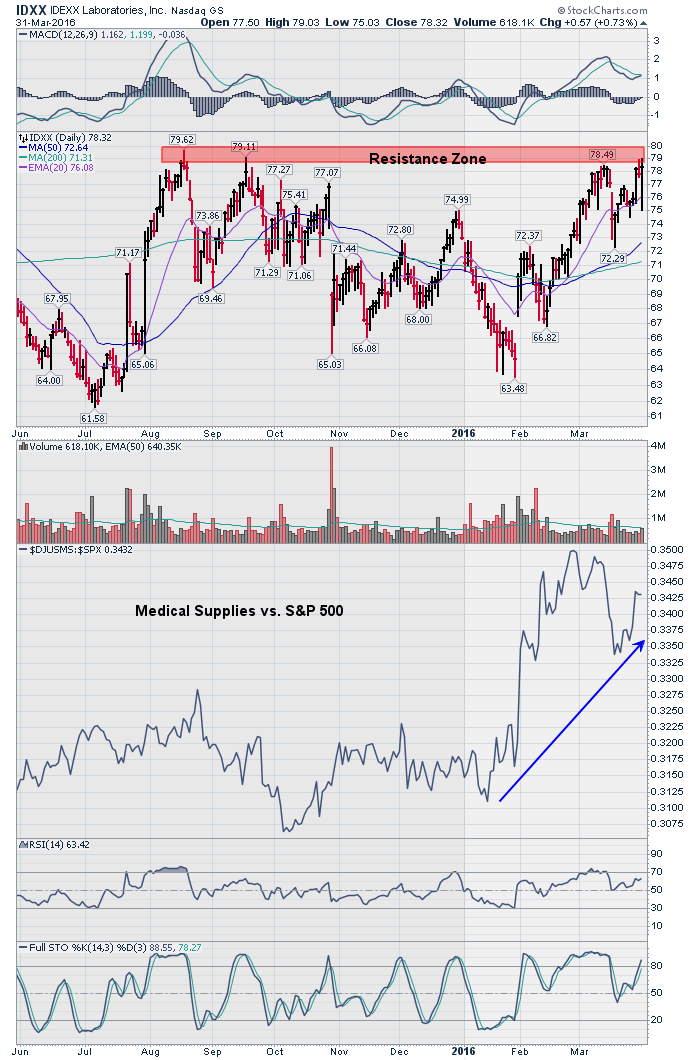
Earlier today, IDEXX Laboratories (IDXX) fell beneath its rising 20 day EMA but quickly recovered and is now on the verge of breaking above a quadruple top in the 79-80 range. Volume isn't huge, but it is increasing so a breakout should be respected. We've seen...
READ MORE
MEMBERS ONLY
US Equities Remain At A Bull/Bear Crossroad
by Martin Pring,
President, Pring Research
* Consistently reliable primary trend indicator on the fence
* Strong breadth
* Equities overbought and lacking in volume
* Rates headed lower?
Consistently reliable primary trend indicator right on the fence
The US equity market continues to bump up against resistance at a time when most short-term oscillators are overstretched. Since volume has...
READ MORE
