MEMBERS ONLY
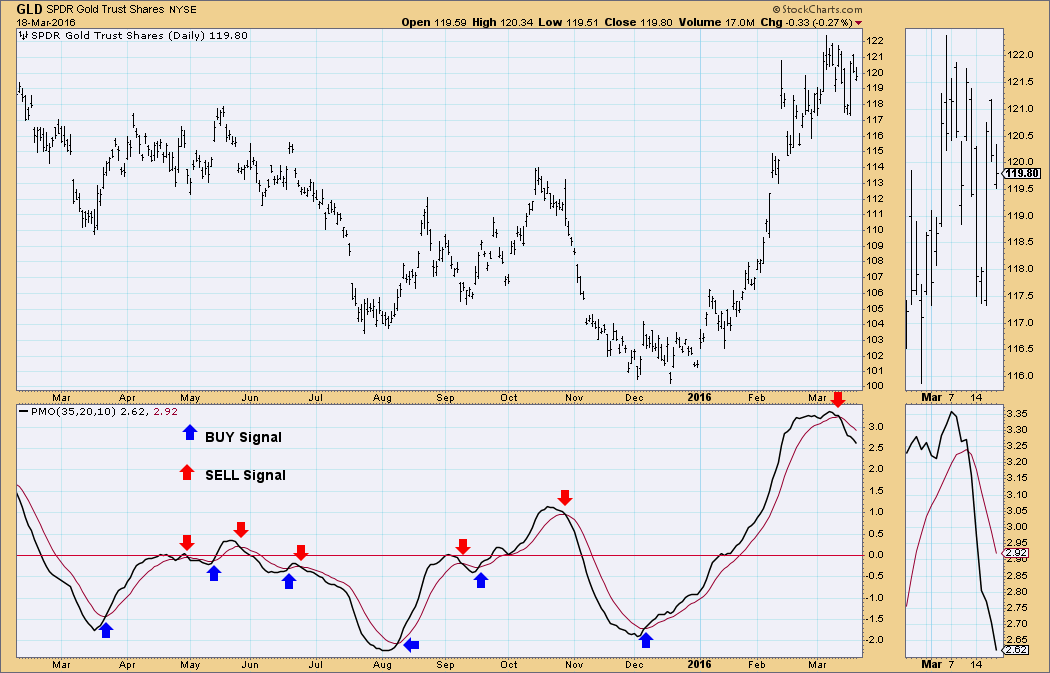
The DecisionPoint Thrust/Trend Model - Part II

by Erin Swenlin,
Vice President, DecisionPoint.com
Welcome to Part II of Thrust/Trend Model (T/TM) education. In Part I, I discussed how the Intermediate-Term Trend Model (ITTM) and Long-Term Trend Model (LTTM) generate BUY/SELL and Neutral signals. The ITTM and LTTM make up the "Trend component" of the Thrust/Trend Model. The...
READ MORE
MEMBERS ONLY
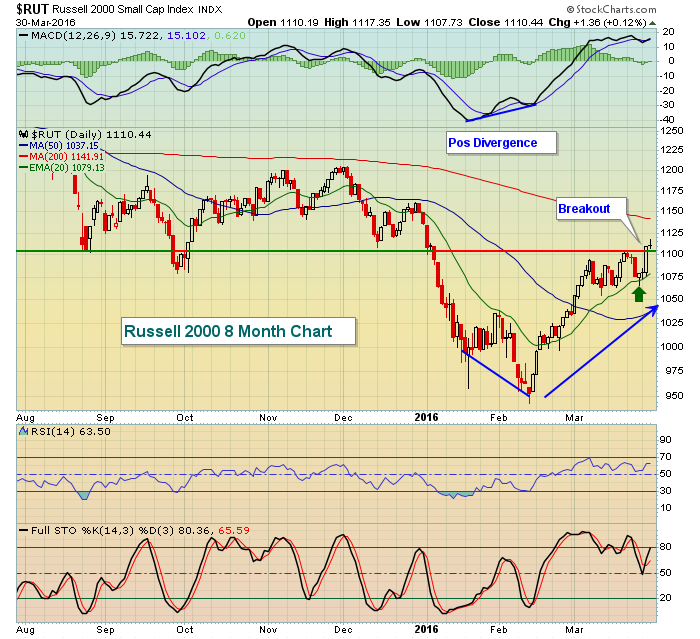
Consumer Stocks Keep The Rally Alive

by Tom Bowley,
Chief Market Strategist, EarningsBeats.com
Market Recap for Wednesday, March 30, 2016
U.S. equities jumped again, this time with most of the major indices climbing a similar percentage close to .50%. The Russell 2000 ($RUT) lagged a bit, but considering the huge outperformance on Tuesday, let's give the small caps a one...
READ MORE
MEMBERS ONLY
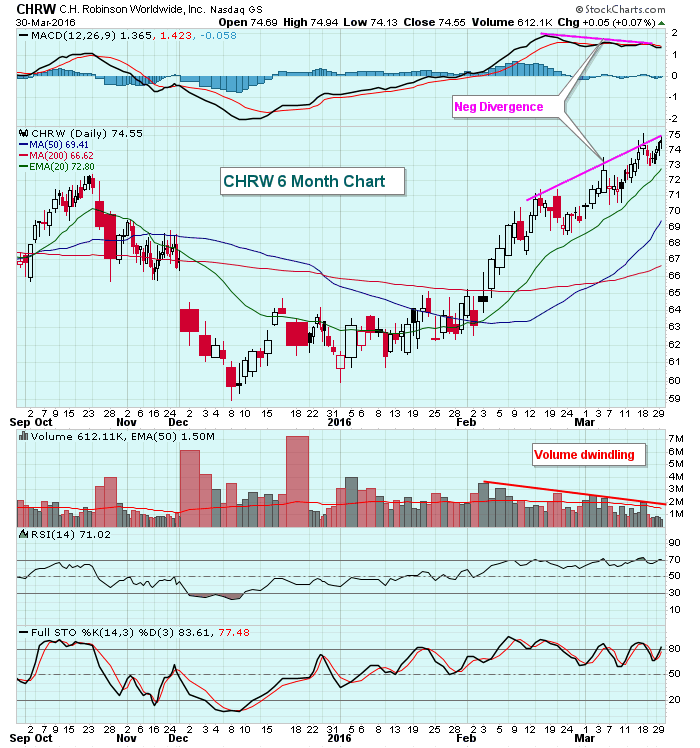
Negative Divergence Could Slow This Trucker
by Tom Bowley,
Chief Market Strategist, EarningsBeats.com
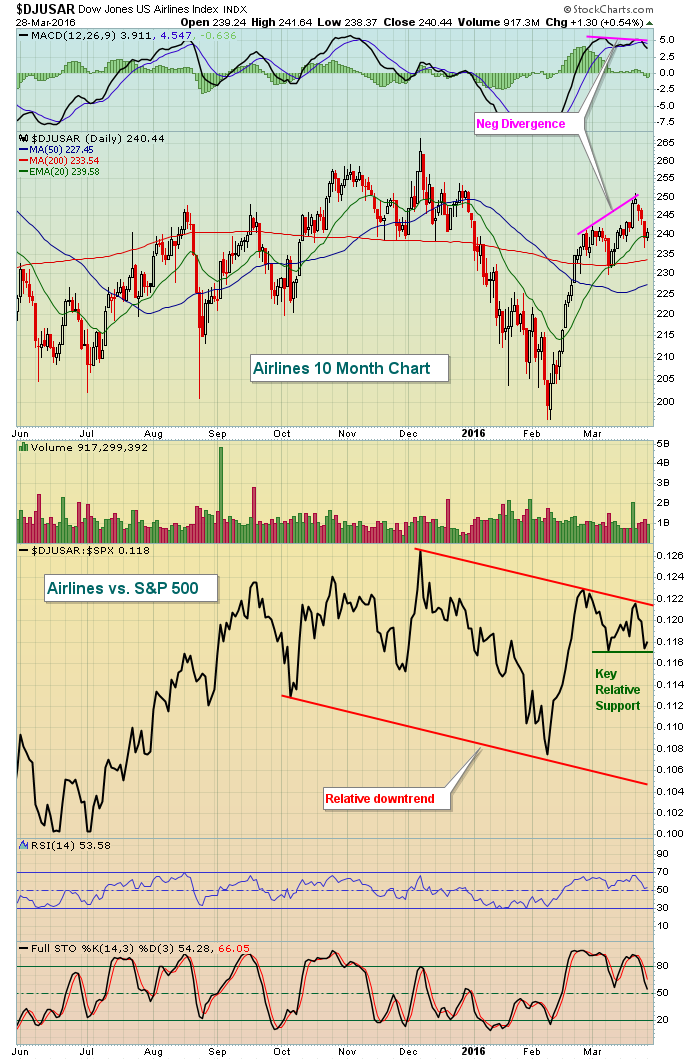
The rally in the S&P 500 has been impressive and truckers ($DJUSTK) have been among the best performing industry groups, rising 17% over the past three months. That actually places truckers as the leading industry group within the industrials over that time frame. C. H. Robinson Worldwide (CHRW)...
READ MORE
MEMBERS ONLY

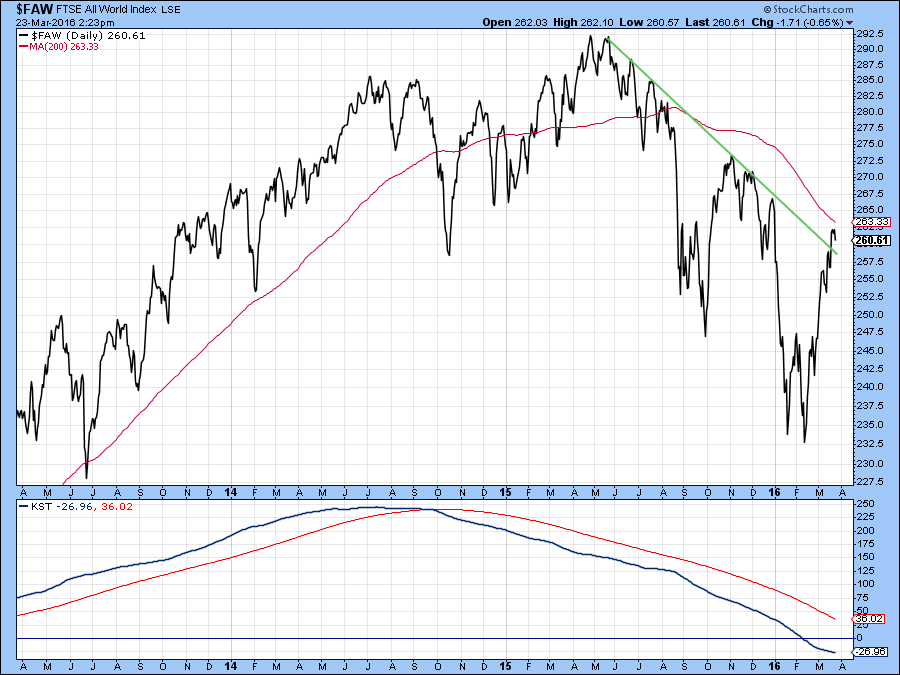
FTSE ALL WORLD STOCK INDEX IS LOOKING A LOT STRONGER -- DOLLAR REMAINS WEAK ON DOVISH FED TALK -- THAT'S BOOSTING COMMODITIES AND MULTINATIONAL STOCKS -- NYSE ADVANCE-DECLINE IS TESTING SPRING 2015 HIGH

by John Murphy,
Chief Technical Analyst, StockCharts.com
FTSE ALL WORLD INDEX OUT OF DANGER... Back on February 17, I wrote a market message showing the FTSE All World Stock Index ($FAW) starting to find support at its 2011 peak. [The FAW includes 2900 stocks in 47 developed and emerging countries, including the US]. I pointed out that...
READ MORE
MEMBERS ONLY
Candlestick Analysis - Statistics II

by Greg Morris,
Veteran Technical Analyst, Investor, and Author
Candle patterns are predictable psychological trading pictures (windows) that produce reasonable forecasting results when used in the proper manner. This article will explain the technique used to determine the various statistics developed to show the success of candle patterns. Note that no magnitude of success is used, only a relative...
READ MORE
MEMBERS ONLY
What Constitutes A Bear Market Rally?
by Tom Bowley,
Chief Market Strategist, EarningsBeats.com
Reminders
First, please subscribe to my blog at the bottom of this article. Simply click on "Yes" to the question, enter your email address and click "Subscribe". By doing so, my article will be sent directly your email as soon as it's published. It&...
READ MORE
MEMBERS ONLY
Bad Health (care) for XLV

by Julius de Kempenaer,
Senior Technical Analyst, StockCharts.com
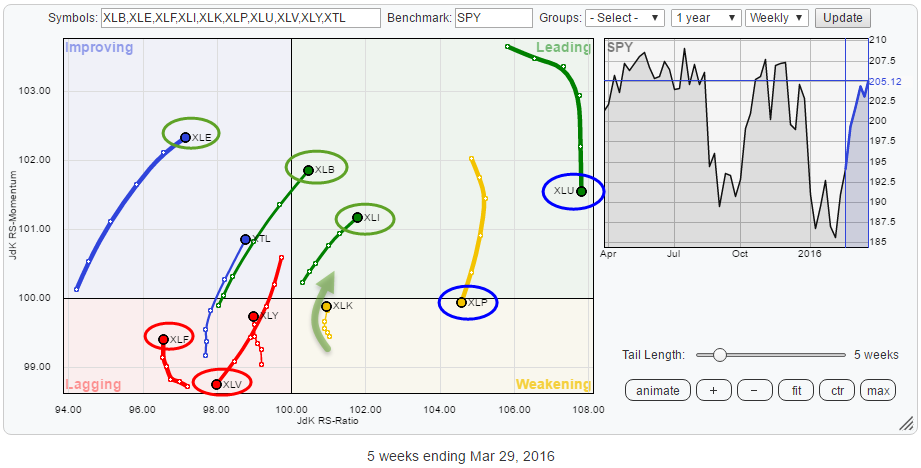
The Relative Rotation Graph for US sectors shows us the relative movement of the various sectors against the benchmark (SPY) and against each other and in this way visualizes the current sector rotation in the US equity market.
The RRG below shows the ETFs covering the major sectors of the...
READ MORE
MEMBERS ONLY

QQQ CLEARS 200-DAY AVERAGE -- LAM RESEARCH SCORES BULLISH BREAKOUT -- YAHOO IS CLOSE TO DOING THE SAME -- FACEBOOK AND MICROSOFT HAVE A STRONG DAY -- APPLE IS REBOUNDING FROM LONG TERM SUPPORT AND MAY BE BOTTOMING
by John Murphy,
Chief Technical Analyst, StockCharts.com
QQQ CLEARS 200-DAY LINE... The market was led higher by the Nasdaq market today. Last Friday's message showed the PowerShares QQQ Trust testing its 200-day moving average. Chart 1 shows the QQQ clearing that important chart barrier today. Since the QQQ is comprised of the largest 100 non-financial...
READ MORE
MEMBERS ONLY
Transports Drop For Fifth Consecutive Day, Watch These Levels
by Tom Bowley,
Chief Market Strategist, EarningsBeats.com
Market Recap for Monday, March 28, 2016
Monday was another day of market bifurcation with the Dow Jones, S&P 500 and Russell 2000 barely higher, while the NASDAQ suffered a minor loss. Few analysts expected the type of rally we've seen off the February 11th bottom,...
READ MORE
MEMBERS ONLY
Energy Regains Leadership Role, Stocks Post Small Gains
by Tom Bowley,
Chief Market Strategist, EarningsBeats.com
Market Recap for Thursday, March 24, 2016
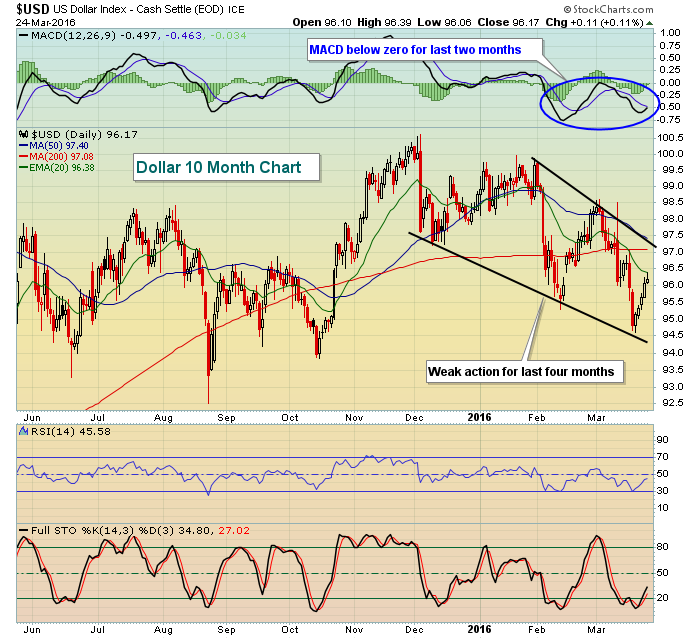
Despite a rising dollar ($USD), energy (XLE) was the best performing sector on Thursday, posting a .49% gain, while financials (XLF) were the biggest loser, dropping .62%. Four sectors rose while four declined and materials (XLB) finished exactly where they started. The dollar...
READ MORE
MEMBERS ONLY
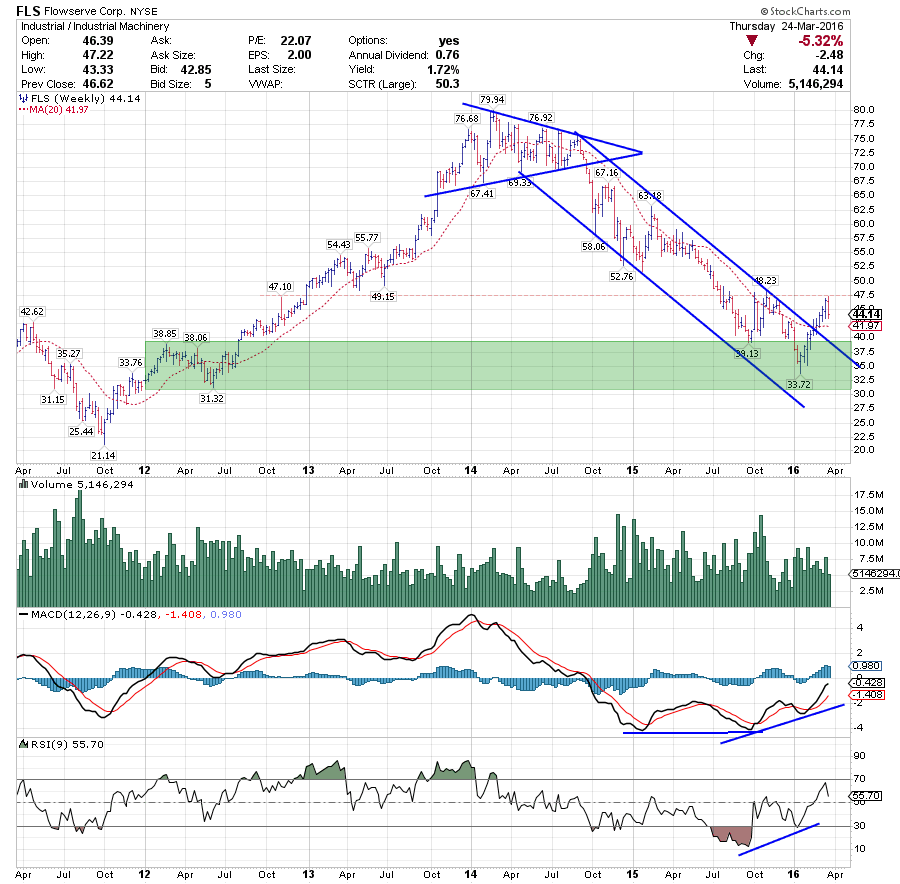
Getting in (f)LOW(serve)
by Julius de Kempenaer,
Senior Technical Analyst, StockCharts.com
FLS is a stock that has been pretty much off the radar for two years as a potential long candidate, but this looks to be changing now!
After breaking out of an almost perfect symmetrical triangle in 2014, FLS trended lower until the beginning of this year, when a low...
READ MORE
MEMBERS ONLY
Market: Overbought and Topping

by Carl Swenlin,
President and Founder, DecisionPoint.com
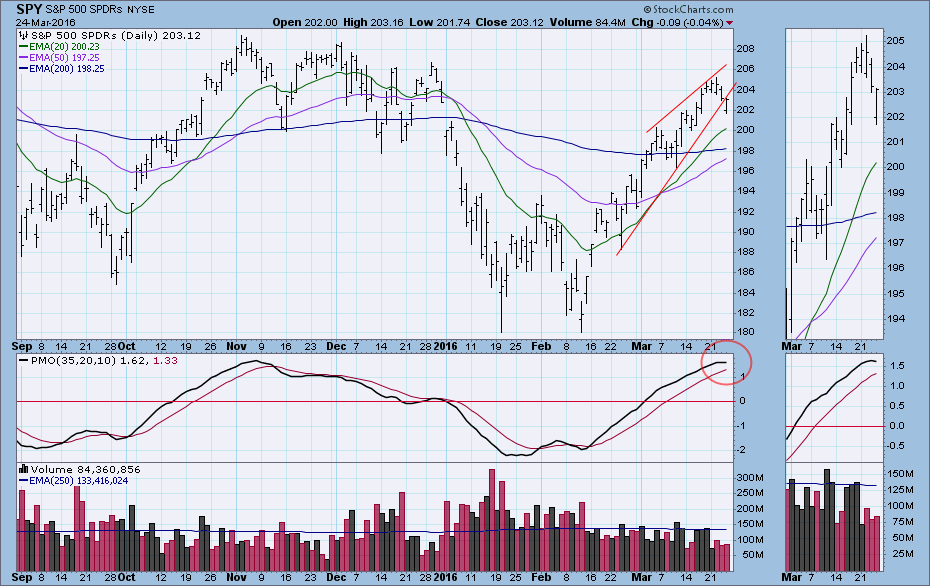
On Thursday SPY broke below a short-term rising trend line. This might not have been too big a deal, but there is other evidence that something more negative is developing. For one thing, we can see on the chart that the PMO has topped at an overbought levelsimilar to the...
READ MORE
MEMBERS ONLY
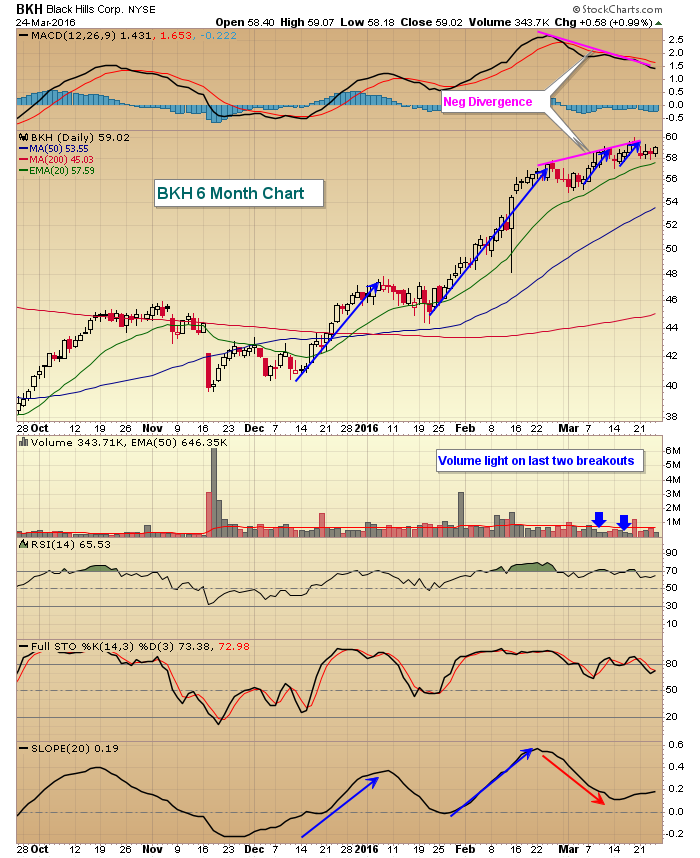
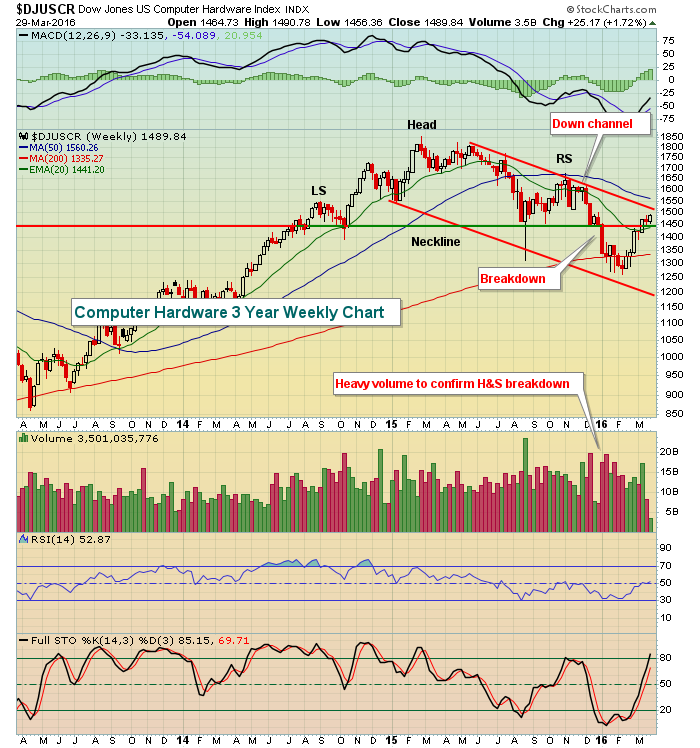
Here's What A Warning Sign Looks Like
by Tom Bowley,
Chief Market Strategist, EarningsBeats.com
From a short- to intermediate-term trading perspective, slowing momentum to the upside is a warning sign if you're long. Slowing momentum can come in different forms, but I consider negative divergences on the MACD and weak volume on price breakouts to be two solid examples. Based on these...
READ MORE
MEMBERS ONLY

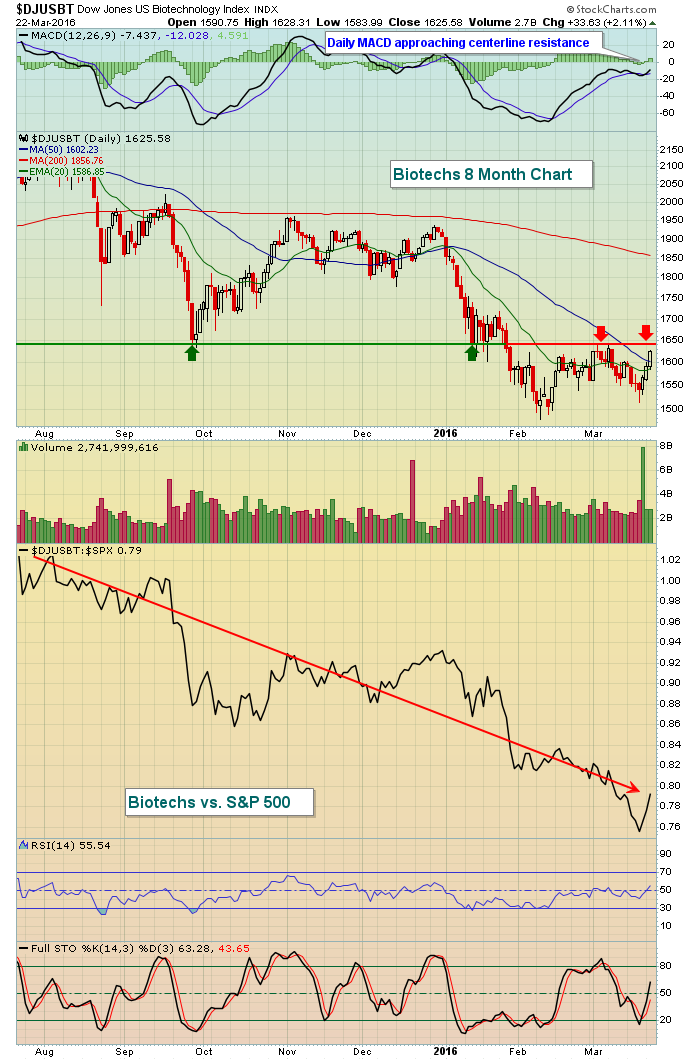
STOCK MARKET DIGESTS ITS GAINS -- DOW INDUSTRIALS AND S&P 500 REMAIN ABOVE 200-DAY LINES -- THE NASDAQ 100, HOWEVER, IS STILL TESTING THAT RESISTANCE LINE -- BIOTECHS HAVE BEEN THE BIGGEST DRAG ON THE NASDAQ -- GILEAD SCIENCES IS STILL IN DOWNTREND
by John Murphy,
Chief Technical Analyst, StockCharts.com
DOW AND S&P 500 HOLD ABOVE 200-DAY LINES... Given the size of the market rally since mid-February, it's not surprising to see it spend the past week consolidating. While the market had its first down week after five up weeks, very little changed on the charts...
READ MORE
MEMBERS ONLY

The "WHY" Investors Versus The "WHAT" Investors: And The Winner Is...

by Gatis Roze,
Author, "Tensile Trading"
Highly educated people are, for the most part, trained to ask the question “Why?” Engineers, accountants, doctors, lawyers and the like invariably want to know all they can about why certain things happen. The assumption is, of course, that knowing why will help you do the right thing in your...
READ MORE
MEMBERS ONLY
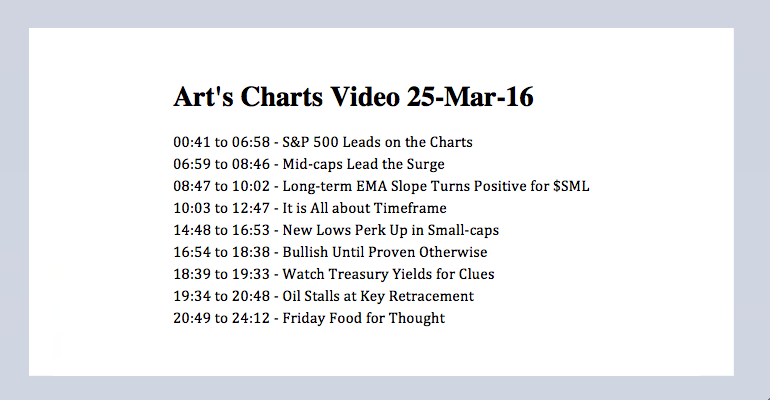
Large-cap Trend Indicators Turn up - Small-cap New Lows Tick up - Watching T-Yields and Oil

by Arthur Hill,
Chief Technical Strategist, TrendInvestorPro.com
$SPX Leads on the Charts // Vacation // $MID Leads the Surge // Long-term EMA Slope Turns Positive for $SML // It is All about Timeframe // New Lows Perk Up in Small-caps // Bullish Until Proven Otherwise // Watch Treasury Yields for Clues // Oil Stalls at Key Retracement // Friday Food for Thought ////
S&P 500...
READ MORE
MEMBERS ONLY
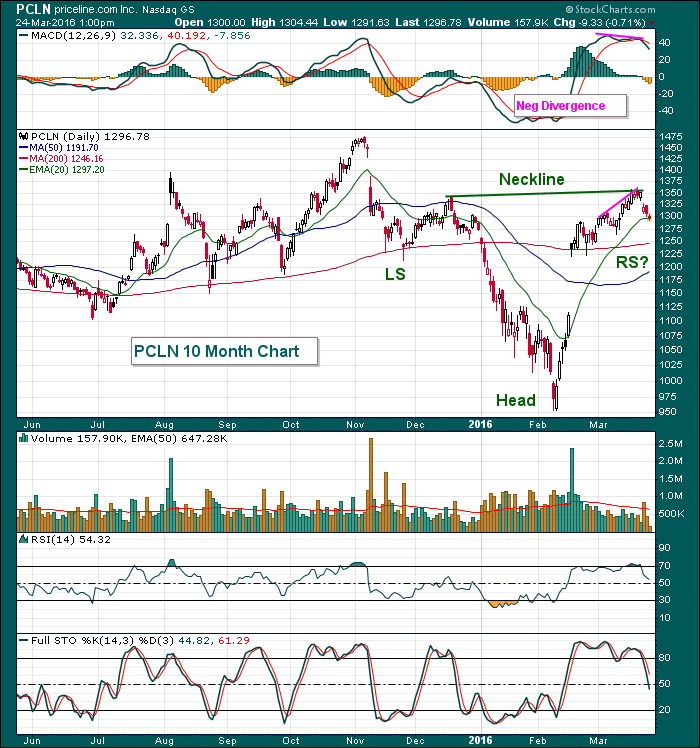
Priceline's (PCLN) Continuation Pattern Is Bullish
by Tom Bowley,
Chief Market Strategist, EarningsBeats.com
Priceline (PCLN) has seen lots of volatility over the past several months including sizable gaps higher and lower, but the technical picture remains bright. The near-term has turned dicey as a negative divergence has emerged, but that slowing momentum could be exactly what this bullish inverse head & shoulders pattern...
READ MORE
MEMBERS ONLY
The DecisionPoint Thrust/Trend Model - Part I
by Erin Swenlin,
Vice President, DecisionPoint.com
I'm going to give you jump on a ChartSchool article in the making on the DecisionPoint Thrust/Trend Model. Although Carl and I retired it from the DecisionPoint Market/Sector Summary, it is still available in the DecisionPoint Market Indicator ChartPack (free download!).
The Thrust/Trend Model is...
READ MORE
MEMBERS ONLY
8 Risk Ratios to Watch - QQQ and IWM Hit Key Fib Retracement - Fed Talks and Bonds Balk
by Arthur Hill,
Chief Technical Strategist, TrendInvestorPro.com
Eight Risk Ratios to Watch // Replay of October Surge // SPY and the PPO Strategy // QQQ and IWM Trends Remain Mixed // Feds Talk and Bonds Balk // Oil Set to Test Breakout // Finance Stalls Near Key Retracement // Precious Metals Take a Hit // Vacation Notice ////
I am seeing a bit of deterioration in...
READ MORE
MEMBERS ONLY
S&P 500 Drops Most In Two Weeks, VIX Climbs
by Tom Bowley,
Chief Market Strategist, EarningsBeats.com
Market Recap for Wednesday, March 23, 2016
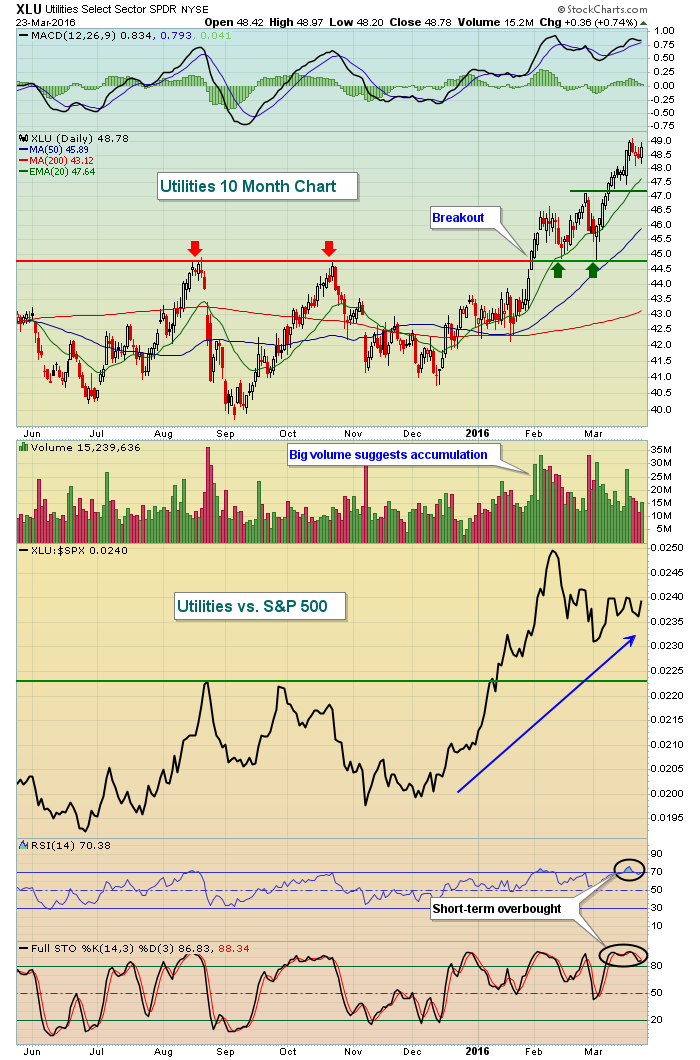
Energy (XLE) was under heavy selling pressure on Wednesday for the first time in two weeks and that sector was primarily responsible for the weakness in the S&P 500. Seven of nine sectors finished lower, however, as only the defensive utilities...
READ MORE
MEMBERS ONLY
Is This The Top Of The Rally Or A New Bull Market?

by Martin Pring,
President, Pring Research
* World indexes not yet above their 200-day MA’s
* USA indexes very overstretched short-term
* Two reliable primary trend indexes at make or break points
Three world equity indexes
StockCharts carries three stock market indexes measuring “The World”. All of them are overbought on a short-term basis, two are below their...
READ MORE
MEMBERS ONLY
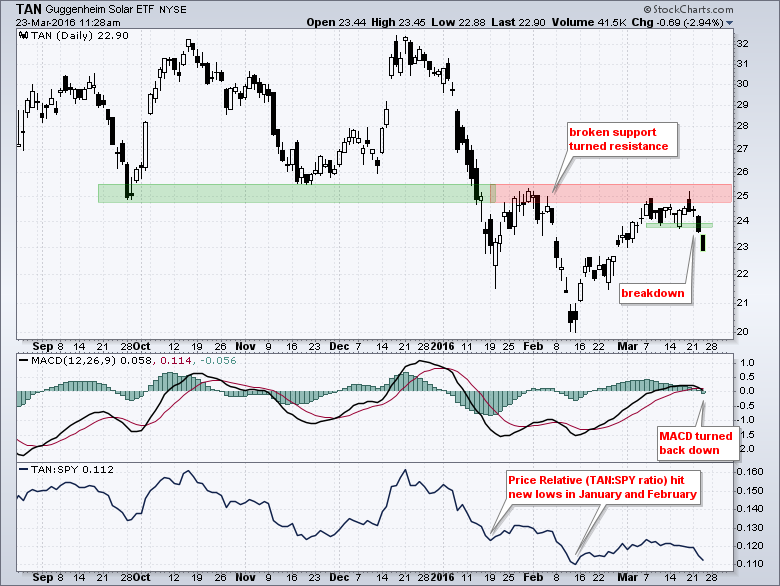
Solar ETF Reverses near Key Level as Momentum Turns
by Arthur Hill,
Chief Technical Strategist, TrendInvestorPro.com
The Solar Energy ETF (TAN) has been one of the weakest industry group ETFs over the past year and that looks set to continue with the recent breakdown. The chart shows TAN bouncing with the market from mid February to mid March and hitting resistance near broken support. This is...
READ MORE
MEMBERS ONLY
Bifurcated U.S. Market Shows Hesitation and Indecisiveness
by Tom Bowley,
Chief Market Strategist, EarningsBeats.com
Market Recap for Tuesday, March 22, 2016
The Dow Jones, S&P 500 and Russell 2000 all turned lower on Tuesday, but the NASDAQ managed to take over relative leadership and finish with fractional gains. Healthcare (XLV) has been the lagging sector over the past month, but led all...
READ MORE
MEMBERS ONLY
October Surge vs Current Surge - Volume Flows in SPY - Utilities and Staples Slack - Webinar Video
by Arthur Hill,
Chief Technical Strategist, TrendInvestorPro.com
Risk Indicators Remain Bullish // Comparing the Current Advance with October // Volume Flows Strong in SPY // Industrials and Technology Maintain Top Position // Utilities and Staples Start Slacking // Webinar Video ////
Risk Indicators Remain Bullish
There is not much change in the overall picture for the stock market - and the other markets...
READ MORE
MEMBERS ONLY

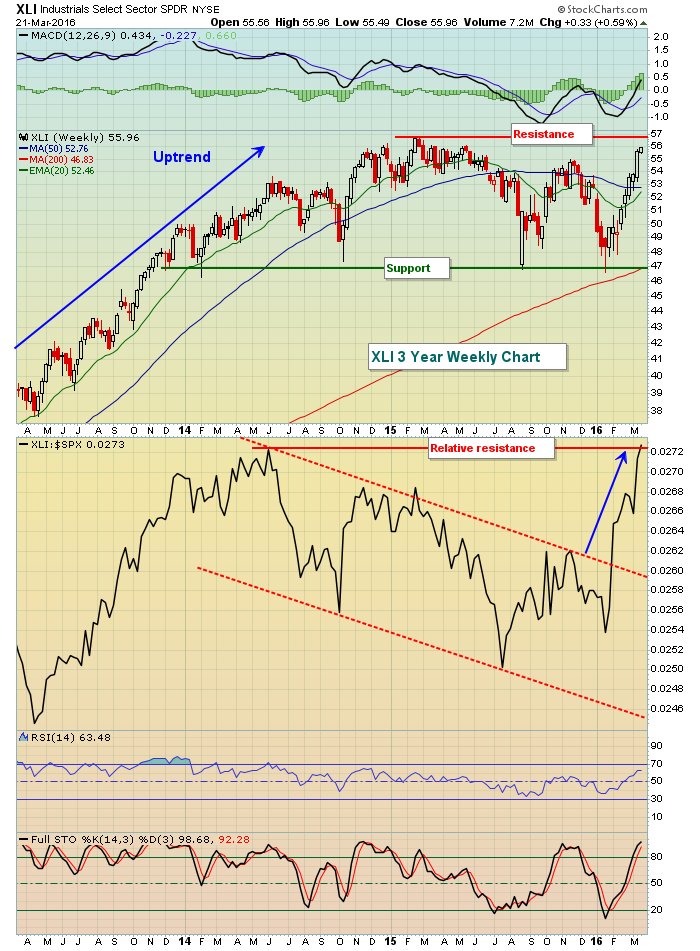
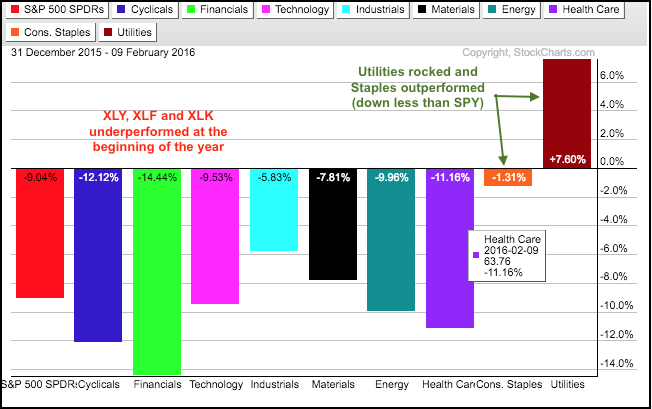
DEFENSIVE STOCKS LIKE STAPLES AND UTILITIES START TO LOSE LEADERSHIP ROLE -- INDUSTRIAL SPDR BULLISH BREAKOUT SHOWS NEW LEADERSHIP -- THAT'S USUALLY BEEN A GOOD SIGN FOR THE MARKET -- MATERIALS AND TECHNOLOGY SPDRS TEST FOURTH QUARTER HIGHS
by John Murphy,
Chief Technical Analyst, StockCharts.com
STAPLES START TO LOSE LEADERSHIP... Consumer staples were market leaders during December and January as the market started to weaken. That's normal. The daily bars in Chart 1 plot the Consumer Staples SPDR (XLP) along with the XLP/SPX relative strength ratio since last October. The XLP/SPX...
READ MORE
MEMBERS ONLY

Candlestick Analysis - Statistics I
by Greg Morris,
Veteran Technical Analyst, Investor, and Author
The candle pattern statistics in Table A below show the amount of data used in this analysis, the type of data used, and various other pertinent statistics. All common stocks on the New York Stock Exchange, the Nasdaq market, and the American Stock Exchange were used over a 13-year period....
READ MORE
MEMBERS ONLY
Footwear Makes Bullish Breakout; Broadline Retailers Make Kick Save
by Tom Bowley,
Chief Market Strategist, EarningsBeats.com
Market Recap for Monday, March 21, 2016
It was another day of mostly higher prices, albeit gains were modest. That's the hallmark of a bull market - day after day of almost boring gains where bears cannot gain any traction whatsoever. If there's one thing that...
READ MORE
MEMBERS ONLY
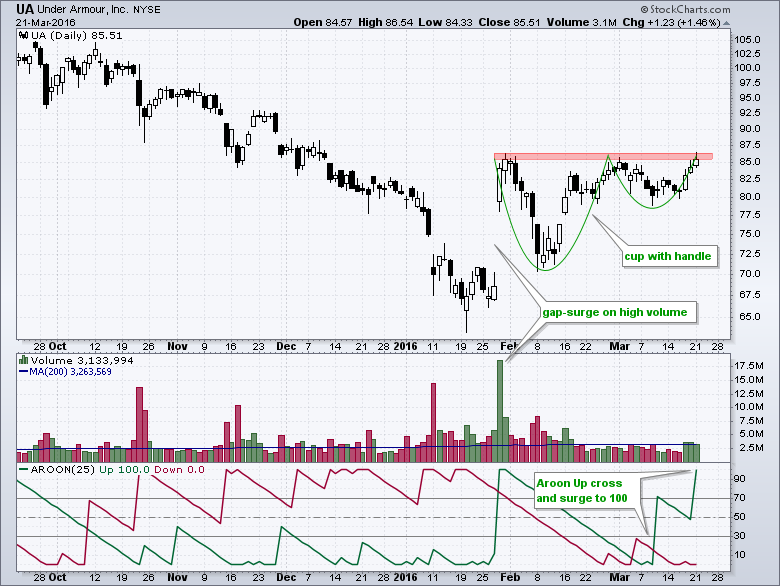
Under Armour Traces out Bullish Continuation Pattern
by Arthur Hill,
Chief Technical Strategist, TrendInvestorPro.com
UA is attracting buying interest as March madness moves to the sweet sixteen. Note that UA sponsored 10 teams at the start of the tournament, including Utah and Notre Dame. On the price chart, the stock has a bullish cup-with-handle pattern taking shape. This is a continuation pattern and a...
READ MORE
MEMBERS ONLY
The Great Rotation of 2016 - Finance Correlations to Watch - REITS Lead RYF - Uptrends for 6 Big Banks
by Arthur Hill,
Chief Technical Strategist, TrendInvestorPro.com
The Great Rotation of 2016 // Finance Sector Correlations to Watch // Wedge Continues to Rise for 10-yr Yield // Big Banks Make-or-break XLF // REITs and Insurance Power RYF // Breakouts and Uptrends for 6 Big Banks ////
The Great Rotation of 2016
It has been a tale of two markets in 2016. The first...
READ MORE
MEMBERS ONLY

Small Caps And Healthcare Lead On Friday
by Tom Bowley,
Chief Market Strategist, EarningsBeats.com
Market Recap for Friday, March 18, 2016
The Russell 2000 ($RUT) gained 0.95% on Friday and easily outpaced our other major indices. It also closed back above 1100 for the first time since closing below that number on January 6th. Given the successful tests of the rising 20 day...
READ MORE
MEMBERS ONLY
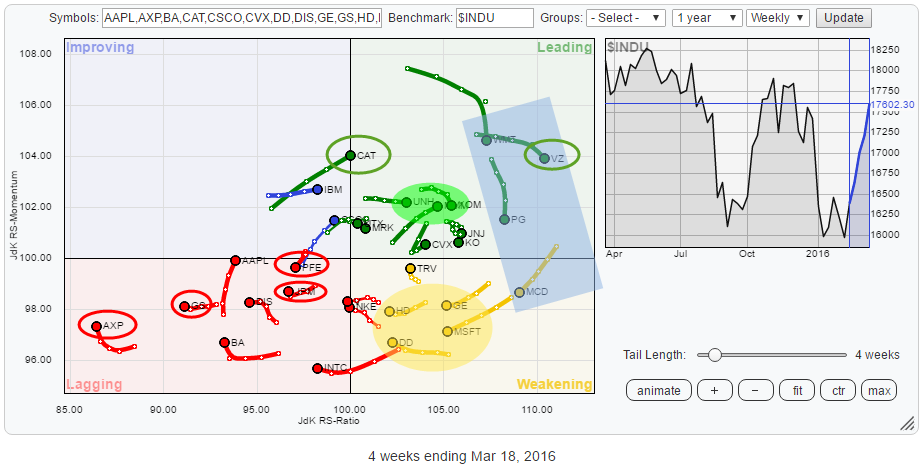
Weak relative rotation for PFE, CAT expected to keep on truckin'
by Julius de Kempenaer,
Senior Technical Analyst, StockCharts.com
The Relative Rotation Graph above holds the 30 stocks that make up the Dow Jones Industrials Index ($INDU). The rotational patterns of the individual stocks vary widely. The RRG shows you where the opportunities are but, maybe even more important, also shows you the threats.
Summary
* VZ leads the (relative)...
READ MORE
MEMBERS ONLY
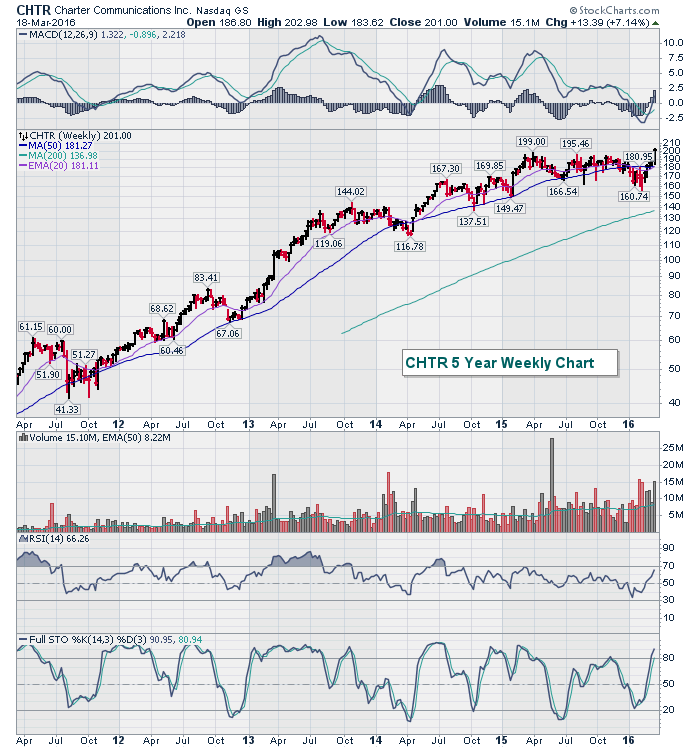
Charter Communications (CHTR) Makes The Breakout
by Tom Bowley,
Chief Market Strategist, EarningsBeats.com
Despite all the market volatility and weakness over the past year, CHTR has held steady in its uptrend and has been consolidating throughout. It was awaiting a heavy volume breakout, but it's waiting no more. More than 15 million shares changed hands last week as CHTR closed above...
READ MORE
MEMBERS ONLY
House of Cards and the 50-50-90 Rule
by Carl Swenlin,
President and Founder, DecisionPoint.com
While watching the fourth season of House of Cards I have been reminded of the 50-50-90 rule: Anytime you have a 50-50 chance of getting something right, there's a 90% probability you'll get it wrong. House of Cards is a Netflix series depicting political intrigue and...
READ MORE
MEMBERS ONLY
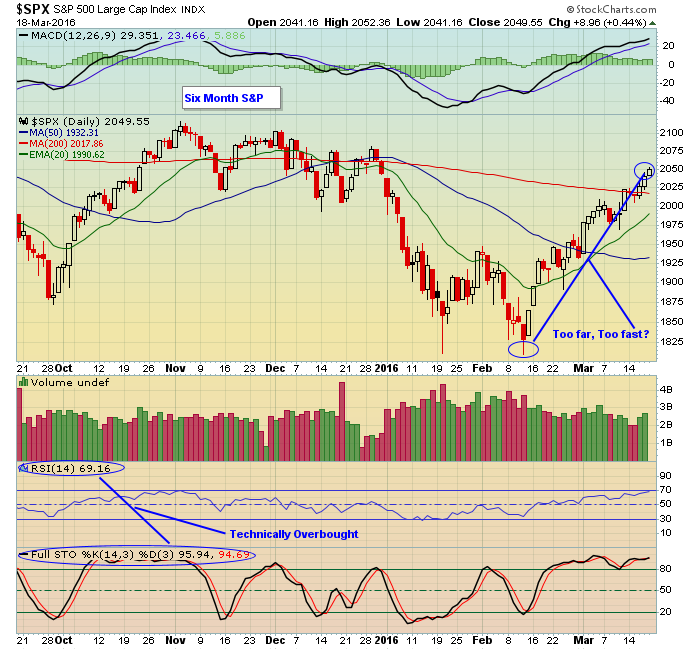
A Set up for Shorts?

by John Hopkins,
President and Co-founder, EarningsBeats.com
The market has been pretty much straight up since the February 11 bottom of 1810. Since that day the S&P has climbed 13%. That's a very impressive move by any measurement. In fact, I would argue that it has been too much too quick.
Look at...
READ MORE
MEMBERS ONLY
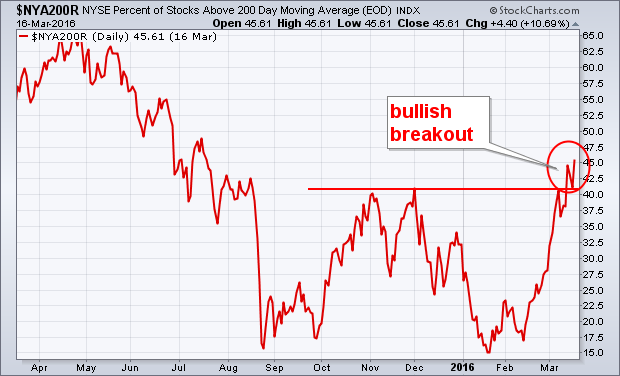
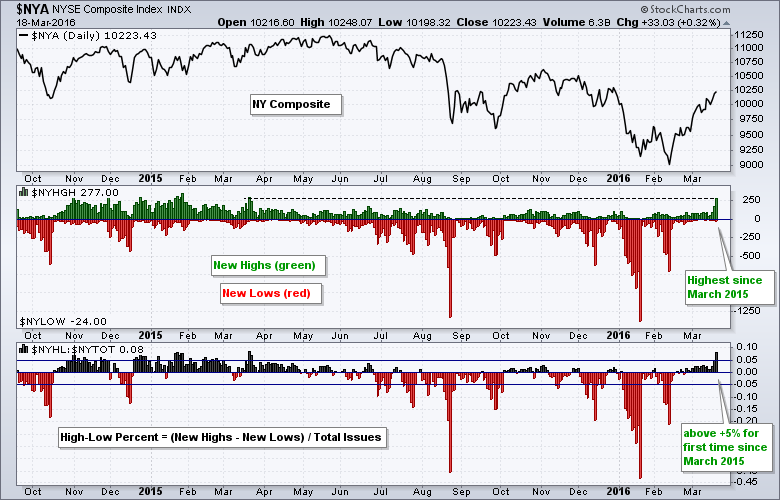
NYSE Percent Above 200MA Turns Up, AD Line Breaks Out
by John Murphy,
Chief Technical Analyst, StockCharts.com
NYSE PERCENT OF STOCKS ABOVE 200-DAY MOVING AVERAGE TURNS UP... The previous Wedneday's message showed the % of NYSE stocks trading above their 200-day moving average moving up to challenge its fourth quarter high around 40% (after bottoming in January in oversold territory below 20%). Chart 9 shows the...
READ MORE
MEMBERS ONLY
Healthcare Sector Not so Healthy
by Erin Swenlin,
Vice President, DecisionPoint.com
All of the sectors on the DecisionPoint Market Sector Summary are green with Intermediate-Term Trend Model BUY signals...except for Healthcare. As you can see from the excerpt of the report below, the current Neutral signal has been in effect for over two months. I decided it was time to...
READ MORE
MEMBERS ONLY
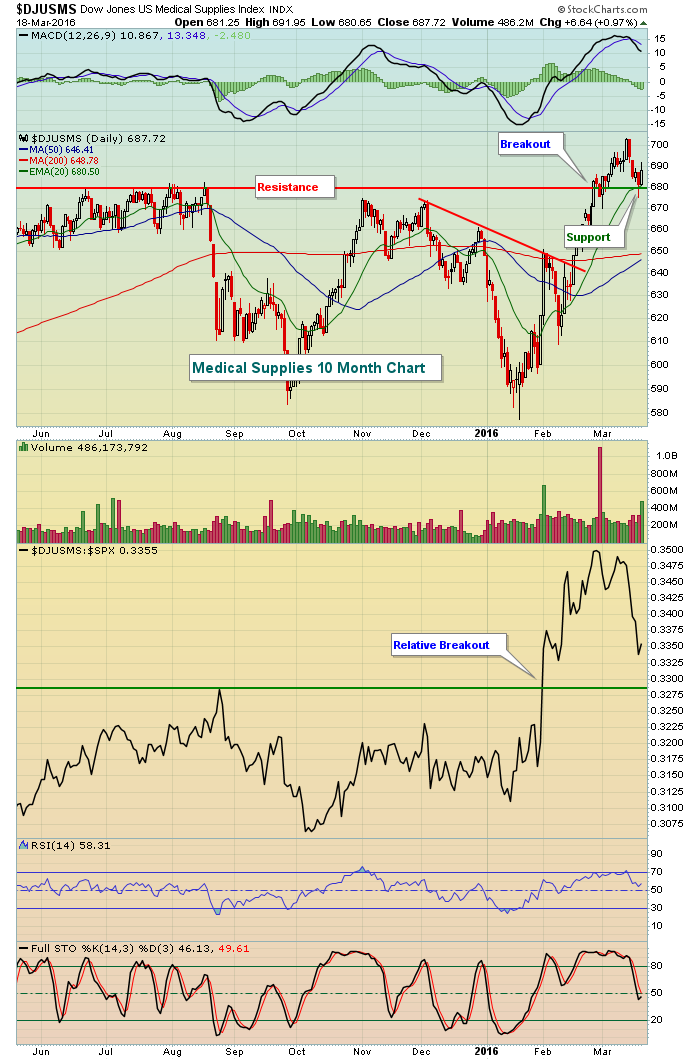
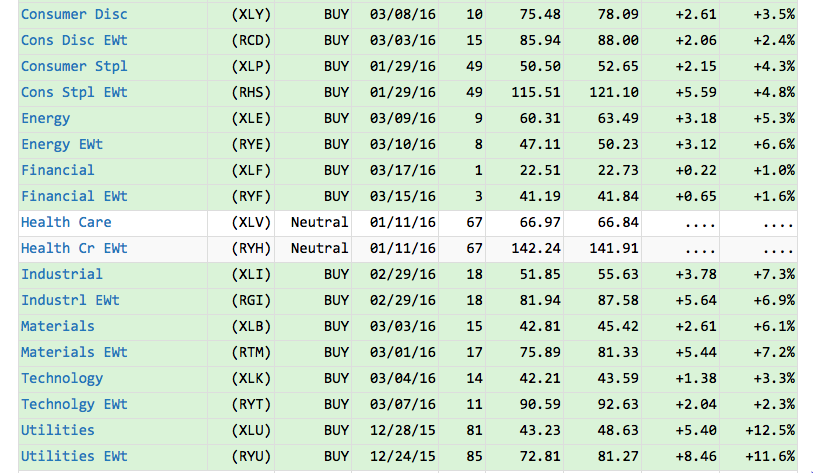
Medical Supplies Group Bounces At Key Moving Average Support
by Tom Bowley,
Chief Market Strategist, EarningsBeats.com
Healthcare (XLV) has been the weakest sector over the past one and three month periods, but you'd never know it from looking at the Dow Jones U.S. Medical Supplies Index ($DJUSMS). The DJUSMS has gained over 8% during the past three months while the Dow Jones U....
READ MORE
MEMBERS ONLY
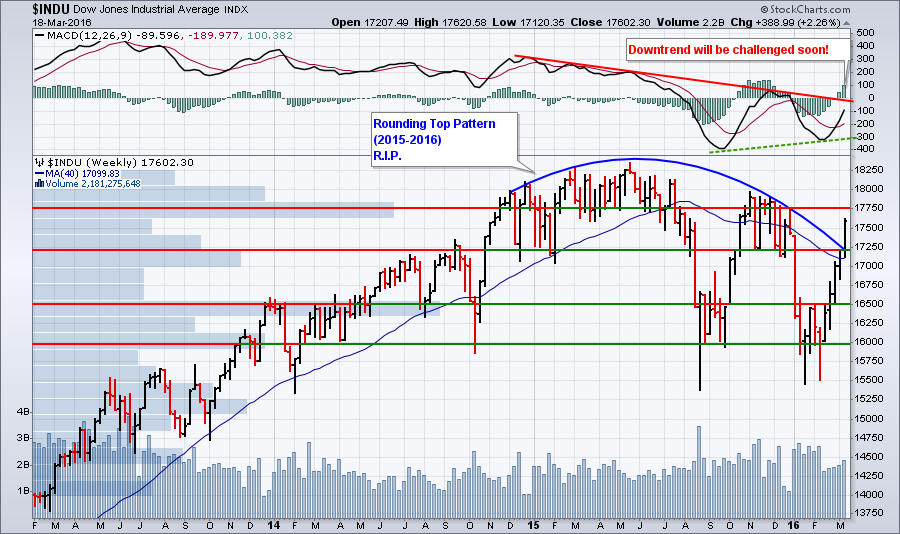
There's No Such Thing as "Overbought"
Hello Fellow ChartWatchers!
Well, I don't know about you, but I'm impressed. Last week, the current rally moved higher and gained more momentum. After briefly (very briefly) pausing at its 200-day moving average, the Dow surged higher and obliterated the rounding-top concept I've talked...
READ MORE
MEMBERS ONLY
New Highs Surge on NYSE, but Lag on Nasdaq
by Arthur Hill,
Chief Technical Strategist, TrendInvestorPro.com
Two weeks ago I featured the NYSE McClellan Oscillator ($NYMO) and the Nasdaq McClellan Oscillator ($NAMO) as they surged to their highest levels in years. These breadth indicators are very broad and represent virtually all stocks traded in the US. Big moves in both breadth indicators signaled a bullish breadth...
READ MORE
MEMBERS ONLY

Distribution Power Waves

by Bruce Fraser,
Industry-leading "Wyckoffian"
In the prior post we introduced the study of comparative waves of buying and selling. By judging the relative power of adjacent waves of buying and selling one can discern emerging strength, or weakness in the stock’s structure. The change in the power of rally waves and selling waves...
READ MORE
