MEMBERS ONLY
The Most Profitable Correlation in the Stock Market

by Gatis Roze,
Author, "Tensile Trading"
Whether it’s life or investing, if you ignore the reality of correlations – be they positive or negative – you are literally engaged in paradigm shifting. This is the equivalent of trying to put the milk back into the cow.
We all witness examples of positive correlations in our daily lives....
READ MORE
MEMBERS ONLY
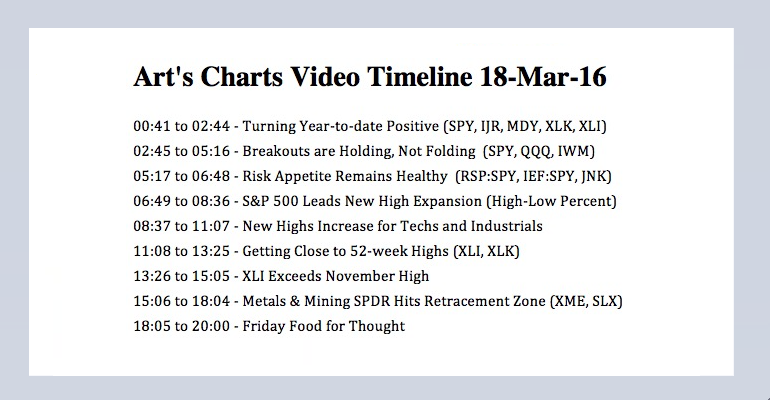
Breakouts Hold, Not Fold - Risk Indicators Go Big - New Highs Expand - XLI and XLK Lead - Food for Thought

by Arthur Hill,
Chief Technical Strategist, TrendInvestorPro.com
Turning Year-to-date Positive // Breakouts are Holding, Not Folding // Risk Appetite Remains Healthy // S&P 500 Leads New High Expansion // New Highs Increase for Techs and Industrials // Getting Close to More 52-week Highs // XLI Exceeds November High // Metals & Mining SPDR Hits Retracement Zone // Friday Food for Thought ////
Turning Year-to-date...
READ MORE
MEMBERS ONLY
Quad Witching Season: Here's What Usually Happens

by Tom Bowley,
Chief Market Strategist, EarningsBeats.com
Market Recap for Thursday, March 17, 2016
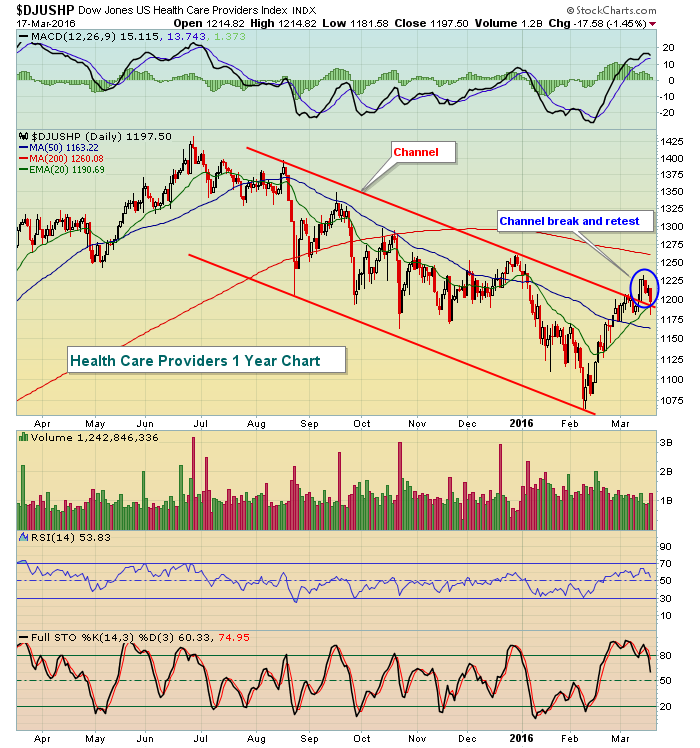
All of our major indices continued their five week advance with one notable exception - the NASDAQ 100 ($NDX), which fell slightly despite strong gains elsewhere. In particular, healthcare stocks (XLV) were weak with the XLV the only sector in negative territory, falling...
READ MORE
MEMBERS ONLY

Bear Market PMO Scan Screens a Few "Dogs"

by Erin Swenlin,
Vice President, DecisionPoint.com
With the market overbought and ready for at least a pullback, I decided to run one of my bear market Price Momentum Oscillator (PMO) scans to see if I could find a few "dogs" out there. The scan produced a handful for review but the two below stood...
READ MORE
MEMBERS ONLY

World Stock ETF Rallies Back To Its Bear Market Trendline And 200-day MA. Is The Bear Market Over?

by Martin Pring,
President, Pring Research
* World markets are just below key resistance
* Junk bonds break through their 200-day MA. Will the break hold?
* World Bond Index breaks to the upside
Last week I called for some corrective action in the US equity market based on what, at the time, appeared to be a couple of...
READ MORE
MEMBERS ONLY
Has Big Blue (IBM) Bottomed?
by Tom Bowley,
Chief Market Strategist, EarningsBeats.com
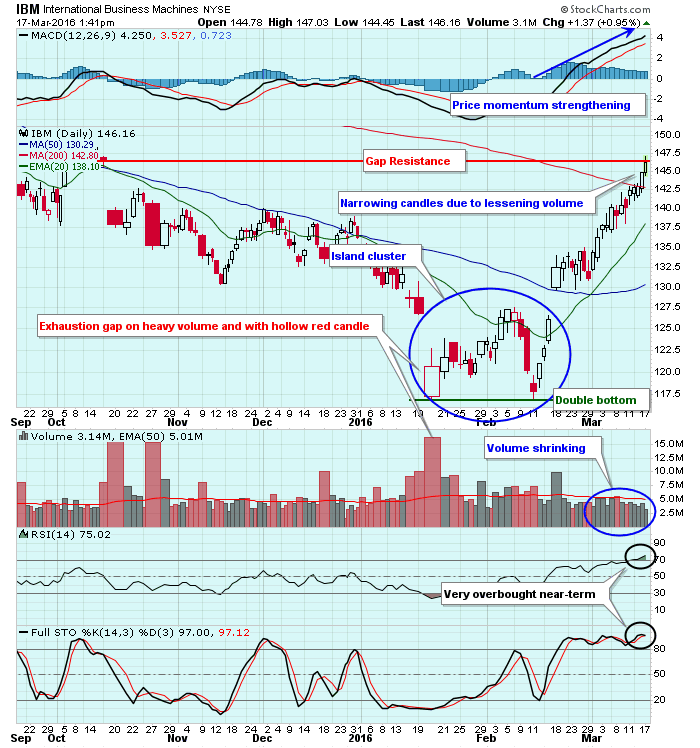
IBM had been under intense selling pressure and had lost more than 40% of its market cap from its March 2013 high to its early 2016 double bottom low near 117.00. Was that enough? Has it bottomed? Well, there was an exhaustion gap in mid-January followed by a double...
READ MORE
MEMBERS ONLY

COMMODITIES CONTINUE TO RALLY ON FALLING DOLLAR AND DOVISH FED -- SILVER WHEATON LEADS SILVER ETF HIGHER -- SOUTHERN COPPER CLEARS 200-DAY LINE -- FEDEX AND DOW TRANSPORTS CLEAR 200-DAY LINES

by John Murphy,
Chief Technical Analyst, StockCharts.com
U.S. DOLLAR FALLS TO FIVE-MONTH LOW ... Yesterday's dovish statement from the Fed that it was scaling back plans to raise short-term rates had the dual effect of pushing interest rates and the dollar lower. Chart 1 shows the Power Shares Dollar Index (UUP) falling to the lowest...
READ MORE
MEMBERS ONLY
SPY Leads - The 1-2 Breadth Punch - Healthcare Breaks - Gold and Silver Affirm Support
by Arthur Hill,
Chief Technical Strategist, TrendInvestorPro.com
SPY Leads Market Higher // The One-Two Breadth Punch // Surging within a Big Range // Marking a Reversal Zone for a Pullback // Healthcare Breaks Down as Finance Stalls // Gold and Silver Affirm Support Levels // Crude Holds Double Bottom Breakout ////
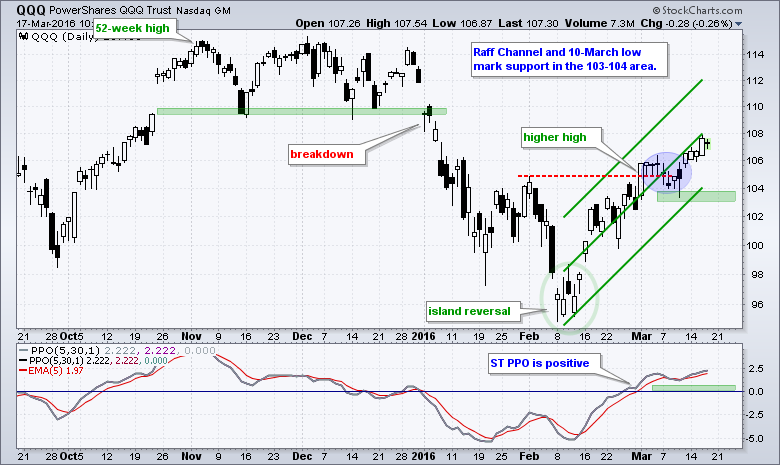
QQQ led the big three with the biggest gain on Wednesday and the...
READ MORE
MEMBERS ONLY
Treasuries And S&P 500 Diverge On FOMC Announcement
by Tom Bowley,
Chief Market Strategist, EarningsBeats.com
Market Recap for Wednesday, March 16, 2016
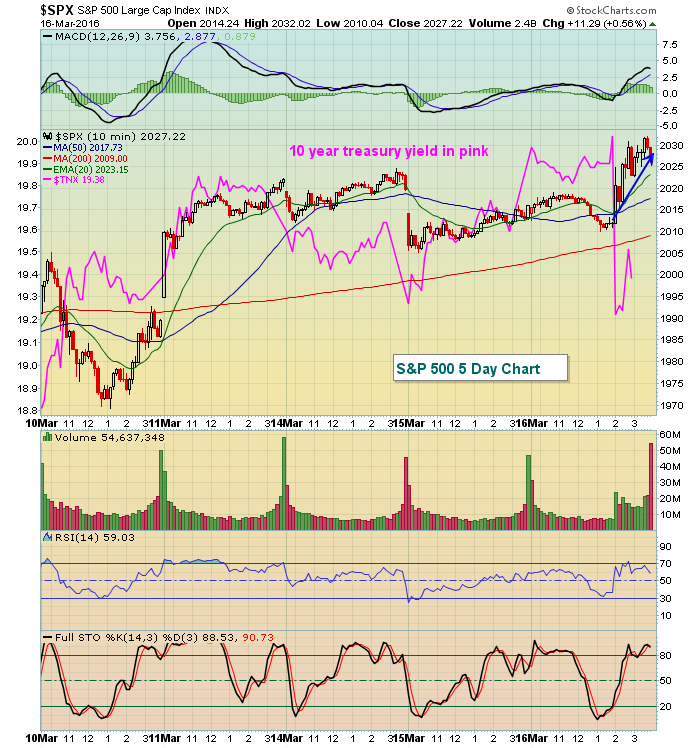
Energy (XLE) closed at more than a three month high on Wednesday, gaining 1.73% on the session to lead all sectors. Utilities (XLU) were a strong second as they climbed 1.53%. The XLU clearly benefited from the reaction in treasuries to...
READ MORE
MEMBERS ONLY

FED TAKES MORE DOVISH TONE ON RATE HIKES -- SHORTER RATES LEAD YIELDS LOWER -- TIPS REBOUND ON INCREASED INFLATION EXPECTATIONS -- DROP IN DOLLAR BOOSTS COMMODITIES -- CANADIAN DOLLAR CLEARS 200-DAY LINE -- S&P 500 EXTENDS GAIN OVER 200-DAY AVERAGE
by John Murphy,
Chief Technical Analyst, StockCharts.com
FED SCALES BACKS 2016 RATE CUTS... The Fed left rates unchanged as expected. However, it also scaled back any potential rate hikes for this year. Previous estimates of three or four possible hikes were lowered to two. It also sounded more cautious on the global economy. Initial market reactions were...
READ MORE
MEMBERS ONLY
S&P 500 Seasonal Patterns Remain Bullish
by Arthur Hill,
Chief Technical Strategist, TrendInvestorPro.com
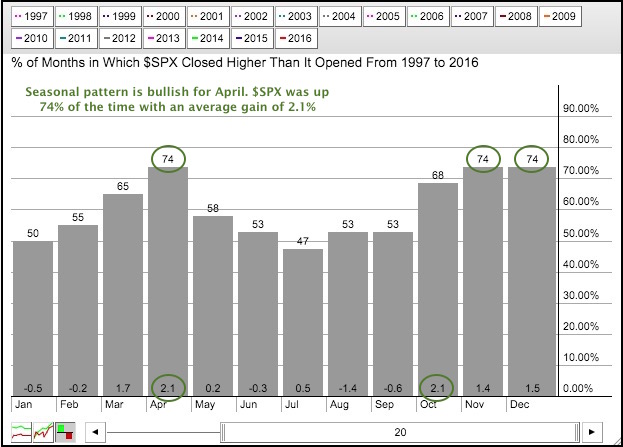
The chart below shows the seasonal patterns for the S&P 500 over the last twenty years. The bars show the percent of months that the S&P 500 closed positive and the numbers at the bottom show the average change. Three months stand out from the rest:...
READ MORE
MEMBERS ONLY

Are Mutual Fund Statistics in the Dark Ages?

by Greg Morris,
Veteran Technical Analyst, Investor, and Author
Since the dawning of the Internet in the early 1990s, investors now have access to volumes of data and statistics that were only reserved for a select group before. There are some things you need to know about financial data that is readily available for your use. There are some...
READ MORE
MEMBERS ONLY
Apple (AAPL) Testing Highs of 2016 As Technology Leads
by Tom Bowley,
Chief Market Strategist, EarningsBeats.com
Market Recap for Tuesday, March 15, 2016
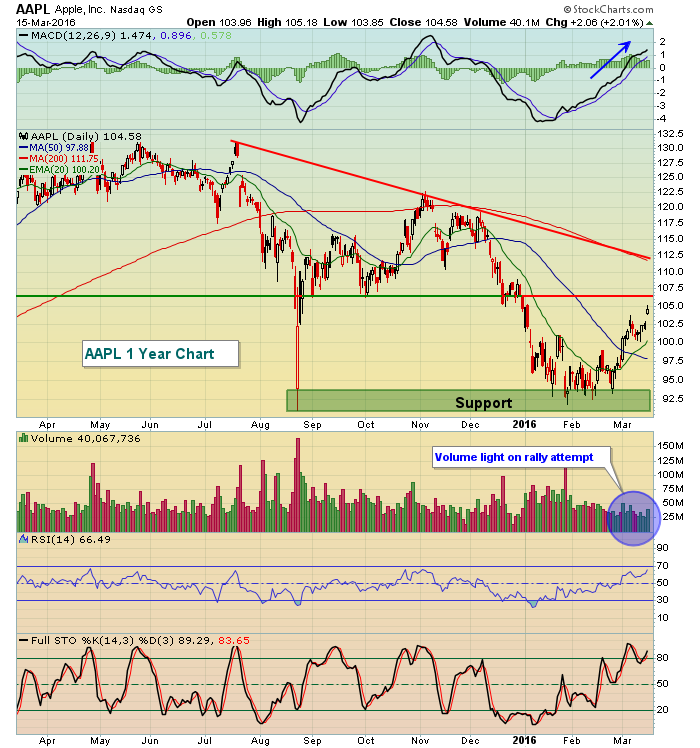
Apple (AAPL) resumed its upward climb on Tuesday, breaking to its highest close since the first trading day of 2016. AAPL's strength led computer hardware ($DJUSCR) to outsized gains of 1.42%, technology (XLK) to the best finish among sectors and...
READ MORE
MEMBERS ONLY
Financial Sector Lagging - Review of Deutsche Bank (DB), Equal-Weight ETF (RYF) and SPDR (XLF)
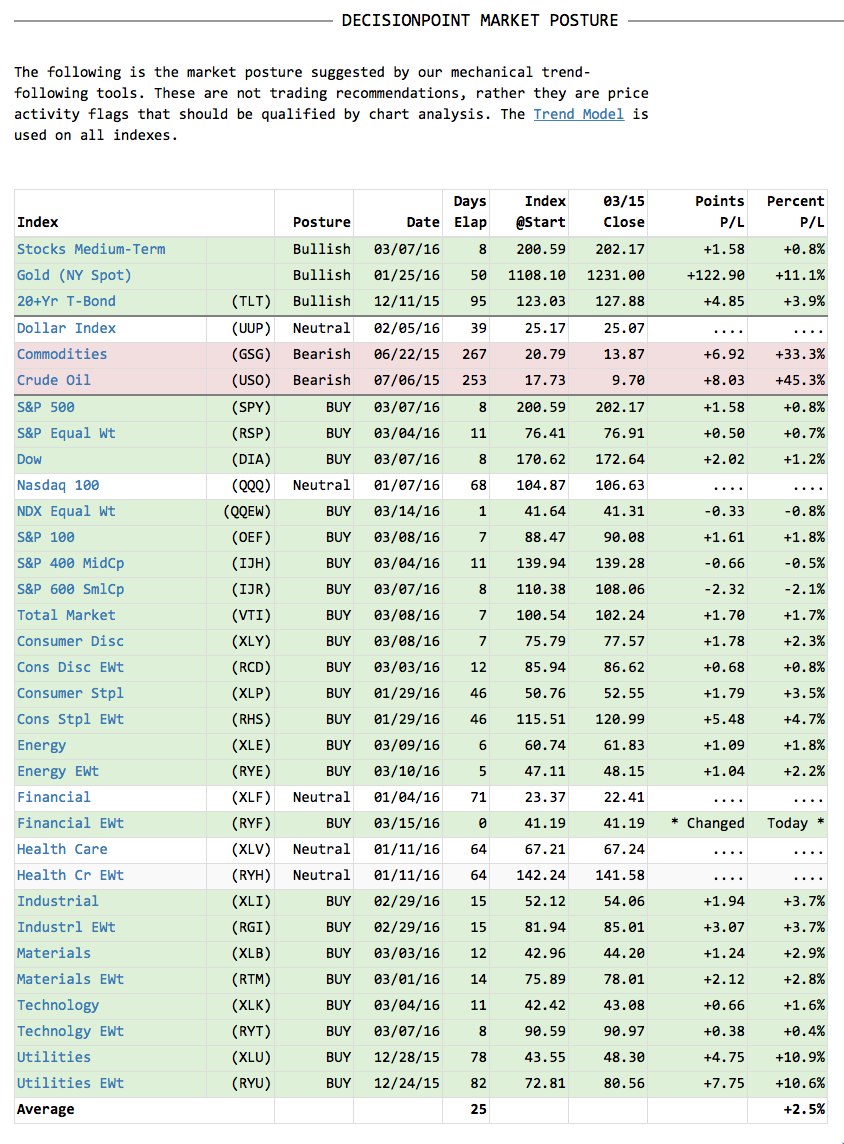
by Erin Swenlin,
Vice President, DecisionPoint.com
A reader and viewer emailed me and asked me to take a look at Deutsche Bank (DB). While I normally don't do specific chart reviews as part of my blogs or webinars, today we received a new Intermediate-Term Trend Model (ITTM) BUY signal on the equal-weight Financial ETF...
READ MORE
MEMBERS ONLY
Risk Indicators Still Bullish - Tech and Industrials Counter Finance and Healthcare - Webinar Video
by Arthur Hill,
Chief Technical Strategist, TrendInvestorPro.com
Risk Indicators Still Bullish // SPY Leads with Strongest Short-term Uptrend // Energy, Finance and Healthcare are the Laggards // Consumer Discretionary SPDR Holds Breakout // Industrials SPDR Nears Prior High // Webinar Preview ////
Risk Indicators Still Bullish
The financial markets still have a good appetite for risk and this is bullish for stocks. The...
READ MORE
MEMBERS ONLY
Market Flat But Bulls Find Comfort In Hotels
by Tom Bowley,
Chief Market Strategist, EarningsBeats.com
Market Recap for Monday, March 14, 2016
There was weakness during the first 15 minutes of trading on Monday, then again during the last 15 minutes of trading. Prices meandered higher throughout much of the remaining session, however, and left our major indices bifurcated by the close. The Dow Jones...
READ MORE
MEMBERS ONLY
Technology SPDR Becomes a Leader
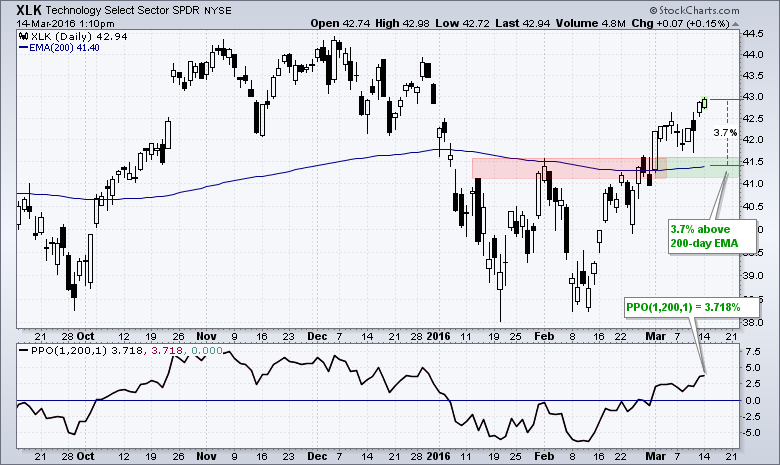
by Arthur Hill,
Chief Technical Strategist, TrendInvestorPro.com
Chartists can measure relative performance by comparing the price to a moving average. In particular, I am going to measure the percentage above or below the 200-day EMA using the Percentage Price Oscillator (PPO). The PPO (1,200,1) measures the percentage difference between the 200-day EMA and the current...
READ MORE
MEMBERS ONLY
S&P 500 Closes At Highest Level Of 2016 As Energy and Financials Lead
by Tom Bowley,
Chief Market Strategist, EarningsBeats.com
Special Note
In the Sector/Industry Watch section below, I highlight the historical and current February to April strength in the Exploration & Production ($DJUSOS) industry group within the energy sector (XLE). I plan to discuss how you can research historical strength by sector and industry group in my Trading...
READ MORE
MEMBERS ONLY
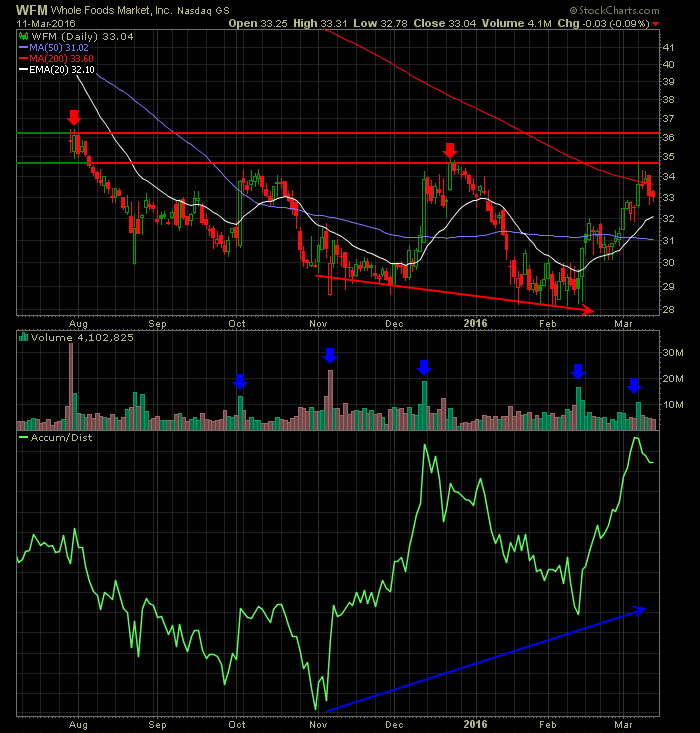
This Indicator Says Whole Foods (WFM) Is Under Accumulation
by Tom Bowley,
Chief Market Strategist, EarningsBeats.com
Whole Foods Market (WFM) has been trading in sideways fashion for the past several months and its long-term weekly chart isn't one of the strongest. But there are signs that better fundamental days lie ahead based on technical signs of accumulation. Below is a daily chart of the...
READ MORE
MEMBERS ONLY
SPY: Rising Wedge Delivers but Dissapoints

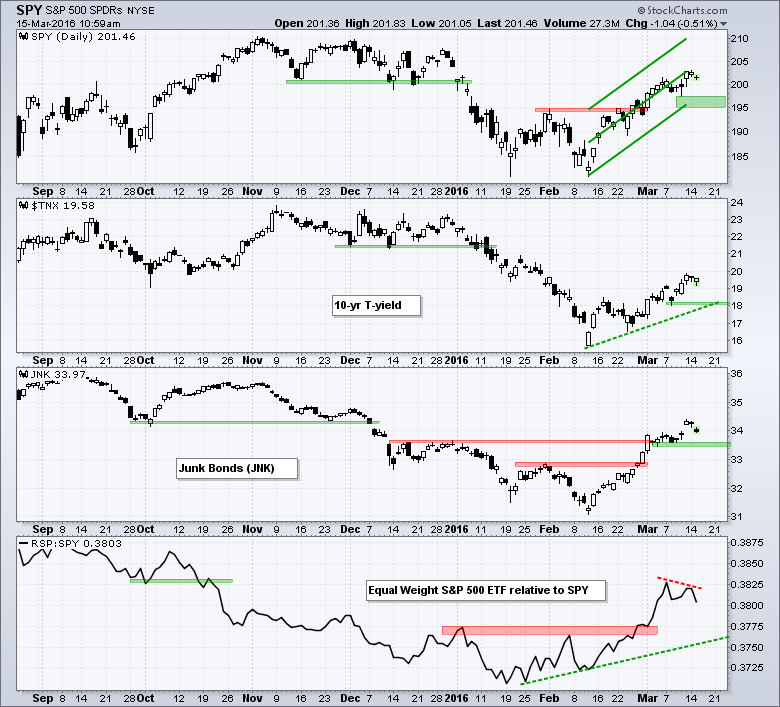
by Carl Swenlin,
President and Founder, DecisionPoint.com
One of my favorite chart patterns is the wedge -- rising or falling -- because it can usually be depended upon to resolve opposite the direction the wedge is moving. Specifically, a rising wedge will usually resolve downward and vice versa. Recently I saw some wedges developing on the SPY...
READ MORE
MEMBERS ONLY

Dow Leads the Way with First Intermediate-Term PMO BUY Signal on DP Scoreboards
by Erin Swenlin,
Vice President, DecisionPoint.com
Short-term and Intermediate-Term Trend Model BUY signals began appearing on the DecisionPoint Scoreboards this week. I suggested in a previous ChartWatchers article that these signals would be the first indication that the bear market may be coming to a close. I also wrote that the next step would be to...
READ MORE
MEMBERS ONLY

Judging Power Waves

by Bruce Fraser,
Industry-leading "Wyckoffian"
Determining the motives of the Composite Operator is the central mission of all Wyckoffians. There are numerous tools for this task. The present position and future trend of the market and the stocks within, are determined through the analysis of price and volume (‘the study of the tape’, Mr. Wyckoff...
READ MORE
MEMBERS ONLY
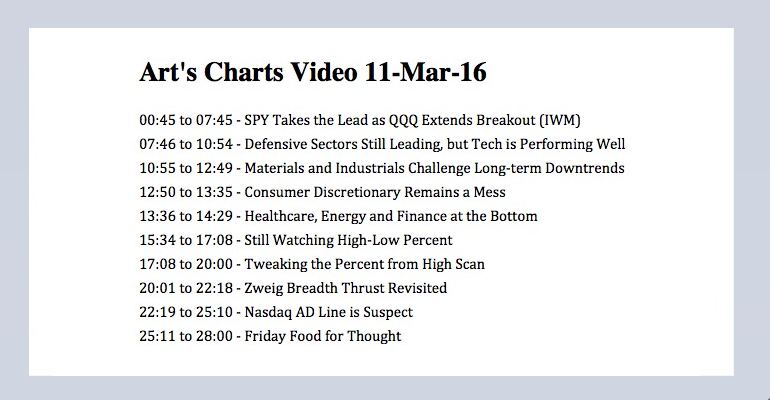
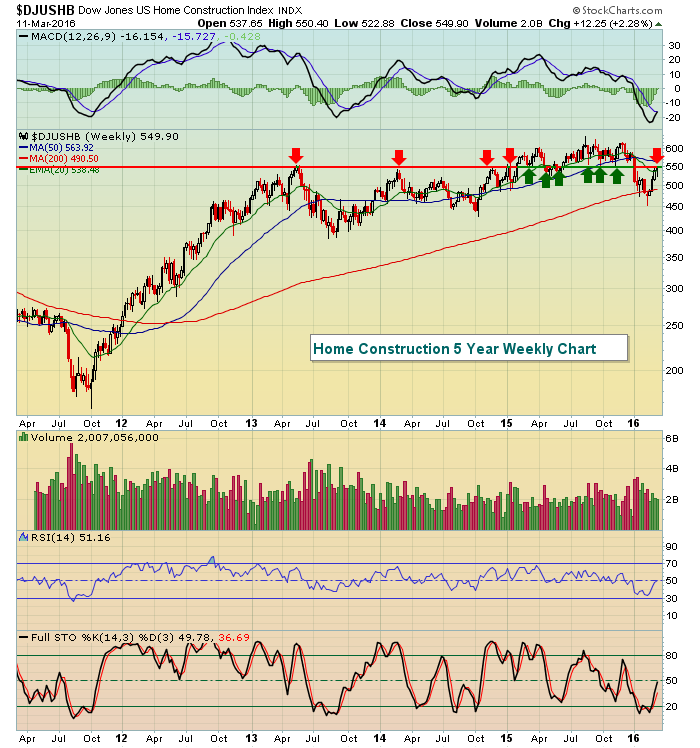
SPY Takes the Lead - XLK Performs Well - Revisiting the Zweig BT - Nasdaq AD Line is Suspect
by Arthur Hill,
Chief Technical Strategist, TrendInvestorPro.com
SPY Takes the Lead as QQQ Extends Breakout // Defensive Sectors Still Leading, but Tech is Performing Well // Materials and Industrials Challenge Long-term Downtrends // Consumer Discretionary Remains a Mess // Healthcare, Energy and Finance Round out the Bottom // Still Watching High-Low Percent // Tweaking the Percent from High Scan // Zweig Breadth Thrust Revisited...
READ MORE
MEMBERS ONLY

MATERIALS AND DISCRETIONARY SPDRS CLEAR 200-DAY AVERAGES -- CHEMICAL LEADERS ARE DOW, DUPONT, AND EASTMAN -- WHIRLPOOL EXCEEDS 200-DAY LINE -- BROADCOM AND ASML LEAD SEMICOMDUCTORS HIGHER -- CORPORATE BONDS JUMP AS TREASURIES SLIDE
by John Murphy,
Chief Technical Analyst, StockCharts.com
A LOT OF 200-DAY LINES ARE BEING TESTED OR EXCEEDED... Major stocks indexes in the U.S. are moving up to challenge their 200-day averages. Those are important tests because the 200-day line is the measure most used by chartists to distinguish uptrends from downtrends. A number of group indexes...
READ MORE
MEMBERS ONLY

The #1 Indicator Professionals Focus On
by Gatis Roze,
Author, "Tensile Trading"
A week doesn’t go by without some investor asking me “which one single indicator do you recommend above all others?” When I answer this question, the indicator I speak of is never the one they expect. The most important indicator – the one that will determine the majority of your...
READ MORE
MEMBERS ONLY
Battle Lines Are Drawn As Equity Markets Waffle
by Tom Bowley,
Chief Market Strategist, EarningsBeats.com
Market Recap for Thursday, March 10, 2016
We've had little economic news out this week so equity markets have been left to trade off technical indications. After the European Central Bank's (ECB) announcement of further quantitative measures triggered a very quick surge to the upside in...
READ MORE
MEMBERS ONLY
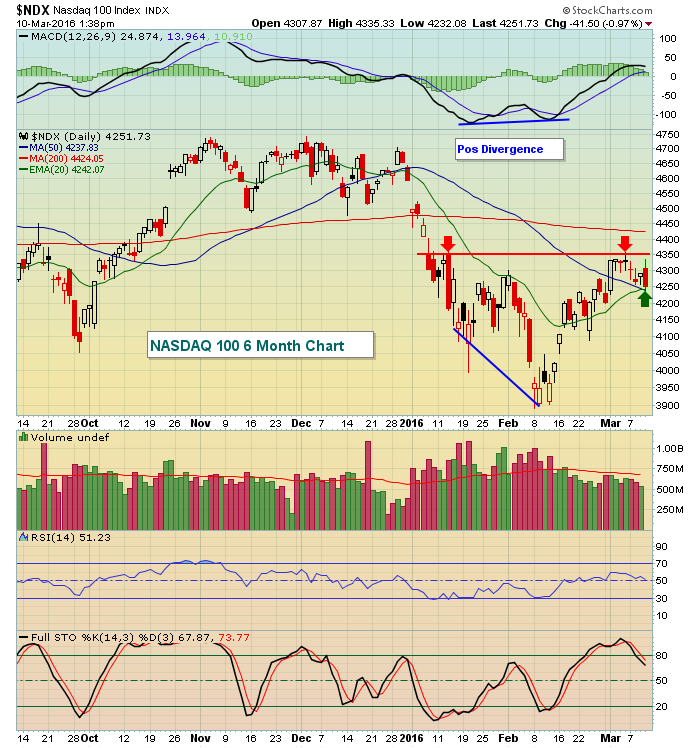
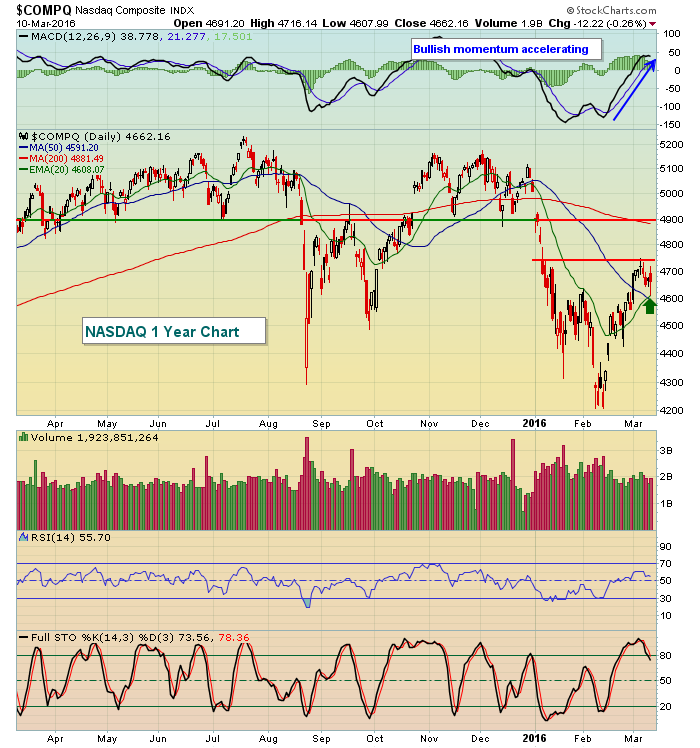
NASDAQ 100 Faces Major Support Test This Afternoon
by Tom Bowley,
Chief Market Strategist, EarningsBeats.com
The European Central Bank (ECB) announced its latest quantitative easing measures and though they initially moved global markets higher, the focus now seems to have turned to ECB President Draghi's comment that further interest rate cuts aren't likely. There is weakness across the board in the...
READ MORE
MEMBERS ONLY
S&P Battles 2K - ST Uptrends Hold - Yen Tests Support - 6 Stocks to Watch
by Arthur Hill,
Chief Technical Strategist, TrendInvestorPro.com
S&P 500 Battles 2K // Majority of Stocks above 200-day // Short-term Uptrends Hold // Watching Bonds and Yields Closely // Gold and the Yen // Three High and Tight Flags in Tech Sector // Stock Setups and Breakouts // CA, CSCO, DTLK, MSFT, ABBV and FRGI // //
S&P 500 Battles 2K
There is...
READ MORE
MEMBERS ONLY
The ECB Announces More QE, Global Markets Rally
by Tom Bowley,
Chief Market Strategist, EarningsBeats.com
Market Recap for Wednesday, March 9, 2016
Energy (XLE) was back in the driver's seat on Wednesday as the XLE climbed 1.62% to easily outperform the other eight sectors. Weakness in the dollar (UUP) has contributed to recent strength in commodities and after an early gap higher...
READ MORE
MEMBERS ONLY

PERCENT OF NYSE STOCKS ABOVE 50-DAY AVERAGE REACHES TWO-YEAR HIGH -- % OVER 200-DAY LINE TESTS FOURTH QUARTER HIGH -- NYSE ADVANCE-DECLINE LINE LOOKS STRONG -- NYSE BULLISH PERCENT INDEX CLEARS 50% -- BUYING OF CORPORATE AND JUNK BONDS SHOWS NEW OPTIMISM
by John Murphy,
Chief Technical Analyst, StockCharts.com
PERCENT OF NYSE STOCKS ABOVE 50-DAY AVERAGE REACHES TWO-YEAR HIGH... The debate continues about whether the stock market faces the likelihood of another downleg. Several technical indicators seem to suggest that a major selloff is unlikely. Here's the first one. I recently showed the NYSE percent of stocks...
READ MORE
MEMBERS ONLY
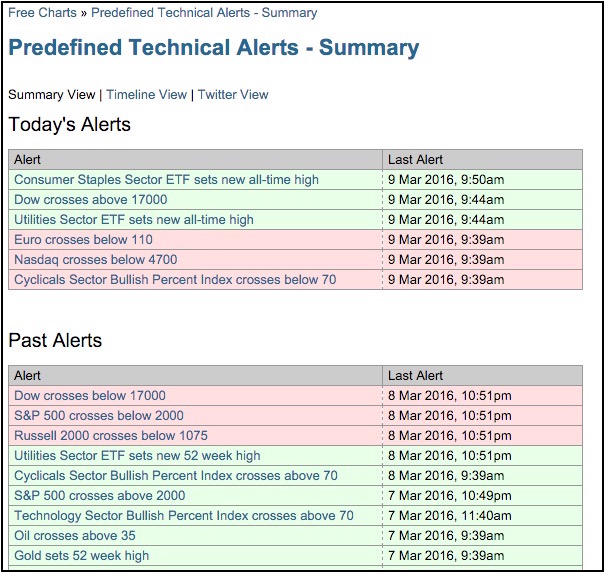
Consumer Staples and Utilities Pop Up on Technical Alerts Page
by Arthur Hill,
Chief Technical Strategist, TrendInvestorPro.com
Two of the nine sector SPDRs hit new 52-week highs today (March 9th) - and I bet you can figure out which ones. The image below comes from the pre-defined technical alerts page. Notice that we had three bullish alerts (green) and three bearish (red). The Consumer Staples SPDR (XLP)...
READ MORE
MEMBERS ONLY
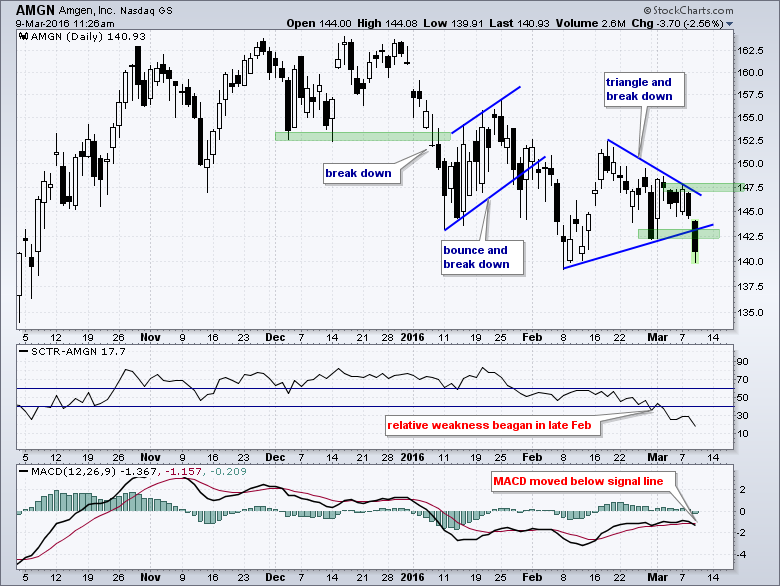
Relative Performance Breakdown Precedes Price Breakdown for Amgen
by Arthur Hill,
Chief Technical Strategist, TrendInvestorPro.com
The Biotech iShares (IBB) is one of the weakest industry group ETFs and the HealthCare SPDR (XLV) is one of the weakest sector SPDRs right now. Amgen is part of both and the stock broke down with a sharp decline the last two days. The price chart shows AMGN with...
READ MORE
MEMBERS ONLY
Candlestick Analysis - Recognition Reliability
by Greg Morris,
Veteran Technical Analyst, Investor, and Author
Using the pattern identification philosophy developed in the previous article on Pattern Identification, one can now adapt a method of determining just how successful candle patterns are? The techniques I used are quite analytical and I find they are somewhat difficult to explain, so here goes.
Measures of Success
The...
READ MORE
MEMBERS ONLY
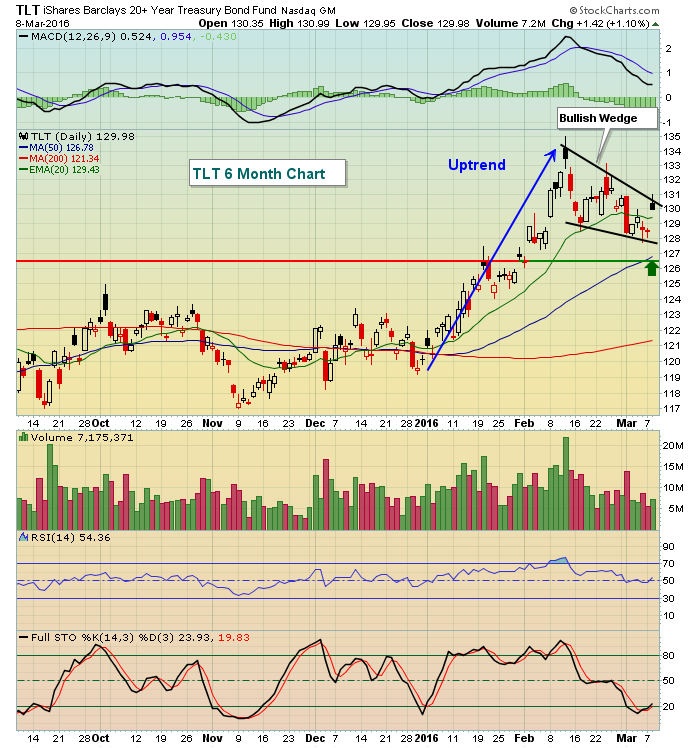
Treasuries And Utilities Lead On Tuesday To Begin Next Leg Lower?
by Tom Bowley,
Chief Market Strategist, EarningsBeats.com
Market Recap for Tuesday, March 8, 2016
Investors and traders turned to treasuries (TLT) and utilities (XLU) on Tuesday as money rotated back toward defense. The rally off the February 11th low has been characterized by rotation away from defense. It's not unusual to see selling accompanied by...
READ MORE
MEMBERS ONLY
Something cooking in commodities?

by Julius de Kempenaer,
Senior Technical Analyst, StockCharts.com
We live in interesting times... or maybe I should say: We live in confusing times.... Because, really, markets are throwing some serious curve balls here and there. It is time to look at some asset class rotations again.
The Relative Rotation Graph shows the rotation of a number of asset...
READ MORE
MEMBERS ONLY
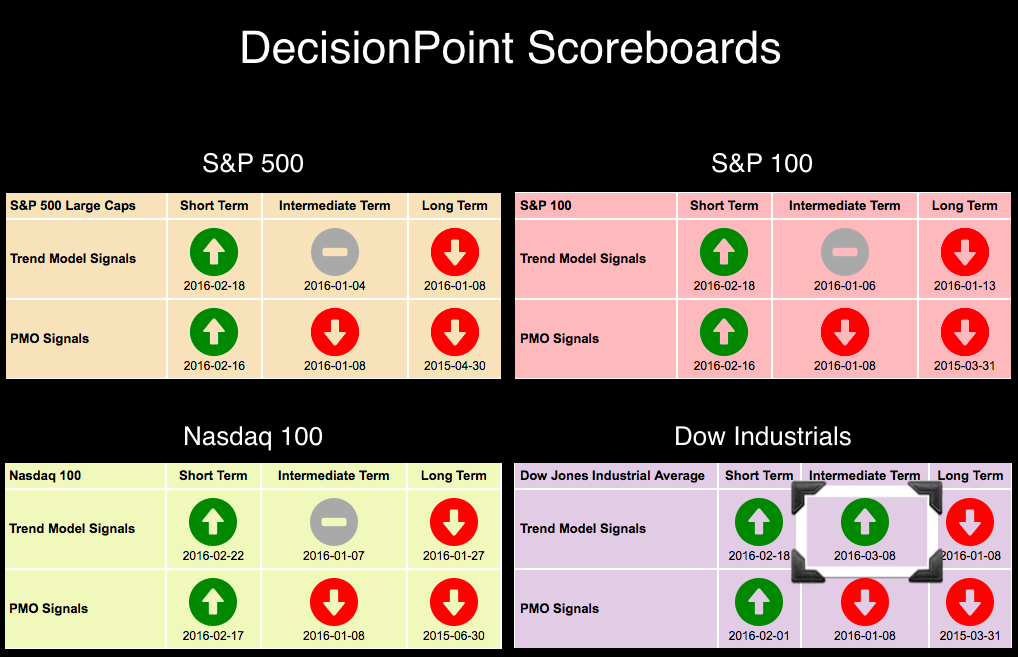
New! Intermediate-Term Trend Model BUY Signal on Dow
by Erin Swenlin,
Vice President, DecisionPoint.com
The DecisionPoint Scoreboards had a big change today, probably the first of a few more. The new Intermediate-Term Trend Model BUY signal for the Dow Industrials isn't necessarily a buying opportunity. With the recent rally, price has been trading well above the 50-EMA so consequently, the 20-EMA was...
READ MORE
MEMBERS ONLY

Contrarian Thinking Says The Equity, Oil And Junk Bonds Rally Is Over
by Martin Pring,
President, Pring Research
* Inflection point for junk bonds?
* Fake out rally a la 2008?
* Short-term oil rally over?
Inflection point for junk bonds?
It has been a feature of this bear market that stocks sell off in concert with junk bonds and oil prices as investors fret over potential energy company defaults. Not...
READ MORE
MEMBERS ONLY
Energy And Materials Hold Bears At Bay
by Tom Bowley,
Chief Market Strategist, EarningsBeats.com
Market Recap for Monday, March 7, 2016
Monday was a strange day. First, there was bifurcated action where most of our major indices were able to tack on additional gains despite huge gains over the past few weeks and overhead price resistance at hand. The gains weren't big...
READ MORE
MEMBERS ONLY
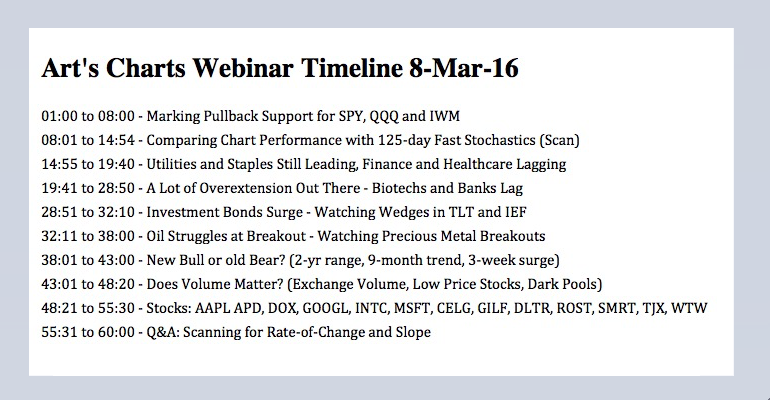
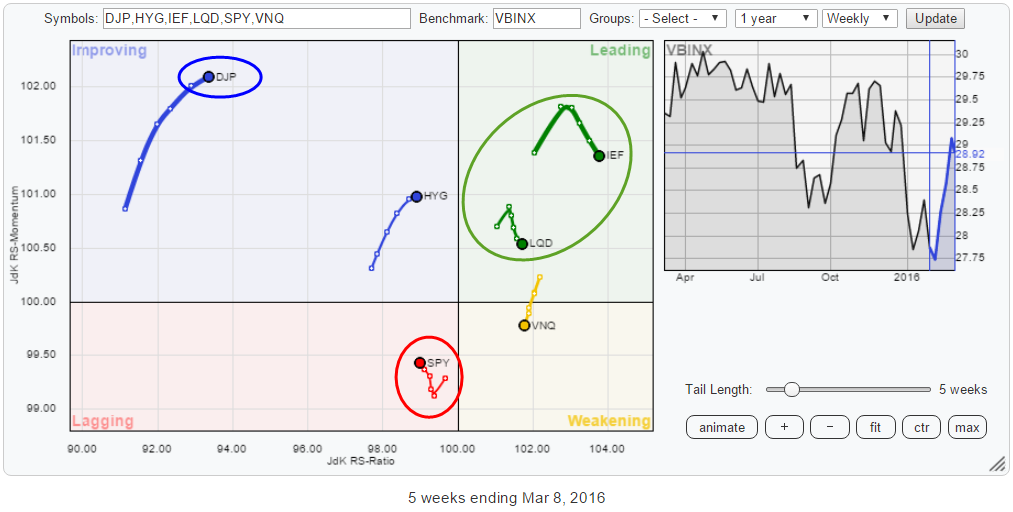
The Great Debate - Bond Trends Favorable for Stocks - Precious Metal Breakouts - Webinar Recording
by Arthur Hill,
Chief Technical Strategist, TrendInvestorPro.com
The Great Debate Rages // SPY Maintains Short-term Uptrend // QQQ Sputters // IWM Continues to Lead // Bond Trends Favor Stocks // April Crude Breaks Prior High // Gold, Platinum and Silver Hold Breakouts // Ranking the Sectors on 6-month Performance // XLU and XLP Still Leading // XLF and XLV Lagging // Webinar Preview ////
The Great Debate Rages...
READ MORE
MEMBERS ONLY
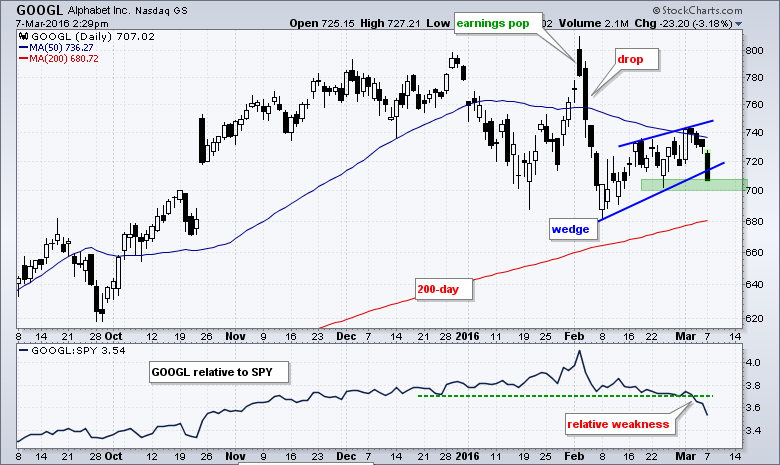
Alphabet Fails at Key Moving Average and Underperforms
by Arthur Hill,
Chief Technical Strategist, TrendInvestorPro.com
Alphabet (GOOGL) is weighing on the Nasdaq 100 ETF as it fails at the 50-day simple moving average and the price relative breaks down. The six month candlestick chart shows GOOGL surging to 800 after earnings and then immediately falling back below 700 in early February. The stock market got...
READ MORE