MEMBERS ONLY

MINERS HAVE ANOTHER BIG DAY -- ETFS TIED TO MINING AND PRECIOUS METALS CLEAR 200-DAY LINES -- STEEL STOCKS BENEFIT FROM RECORD JUMP IN IRON ORE -- ADD NUCOR TO LIST OF STEEL LEADERS -- PAN AMERICAN LEADS SILVER STOCKS HIGHER

by John Murphy,
Chief Technical Analyst, StockCharts.com
METALS AND MINING SPDR CLEARS 200-DAY AVERAGE ... Precious and base metal stocks are continuing their strong rally on the back of rising commodity prices. Chart 1 shows the S&P Metals and Mining SPDR (XME) trading above its 200-day average and at the highest level in five months. Its...
READ MORE
MEMBERS ONLY
It's A Fresh Trading Week, But The Problems Remain The Same

by Tom Bowley,
Chief Market Strategist, EarningsBeats.com
Market Recap for Friday, March 4, 2016
All of our major indices ended last week on a high note as U.S. stocks finished with more gains. There's been very solid index and sector rotation to support the recent bullish action and a renewed selling effort in treasuries...
READ MORE
MEMBERS ONLY
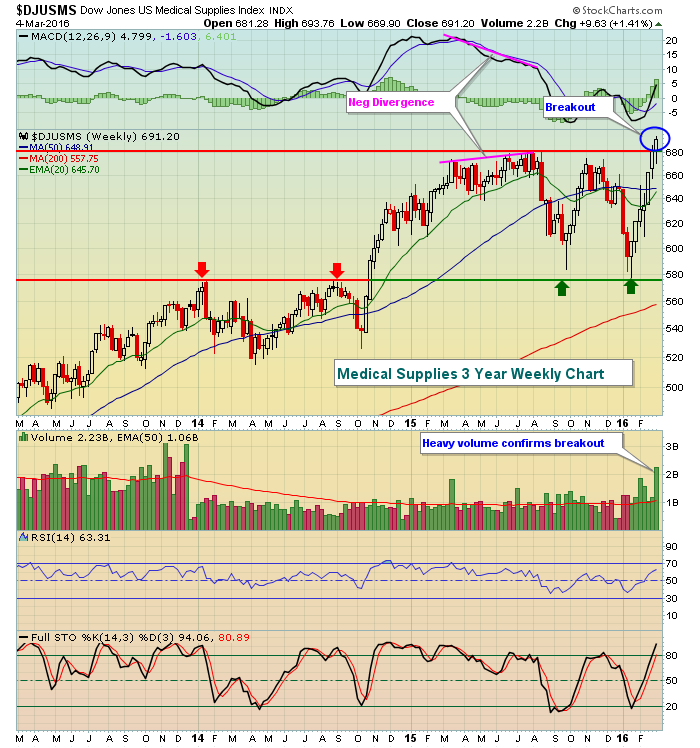
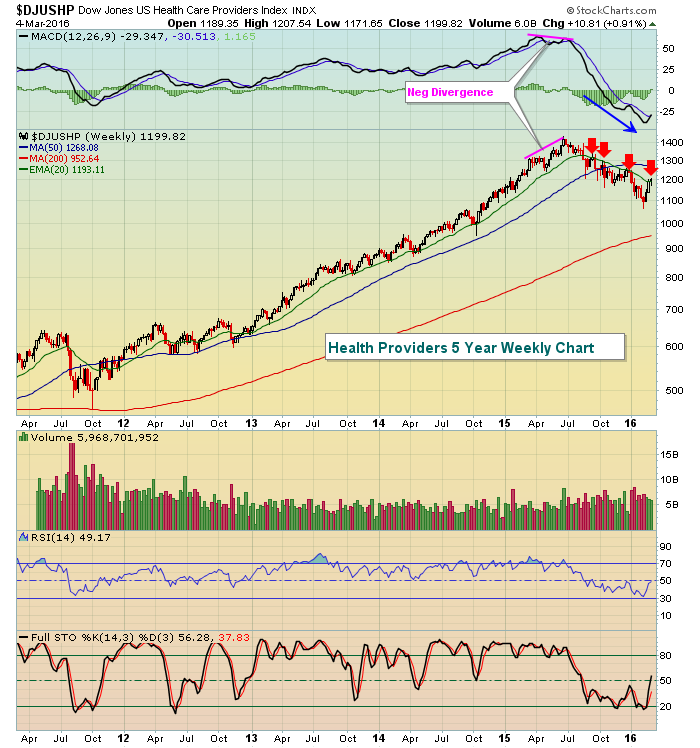
This Industry Group Has Broken To An All-Time High
by Tom Bowley,
Chief Market Strategist, EarningsBeats.com
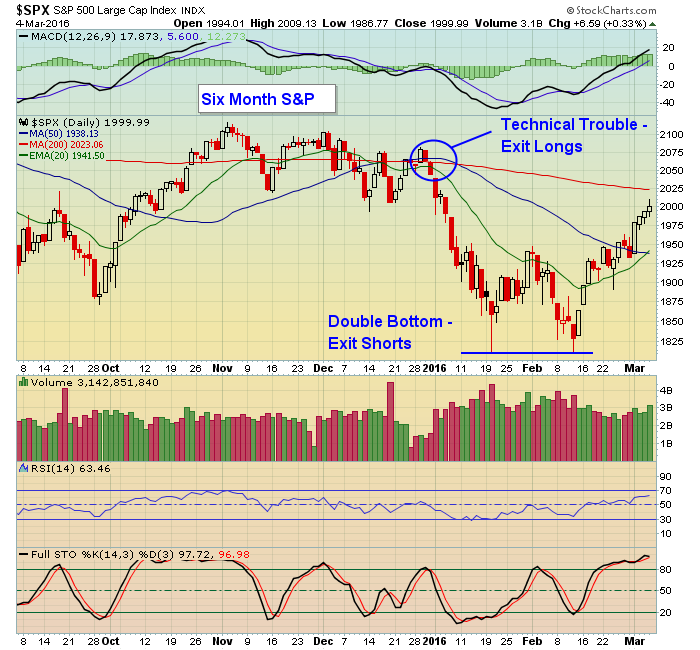
2016 has not been a very good year, although the rally the past few weeks has alleviated some of the earlier pain. I guess we should party like it's 1999.99 because that's where the S&P 500 closed on Friday. Couldn't we...
READ MORE
MEMBERS ONLY
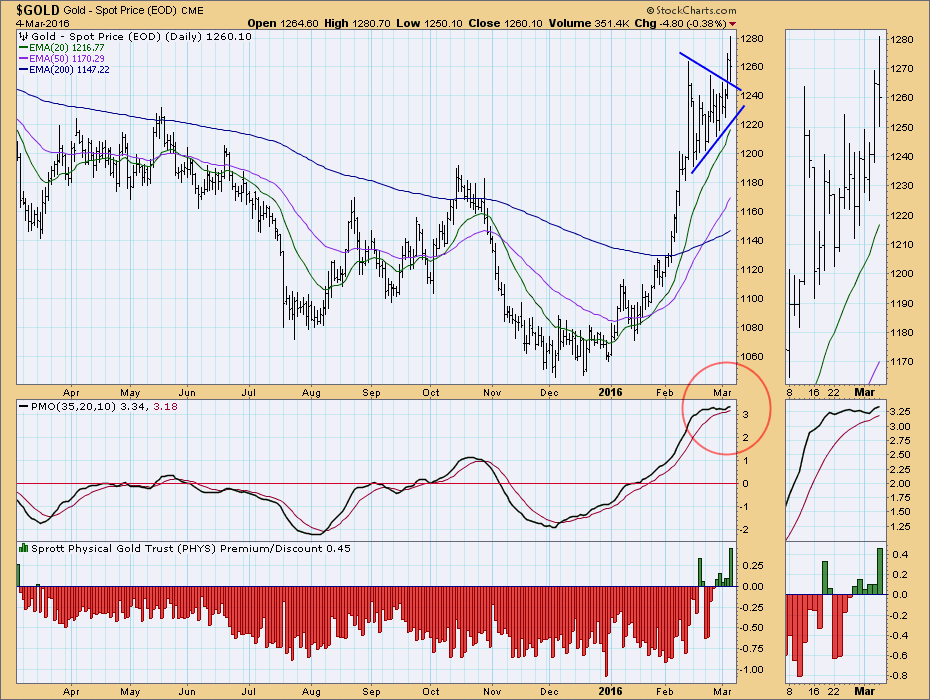
GOLD: Correction Coming?

by Carl Swenlin,
President and Founder, DecisionPoint.com
Last week I expressed my reluctance about writing an article about gold two weeks in a row; yet, here I am with article number three. I couldn't help it because I'm seeing a chart pattern that makes me think that gold will be experiencing a correction...
READ MORE
MEMBERS ONLY
Up Next: A Stock Market Showdown!
Hello Fellow ChartWatchers!
After an unexpectedly quick rise in stock prices this week, the markets are poised for a showdown. It's too bad we can't have the stock market be more like an athletic event...
In this corner, weighing in at 200-days in length, our long-term,...
READ MORE
MEMBERS ONLY
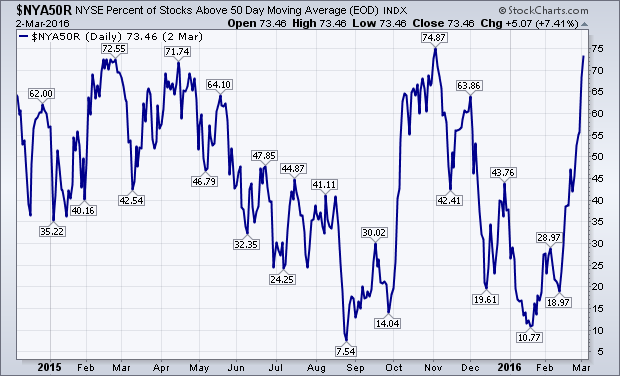
NYSE Percent of Stocks Above 50-Day Average Nears November High
by John Murphy,
Chief Technical Analyst, StockCharts.com
A lot of attention is now being paid to stocks testing or exceeding their moving average lines. My February 20 message had a headline suggesting that the percent of NYSE stocks trading above their 50- and 200-day moving averages might be bottoming. Let's take another look. The blue...
READ MORE
MEMBERS ONLY
It's as Easy to Get Burned Up as it is Down

by John Hopkins,
President and Co-founder, EarningsBeats.com
If the market this year has taught us one thing it's that it's as easy losing money when the market is going up as when it is going down. Consider this.
After the first trading day of the year was over, the S&P closed...
READ MORE
MEMBERS ONLY
Is Now The Time To Short?
by Tom Bowley,
Chief Market Strategist, EarningsBeats.com
Yes.
Does that mean the stock market is guaranteed to roll over and play dead? Absolutely not. Trading success is not always dependent on being right, as crazy as that might sound. It's about planning your trades to minimize risk in the event your call is incorrect. Many...
READ MORE
MEMBERS ONLY
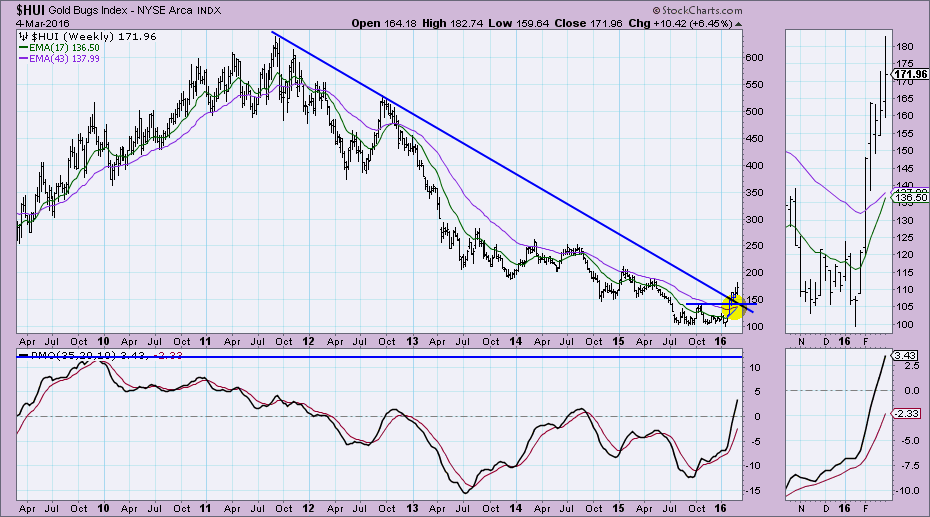
Gold Bugs ($HUI) Support Levels

by Erin Swenlin,
Vice President, DecisionPoint.com
I don't want to steal Carl's thunder as I happen to know he will be writing a follow-up article to his previous article on Gold. However, I did receive an email question to look at possible support levels on the Gold Bugs Index ($HUI). I'...
READ MORE
MEMBERS ONLY
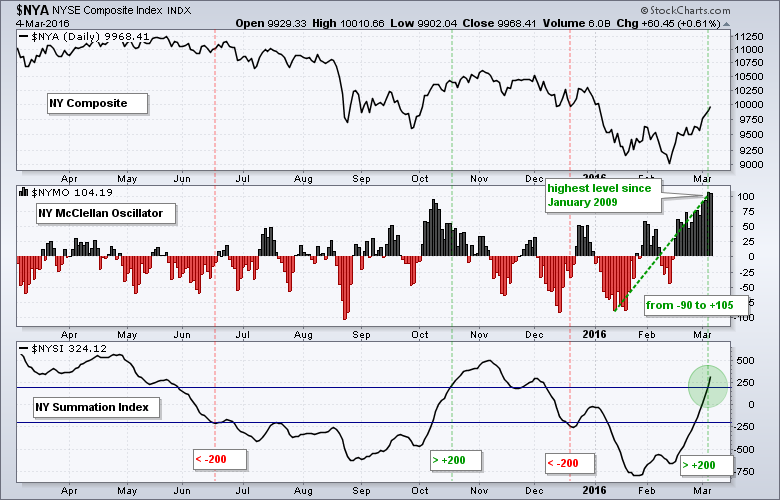
A Double-edged Sword for the McClellan Oscillators

by Arthur Hill,
Chief Technical Strategist, TrendInvestorPro.com
The McClellan Oscillators for the NYSE and Nasdaq surged over the last few weeks and hit multi-year highs. Medium-term, I would consider this breadth surge bullish. Short-term, however, it creates an overbought condition that could lead to a pullback or consolidation in stocks. Despite this double-edged sword, the medium and...
READ MORE
MEMBERS ONLY

Point and Figure Analysis with Intraday Charts

by Bruce Fraser,
Industry-leading "Wyckoffian"
We have worked with Point and Figure charts in multiple time frames using 1 box and 3 box methods. This is akin to constructing daily and weekly bar charts. For many traders intraday analysis and trading is preferred. The good news is that PnF analysis is a powerful technique for...
READ MORE
MEMBERS ONLY
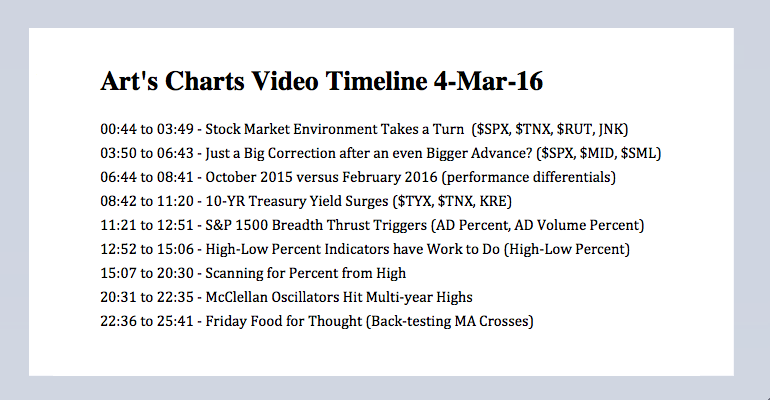
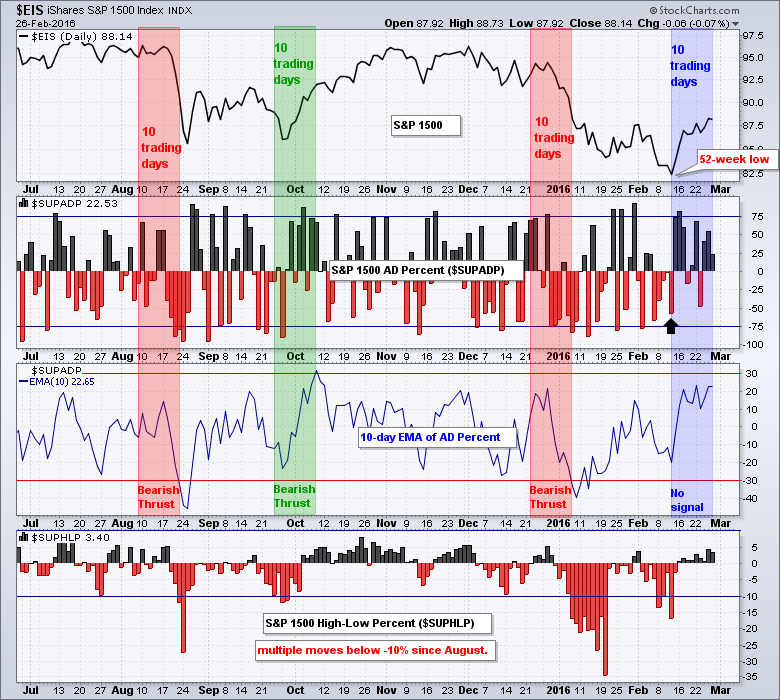
Market Environment Turns - October vs February - Breadth Thrust Triggers
by Arthur Hill,
Chief Technical Strategist, TrendInvestorPro.com
Stock Market Environment Takes a Turn // Just a Big Correction after an even Bigger Advance? // October 2015 versus February 2016 // 10-YR Treasury Yield Surges // S&P 1500 Breadth Thrust Triggers // High-Low Percent Indicators have Work to Do // McClellan Oscillators Hit Multi-year Highs // Friday Food for Thought ////
Stock Market Environment...
READ MORE
MEMBERS ONLY

Investing Is To Trading Just As Style Is To Design

by Gatis Roze,
Author, "Tensile Trading"
In the automotive industry, a car designer begins his or her career as a automotive stylist. Over time, as their knowledge and experience grows, the most talented of the bunch are offered the chance to become a car designer. It can take many years to earn that title, and few...
READ MORE
MEMBERS ONLY
Jobs Surge In February, S&P 500 Looks To Clear 2000
by Tom Bowley,
Chief Market Strategist, EarningsBeats.com
Market Recap for Wednesday, March 3, 2016
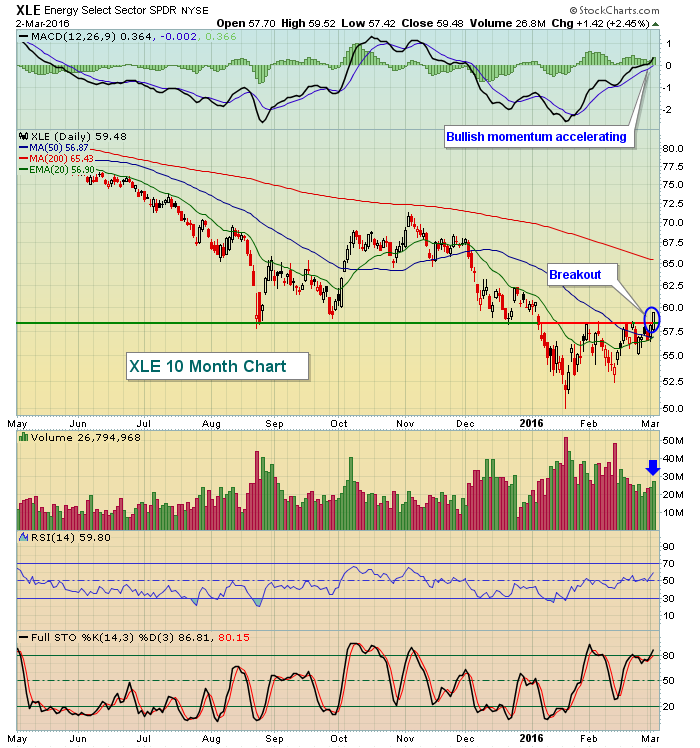
I spoke yesterday about the significance of the XLE's breakout on Wednesday. Thursday's follow through day was impressive as well as the XLE led all sectors, gaining another 1.51%. I'd like to see crude oil ($WTIC)...
READ MORE
MEMBERS ONLY
What Do You Mean... "Fierce Overhead Resistance"?
by Erin Swenlin,
Vice President, DecisionPoint.com
I suspect a few eyebrows were raised when they saw the title to my DecisionPoint Alert blog article today, "Fierce Overhead Resistance Looming". Resistance lines, support lines and trend lines are usually considered stronger based on how many times price "touches" them. Intuitively this makes sense....
READ MORE
MEMBERS ONLY

COMMERCIAL VEHICLE AND TRUCK GROUP LEADS INDUSTRIAL SECTOR HIGHER -- DEERE, PACCAR, AND CATERPILLAR TEST 200-DAY AVERAGES -- GATX CLEARS ITS 200-DAY LINE TO LEAD TRANSPORTATION GROUP -- SO HAS JB HUNT
by John Murphy,
Chief Technical Analyst, StockCharts.com
LEAD INDUSTRIALS HIGHER... Economically-sensitive industrial stocks continue to show new strength. A leading industrial group is the Dow Jones US Commerical Vehicles and Trucks Index ($DJUSHR). Chart 1 shows that index climbing more than 2% today to a new three month high. It includes big percentage gainers like Joy Global...
READ MORE
MEMBERS ONLY
Breadth Remains Strong - 4 Sector SPDRs above 200-day - Gold, Silver and Platinum Setups
by Arthur Hill,
Chief Technical Strategist, TrendInvestorPro.com
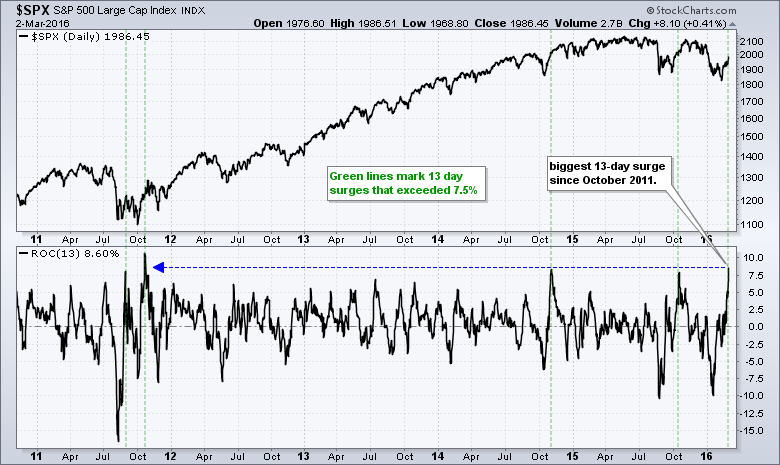
13 Days that Shook the Market // Bullish Breadth Thrust Nears // Checking the Signals in 2011 (again) // Still Hanging out in No Man's Land // All Nine Sector SPDRs in Short-term Uptrends // Bullish Continuation Patterns in Precious Metals // Nothing but Downtrend for Oil and NatGas ////
13 Days that Shook the...
READ MORE
MEMBERS ONLY
Small Caps Lead As Major Resistance And Jobs Report Near
by Tom Bowley,
Chief Market Strategist, EarningsBeats.com
Market Recap for Wednesday, March 2, 2016
Energy (XLE) made a very important technical breakout on Wednesday and did so with increasing volume. That's an excellent sign of a further uptrend. The XLE now has important support at its rising 20 day EMA, currently at 56.90. Initial...
READ MORE
MEMBERS ONLY
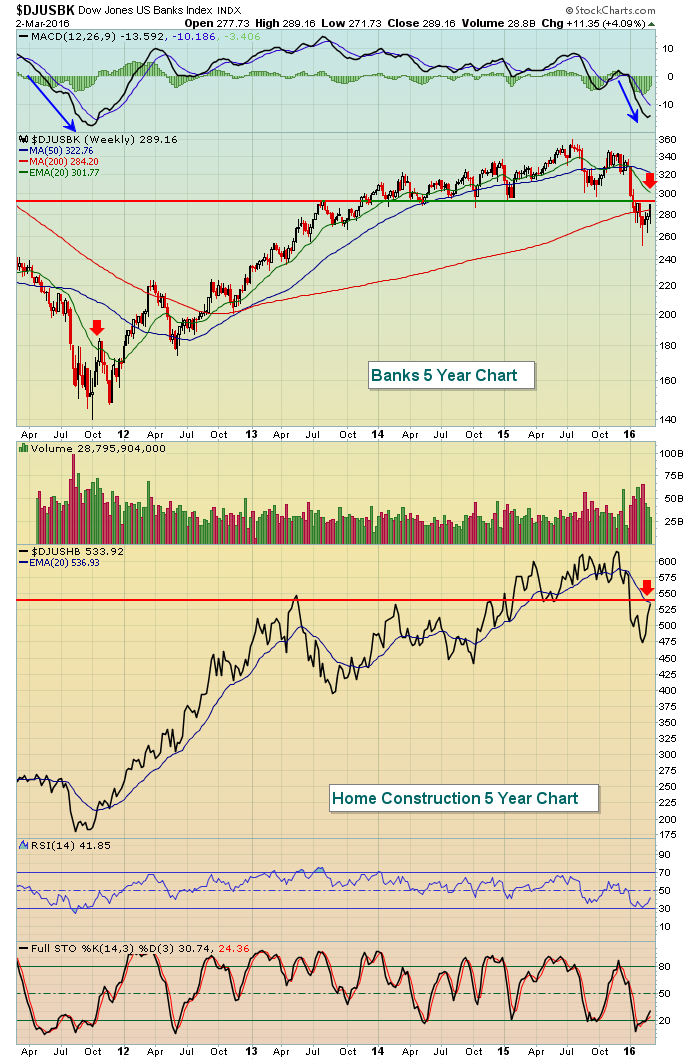
Home Construction And Bank Stocks Awaiting HUGE Jobs Report
by Tom Bowley,
Chief Market Strategist, EarningsBeats.com
Tomorrow's nonfarm payrolls report is a really, really big deal. Maybe not so much from a fundamental perspective, but it certainly is from a technical perspective. Over the past few months, we've seen heavy volume selling and a rotation toward defensive areas of the market like...
READ MORE
MEMBERS ONLY

Three Indicators You Should Watch To Signal A New Bull Market

by Martin Pring,
President, Pring Research
* Credit spreads about to turn?
* A PPO that calls primary trends
* Record High Indicator
The market is now starting to respond positively to several bullish intermediate indicators. I still believe the main trend is down, but it seems like a good idea to look at three currently bearish indicators and...
READ MORE
MEMBERS ONLY
Candlestick Analysis - Pattern Identification

by Greg Morris,
Veteran Technical Analyst, Investor, and Author
All books on candlesticks offer detailed descriptions of the relationships among the open, high, low, and close. They also deal with the concepts of trend determination which I did in the previous article; while this article focuses on pattern identification. In addition, a method of determining long days, short days,...
READ MORE
MEMBERS ONLY

ALCOA AND FREEPORT MCMORAN CONTINUE TO RISE WITH INDUSTRIAL METALS -- SO DO STEEL STOCKS -- AKSTEEL, STEEL DYNAMICS, AND RELIANCE STEEL CLEAR 200-DAY AVERAGES -- AUSSIE AND CANADIAN DOLLARS ARE RISING WITH COMMODITIES
by John Murphy,
Chief Technical Analyst, StockCharts.com
ALCOA AND FREEPORT MCMORAN LEAD MARKET HIGHER ... A lot of attention is being paid to the recent upturn in the price of oil and energy shares, and its potentially positive influence on the global economy and stocks. An even more impressive upturn is taking place in industrial metals and their...
READ MORE
MEMBERS ONLY
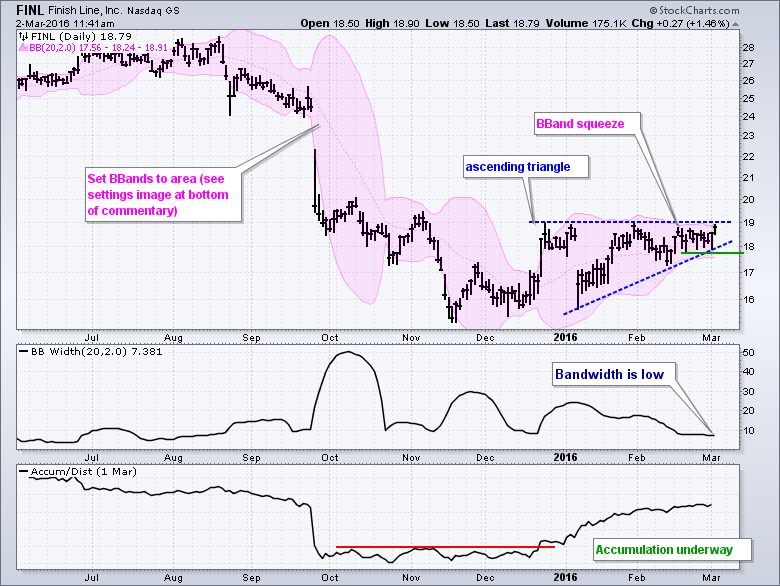
The Squeeze Play is on for Finish Line
by Arthur Hill,
Chief Technical Strategist, TrendInvestorPro.com
2015 was a rough year for Finish Line and the Retail SPDR (XRT) as both fell rather sharply. FINL was down over 20% and XRT fell over 8%. 2016 is shaping up a bit different because FINL is up around 2% year-to-date and XRT turned positive on Tuesday. Furthermore, FINL...
READ MORE
MEMBERS ONLY
U.S. Indices Explode Higher, Clear Initial Technical Hurdles
by Tom Bowley,
Chief Market Strategist, EarningsBeats.com
Market Recap for Tuesday, March 1, 2016
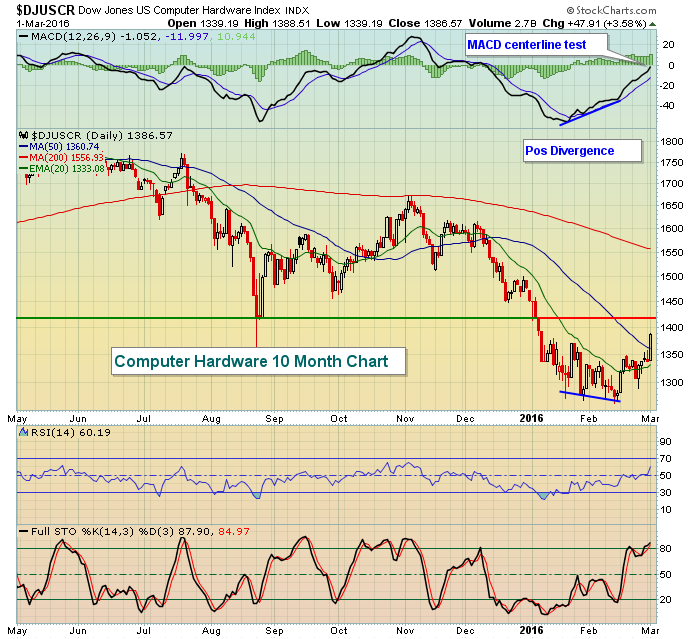
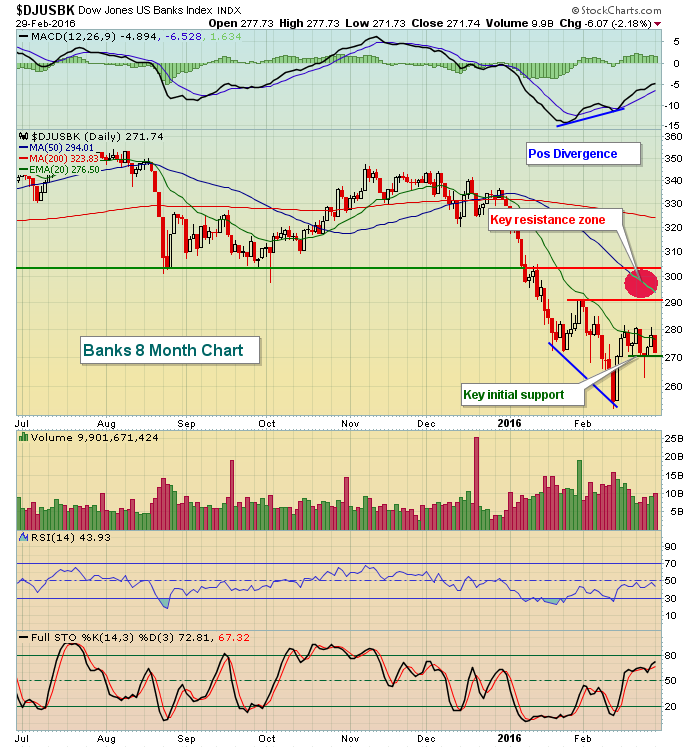
Tuesday was a very impressive broad-based rally with index leadership from the NASDAQ, especially NASDAQ 100 shares, and also leadership from the key financial (XLF), technology (XLK) and consumer discretionary (XLY) sectors. Among industry groups, banks ($DJUSBK), computer hardware ($DJUSCR), software ($DJUSSW), internet...
READ MORE
MEMBERS ONLY

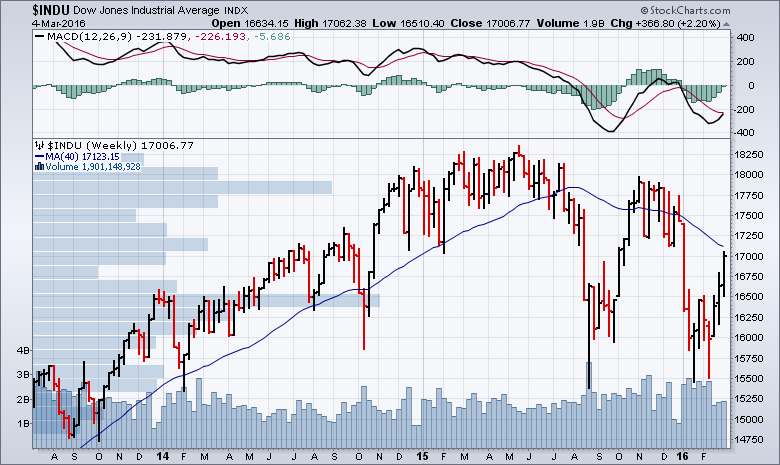
MARKET RALLY PUSHES MAJOR INDEXES OVER 50-DAY AVERAGES TO STRENGTHEN SHORT-TERM TREND -- INDUSTRIAL AND TECHNOLOGY SPDRS CLEAR 200-DAY LINES -- BOUNCE IN BOND YIELD BOOSTS BANKS AND FINANCIALS -- EMERGING MARKETS LEAD GLOBAL RALLY
by John Murphy,
Chief Technical Analyst, StockCharts.com
MAJOR STOCK INDEXES ARE ABOVE 50-DAY AVERAGES ... The market's short-term trend continues to strengthen. Today's strong gains have pushed all major U.S. stock indexes above their 50-day moving averages. Chart 1 shows the Dow Industrials trading at a two-month high, with a good shot at...
READ MORE
MEMBERS ONLY
Banks And Biotechs Weigh On U.S. Equities
by Tom Bowley,
Chief Market Strategist, EarningsBeats.com
Special Note
Today marks my one year anniversary as Senior Technical Analyst here at StockCharts.com. I love being here and look forward to many more years with this truly great company. I want to thank everyone at StockCharts and also all of you for your support during the past...
READ MORE
MEMBERS ONLY
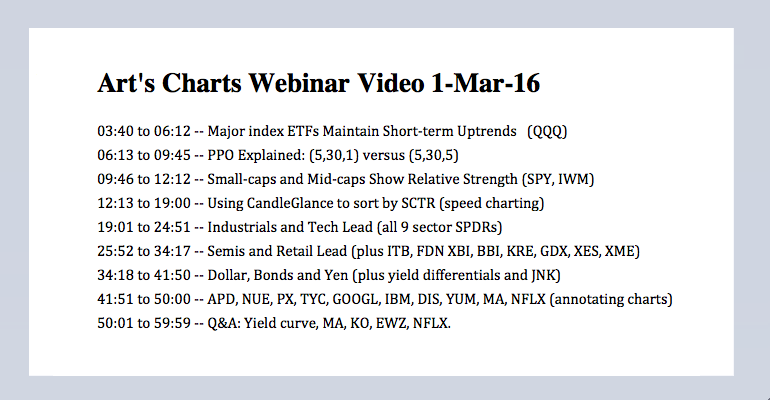
ST Uptrends Hold - Small-Mid Caps Outperform - Credit Improves - Webinar Video
by Arthur Hill,
Chief Technical Strategist, TrendInvestorPro.com
Major index ETFs Maintain Short-term Uptrends // Small and Mid Caps Show Relative Strength // Sentiment is Quite Bearish // Credit Conditions are Improving (JNK, LQD, TLT) // Keep an Eye on Safe Haven Assets (GLD,FXY,TLT) // Relative Weakness in Finance Sector Remains a Concern ////
Major index ETFs Maintain Short-term Uptrends
The major...
READ MORE
MEMBERS ONLY
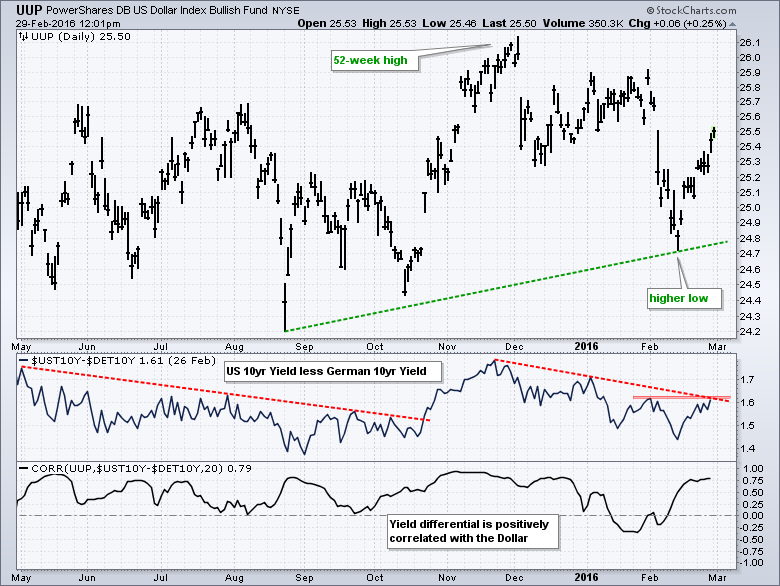
US-German Yield Differential Drives the Dollar ETF
by Arthur Hill,
Chief Technical Strategist, TrendInvestorPro.com
The chart for the US Dollar ETF (UUP) is bit of a mess, but I think the overall trend is up and the US-German yield differential looks poised to move higher. The main chart window shows UUP hitting a multi-month high with the October-November surge. The ETF then fell with...
READ MORE
MEMBERS ONLY
Strength In Treasuries Offsets S&P 500 Rally
by Tom Bowley,
Chief Market Strategist, EarningsBeats.com
Market Recap for Friday, February 26, 2016
Materials (XLB) led bifurcated action on Friday as this sector rose 1.45%, more than double any other sector. Both the NASDAQ and Russell 2000 showed gains, while the Dow Jones and S&P 500 finished in negative territory. The XLB drew...
READ MORE
MEMBERS ONLY
Breadth Thrust Falls Short - In the Retracement Zone - 3 Keys to ST Uptrend
by Arthur Hill,
Chief Technical Strategist, TrendInvestorPro.com
Breadth Thrust Falls Short // Setting a Potential Reversal Zone // 3 Keys to Short-term Uptrend // Bearish PPO Setups // Confirming the Short-term Trend with Breadth // XLK and XLY Tests Falling 200-day // XLE Remains the Weakest // XLP Forms Outside Reversal ////
Breadth Thrust Falls Short
We are still in a bear market environment. Breadth...
READ MORE
MEMBERS ONLY
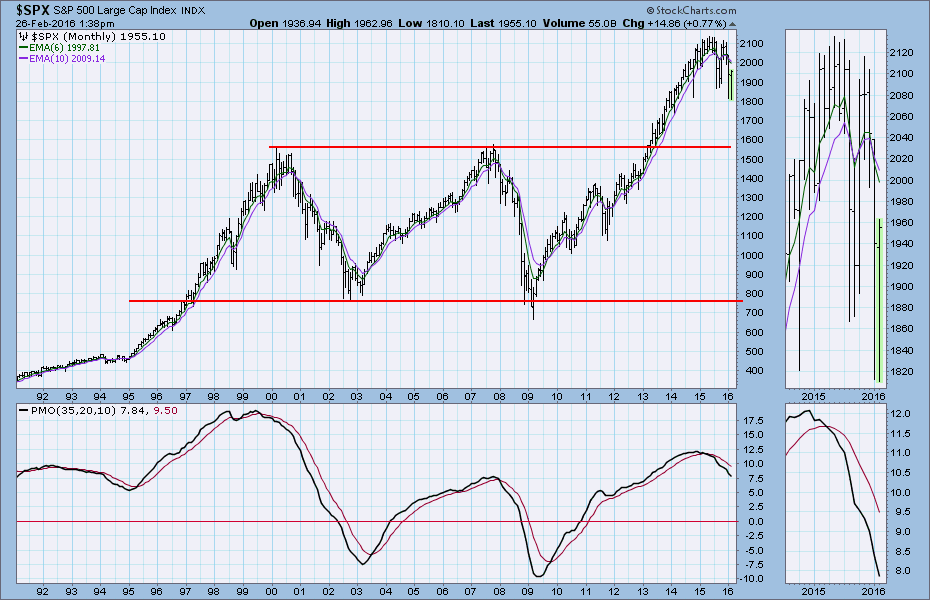
STOCKS: Looking Long-Term
by Carl Swenlin,
President and Founder, DecisionPoint.com
The day to day stock market jitterbug can undermine out conclusions and resolve in the short term, so it is always good to pull back and evaluate longer-term charts for a look at the big picture. At DecisionPoint our primary indicator for objectively defining a bull or bear market is...
READ MORE
MEMBERS ONLY
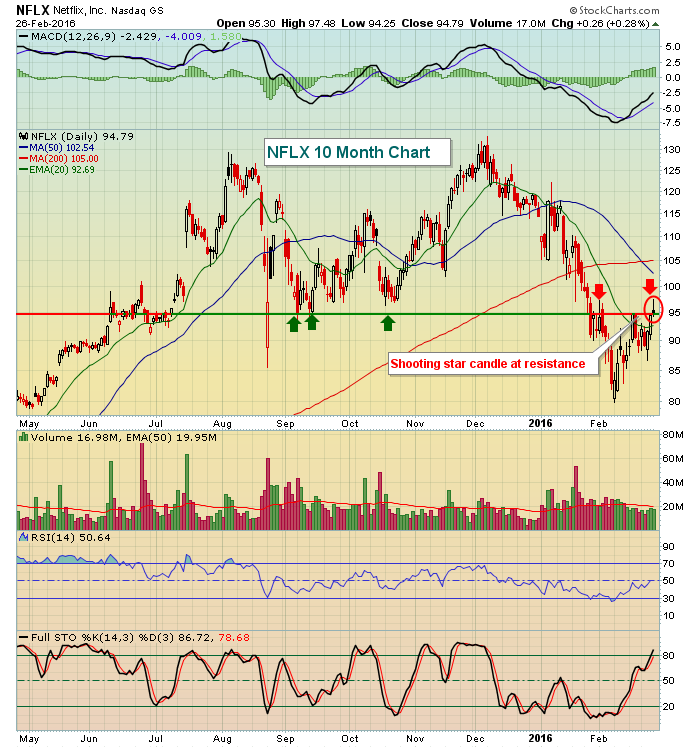
NFLX Prints Shooting Star On Friday
by Tom Bowley,
Chief Market Strategist, EarningsBeats.com
Over the past few months, traders have shunned risk and we've seen many high flyers begin to take big hits. Netflix (NFLX) certainly fits that category and hasn't been immune to the selling. Recently, NFLX traded at a high of 133.27, but has since fallen...
READ MORE
MEMBERS ONLY
Violent Ranges - Breadth Picks Up - SPY Leads with Breakout - Finance Lags
by Arthur Hill,
Chief Technical Strategist, TrendInvestorPro.com
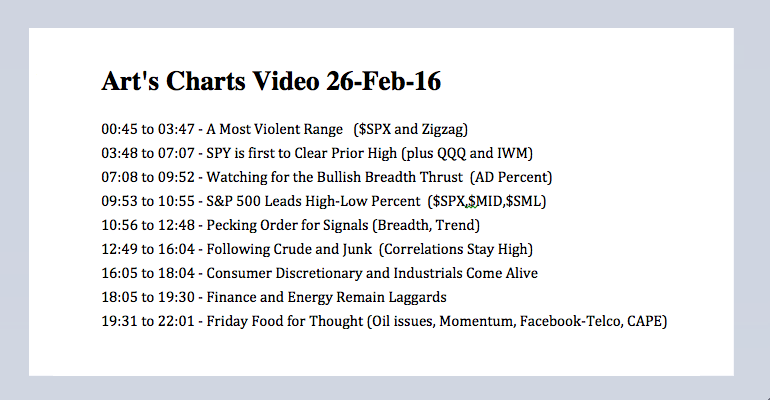
A Most Violent Range // SPY is first to Clear Prior High // Watching for the Bullish Breadth Thrust // S&P 500 Leads High-Low Percent // Signal Pecking Order // Following Crude and Junk // Consumer Discretionary and Industrials Come Alive // Finance and Energy Remain Laggards // Friday Food for Thought ////
A Most Violent Range...
READ MORE
MEMBERS ONLY

Crude Oil Update
by Bruce Fraser,
Industry-leading "Wyckoffian"
In the blog post of December 17th titled ‘Crude Oil; How Low Can it Go?’ (click here for a link), we studied the bear market in crude oil of 2008-09, the bull market of 2009, and then the current bear market. The long term point and figure analysis for each...
READ MORE
MEMBERS ONLY

Driverless Trading and the Five Investor Personalities
by Gatis Roze,
Author, "Tensile Trading"
Pursuing a ‘driverless strategy’ – be it automobiles, hedge funds or individual investing – is counterfactual thinking, in my opinion. The new BMW iVision car has knob-less gesture controls, 3D displays and an auto function that switches the car into driverless mode. Perhaps this will work on highways of the future, but...
READ MORE
MEMBERS ONLY
Bears: Pardon The Interruption
by Tom Bowley,
Chief Market Strategist, EarningsBeats.com
Market Recap for Thursday, February 25, 2016
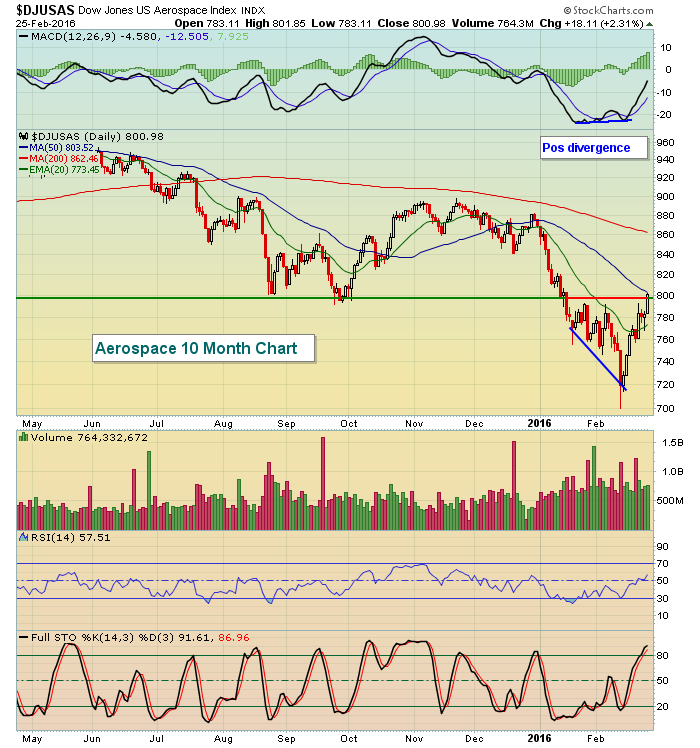
Financials (XLF) rallied nicely on Thursday to lead this extended market rally. Unfortunately, four of the six best performing industry groups within financials were REITs, the more defensive area of financials. Industrials (XLI) also performed well with aerospace ($DJUSAS) the leader there. The...
READ MORE
MEMBERS ONLY
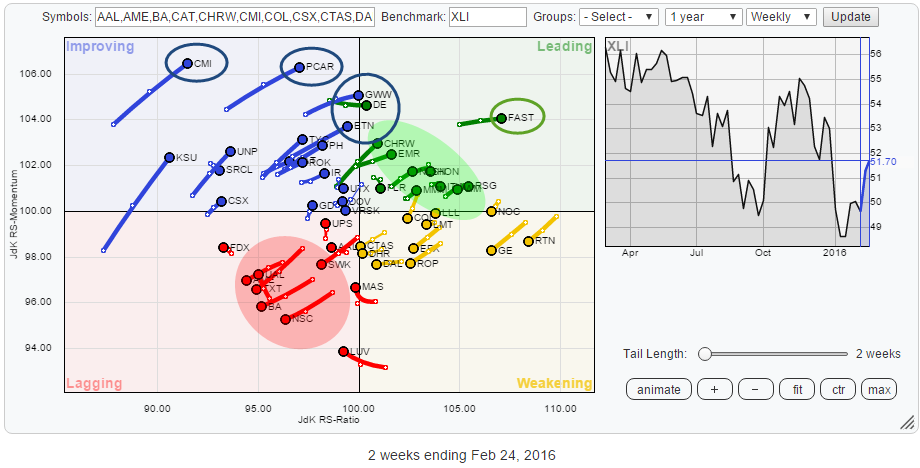
Stock rotation inside Industrials (XLI) sector

by Julius de Kempenaer,
Senior Technical Analyst, StockCharts.com
The Industrials sector, XLI, itself is positioned near the center of the Relative Rotation Graph holding all the sector ETFs that make up the S&P 500 index. This means that XLI is moving more or less in line with the S&P 500 and that there is,...
READ MORE
MEMBERS ONLY
Are Indicators Lining Up for the Perfect Storm?
by Erin Swenlin,
Vice President, DecisionPoint.com
Indicators in all timeframes don't always coordinate with each other, but I believe they are beginning to meld right now. In the member's only DecisionPoint Alert blog, I cover all of these oscillators on separate charts based on the timeframe (i.e. short-term chart, intermediate-term chart,...
READ MORE
MEMBERS ONLY

LOW BOND YIELDS CONTINUE TO BENEFIT DIVIDEND-PAYERS -- THAT INCLUDES STAPLES, REITS, UTILITIES, AND TELECOM -- DIVIDEND ISHARES TEST FOURTH QUARTER HIGH -- STAPLE AND UTILITY SPDRS HIT NEW HIGHS -- REITS AND TELECOM ETFS SHOW RELATIVE STRENGTH
by John Murphy,
Chief Technical Analyst, StockCharts.com
BOND YIELDS ARE STILL LOW... I recently showed the 10-Year Treasury Bond Yield ($TNX) bouncing off an "island reversal" bottom formed a couple of weeks ago (see circle), and pointed out that pattern usually signals a "short-term" change in direction. Chart 1 shows the TNX moving...
READ MORE
MEMBERS ONLY
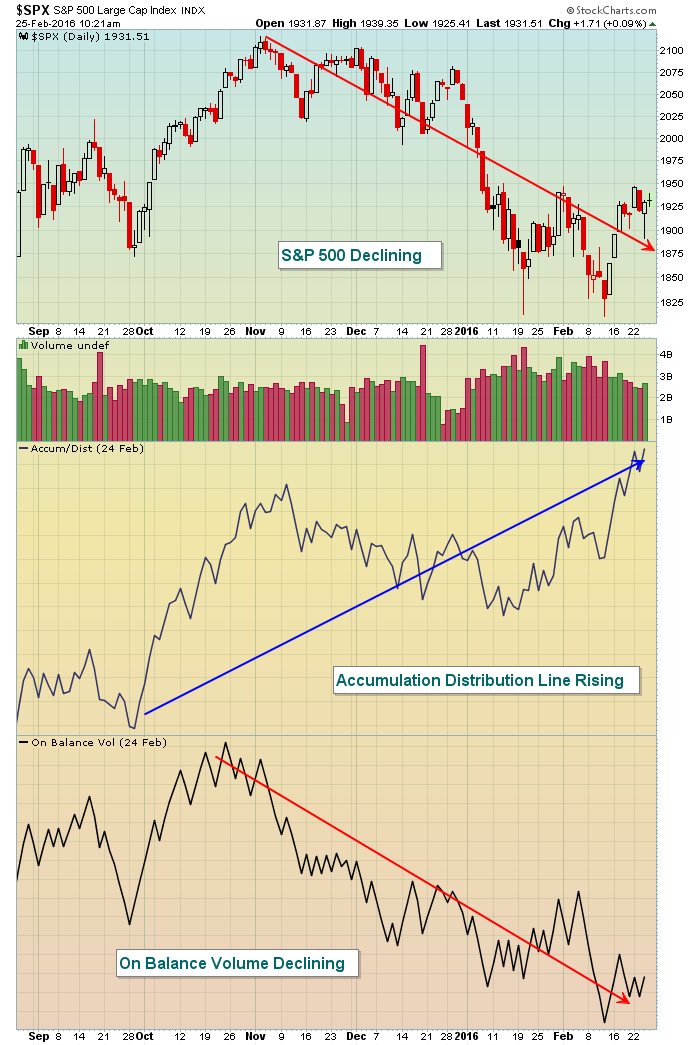
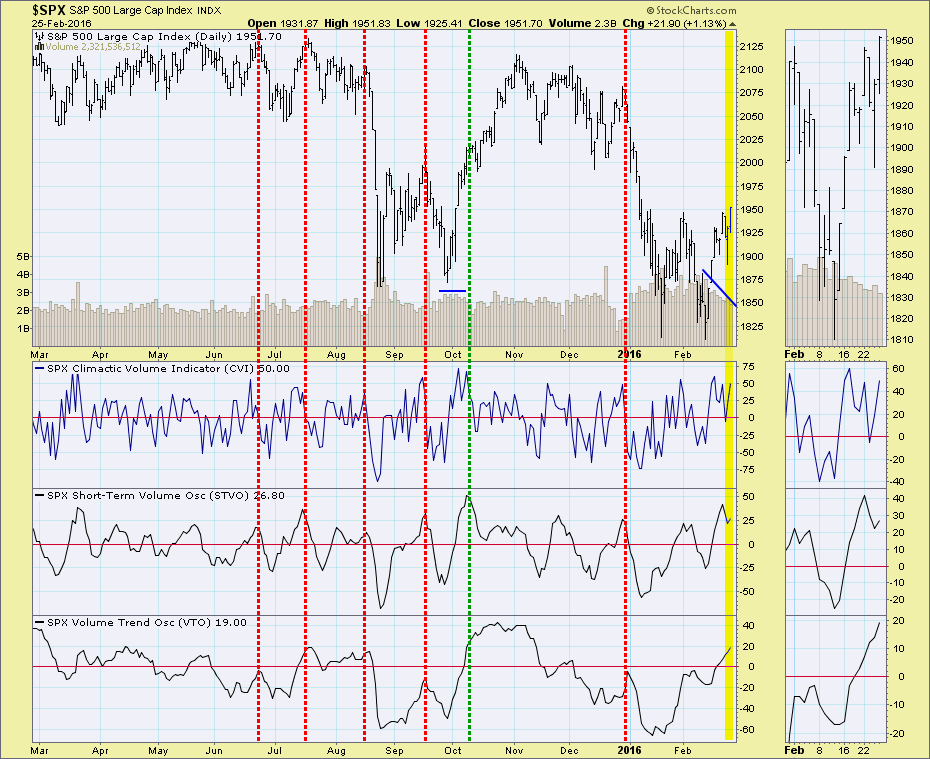
Is The Current S&P 500 Rally Sustainable? Don't Decide Based On These Two Indicators Alone
by Tom Bowley,
Chief Market Strategist, EarningsBeats.com
Everyone is trying to evaluate the strength and sustainability of the current U.S. equity rally. StockCharts.com provides us the tools to do just that. But not every indicator tells us the complete truth. A look at the most recent drop in the S&P 500 and subsequent...
READ MORE
