MEMBERS ONLY

Week Ahead: NIFTY Slated for A Strong Start; Close Above This Level Needed for Trending Move

by Milan Vaishnav,
Founder and Technical Analyst, EquityResearch.asia and ChartWizard.ae
The Nifty continues to consolidate just below a crucial resistance band while maintaining a broader uptrend. What would be needed to for it break out?...
READ MORE
MEMBERS ONLY
Are Your Stocks Keeping Up? Here's How to Check

by Jayanthi Gopalakrishnan,
Director of Site Content, StockCharts.com
A quiet week, but be sure to look under the hood.
It was another week of relatively little movement in the stock market. Yes, tariff headlines stirred things up a bit, but as the dust settled, the major indices quietly edged higher.
Here’s their weekly performance:
* Dow Jones Industrial...
READ MORE
MEMBERS ONLY

Rangebound Market: How to Trade the S&P 500’s Next Move

by David Keller,
President and Chief Strategist, Sierra Alpha Research
The S&P 500 remains locked in a multi-month consolidation as leadership rotates from growth into value. Dave Keller, CMT, updates key support and resistance levels and explains how momentum signals, especially RSI, could confirm the S&P 500's next breakout or breakdown....
READ MORE
MEMBERS ONLY

S&P 500 Trapped Between 6797 and 7000 — Which Breaks First?

by Tom Bowley,
Chief Market Strategist, EarningsBeats.com
Markets whipsawed again this week as the S&P 500 continues testing critical support at 6797. Tom Bowley reviews the major indices, highlights stocks that have crushed the S&P 500 over the past three months, and launches his new “Stock Wars” segment....
READ MORE
MEMBERS ONLY

Sector Momentum Favors Defense; QQQ Yet To Break; Split NDX Breadth

by Arthur Hill,
Chief Technical Strategist, TrendInvestorPro.com
The stock market is clearly in defensive mode but QQQ is still holding up, and its long-term breadth still hasn't turned bearish. Arthur Hill's analysis identifies the key levels to watch....
READ MORE
MEMBERS ONLY
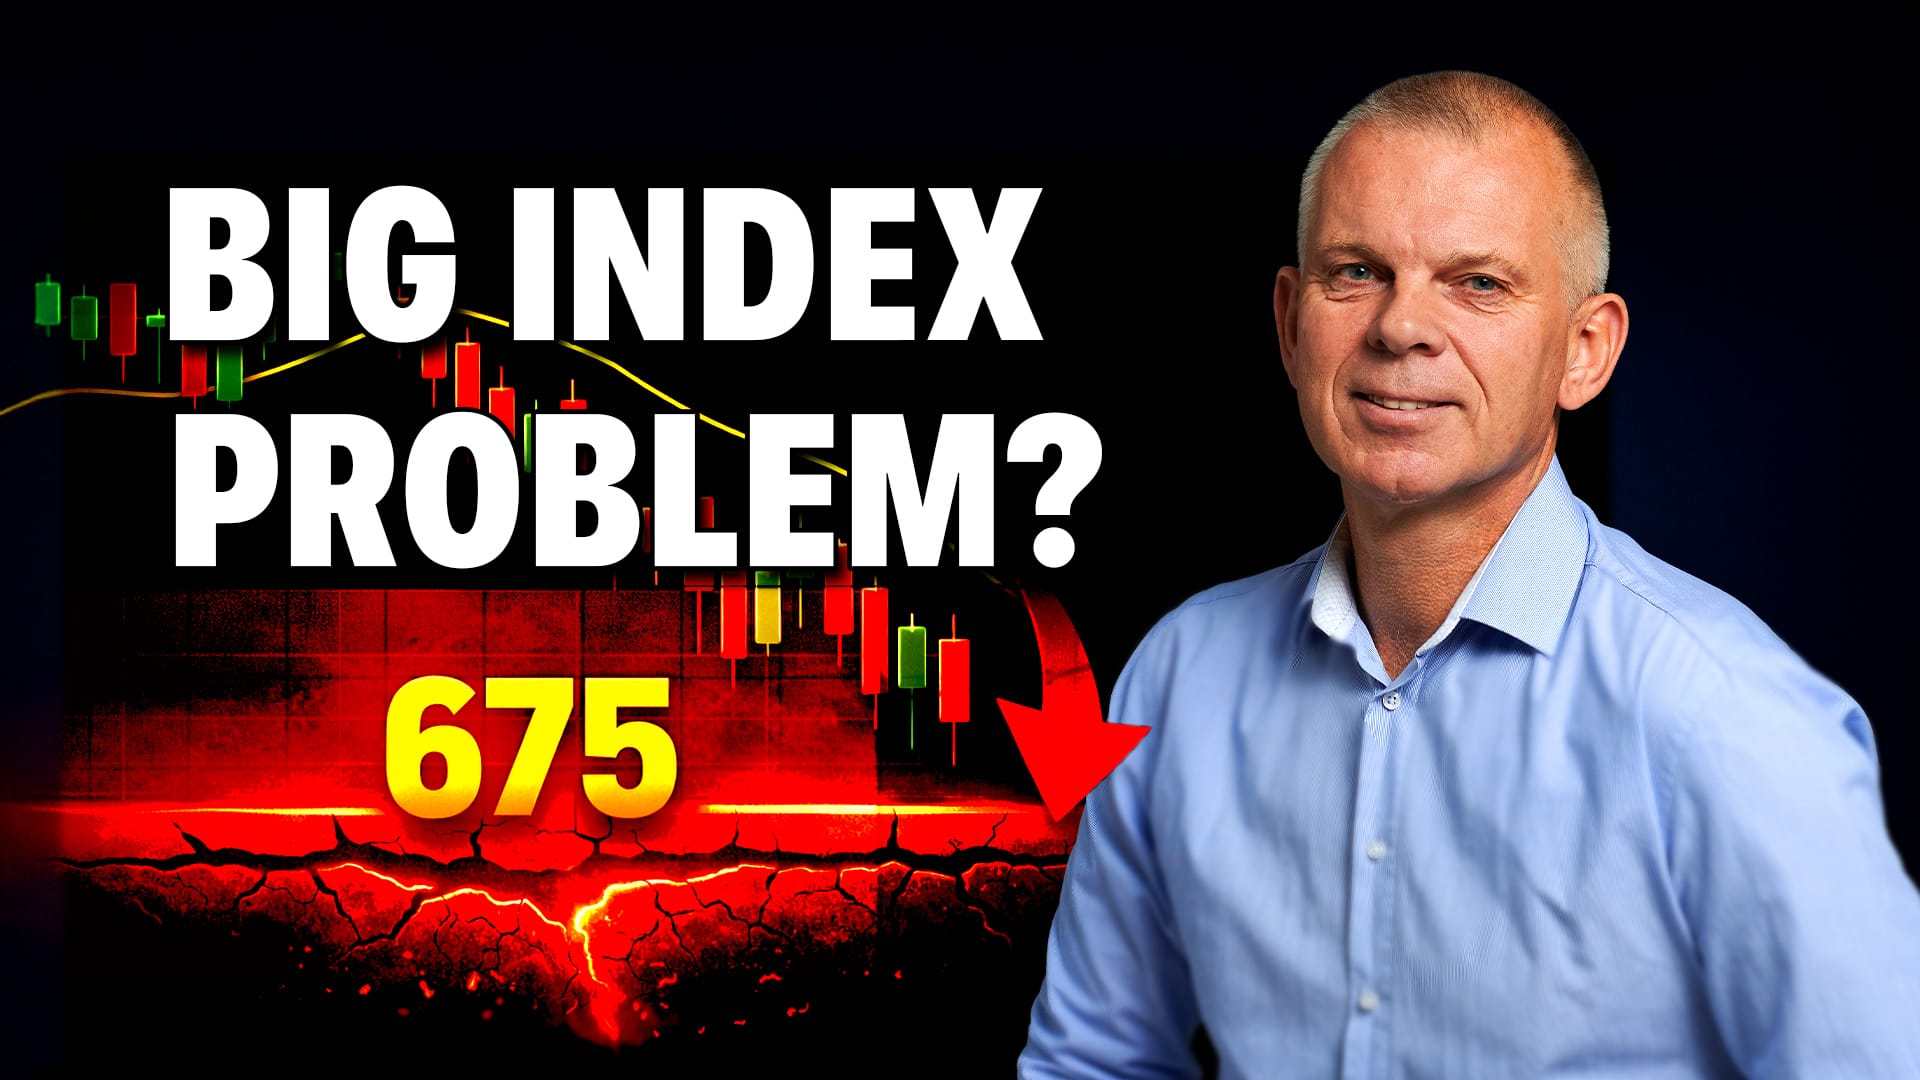
The S&P 500 Has a Big Problem — And It’s Not Commodities

by Julius de Kempenaer,
Senior Technical Analyst, StockCharts.com
Commodities remain strong, but the S&P 500 is facing pressure from weakening large-cap sectors. In this video, Julius de Kempenaer walks through asset classes, bond maturities, and sector rotation to explain why momentum is fading — and why 675 on SPY matters more than 700....
READ MORE
MEMBERS ONLY

StockCharts Insider: The Missing Step in Ichimoku Cloud Breakout Strategies

by Karl Montevirgen,
The StockCharts Insider
Before We Dive In…
Ichimoku Cloud breakouts can be an incredibly effective way to jump into a trend but only if you follow the right steps when pulling the trigger. You can easily find these breakouts while fine-tuning your criteria using StockCharts’ Updated Scan Filters. However, if you simply focus...
READ MORE
MEMBERS ONLY

Think the Unthinkable: The Dollar May Go Up!

by Martin Pring,
President, Pring Research
How weak is the US dollar looking? Martin Pring analyzes the US Dollar Index and shows us that the dollar may not be in as bad a position as many think....
READ MORE
MEMBERS ONLY

The "AI Bubble" Didn't Burst. It Went on Sale.

by Tony Zhang,
Chief Strategist, OptionsPlay
Tony Zhang discusses a bullish counter-trend options setup for Amazon's stock. Here's how he found the trade and why he's seeing a high-conviction contrarian play....
READ MORE
MEMBERS ONLY
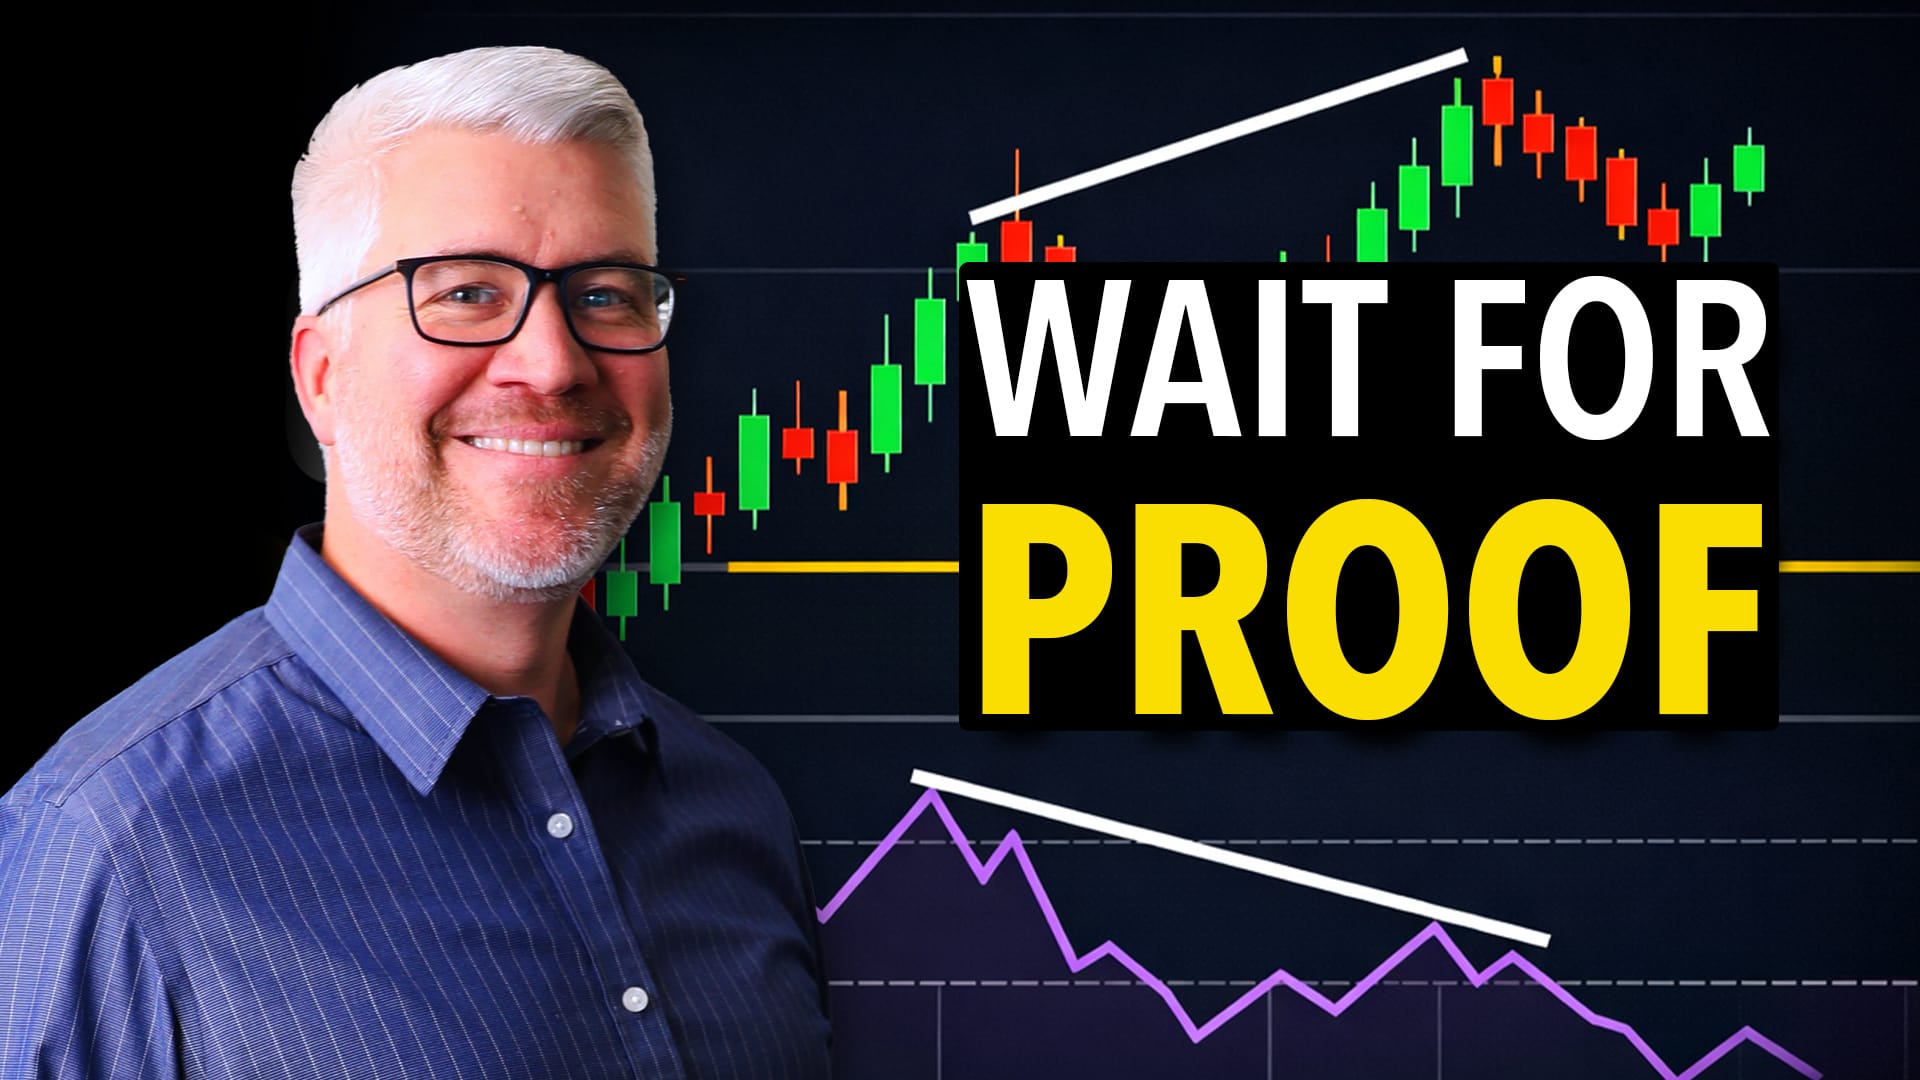
RSI Divergences Can Signal Major Tops — But Only If Confirmed!
by David Keller,
President and Chief Strategist, Sierra Alpha Research
RSI divergences can warn of potential major tops, but only if confirmed by breakdown signals. David Keller walks through DG, GOOGL, AT&T, and the S&P 500 to show what must happen before a divergence becomes actionable....
READ MORE
MEMBERS ONLY

VIX Near 20: Is the Stock Market Entering the Danger Zone?
With several event catalysts now within the 30-day VIX window, it's time to ask: Does the market have a volatility problem? Mike Zaccardi breaks down the charts and assesses the danger....
READ MORE
MEMBERS ONLY

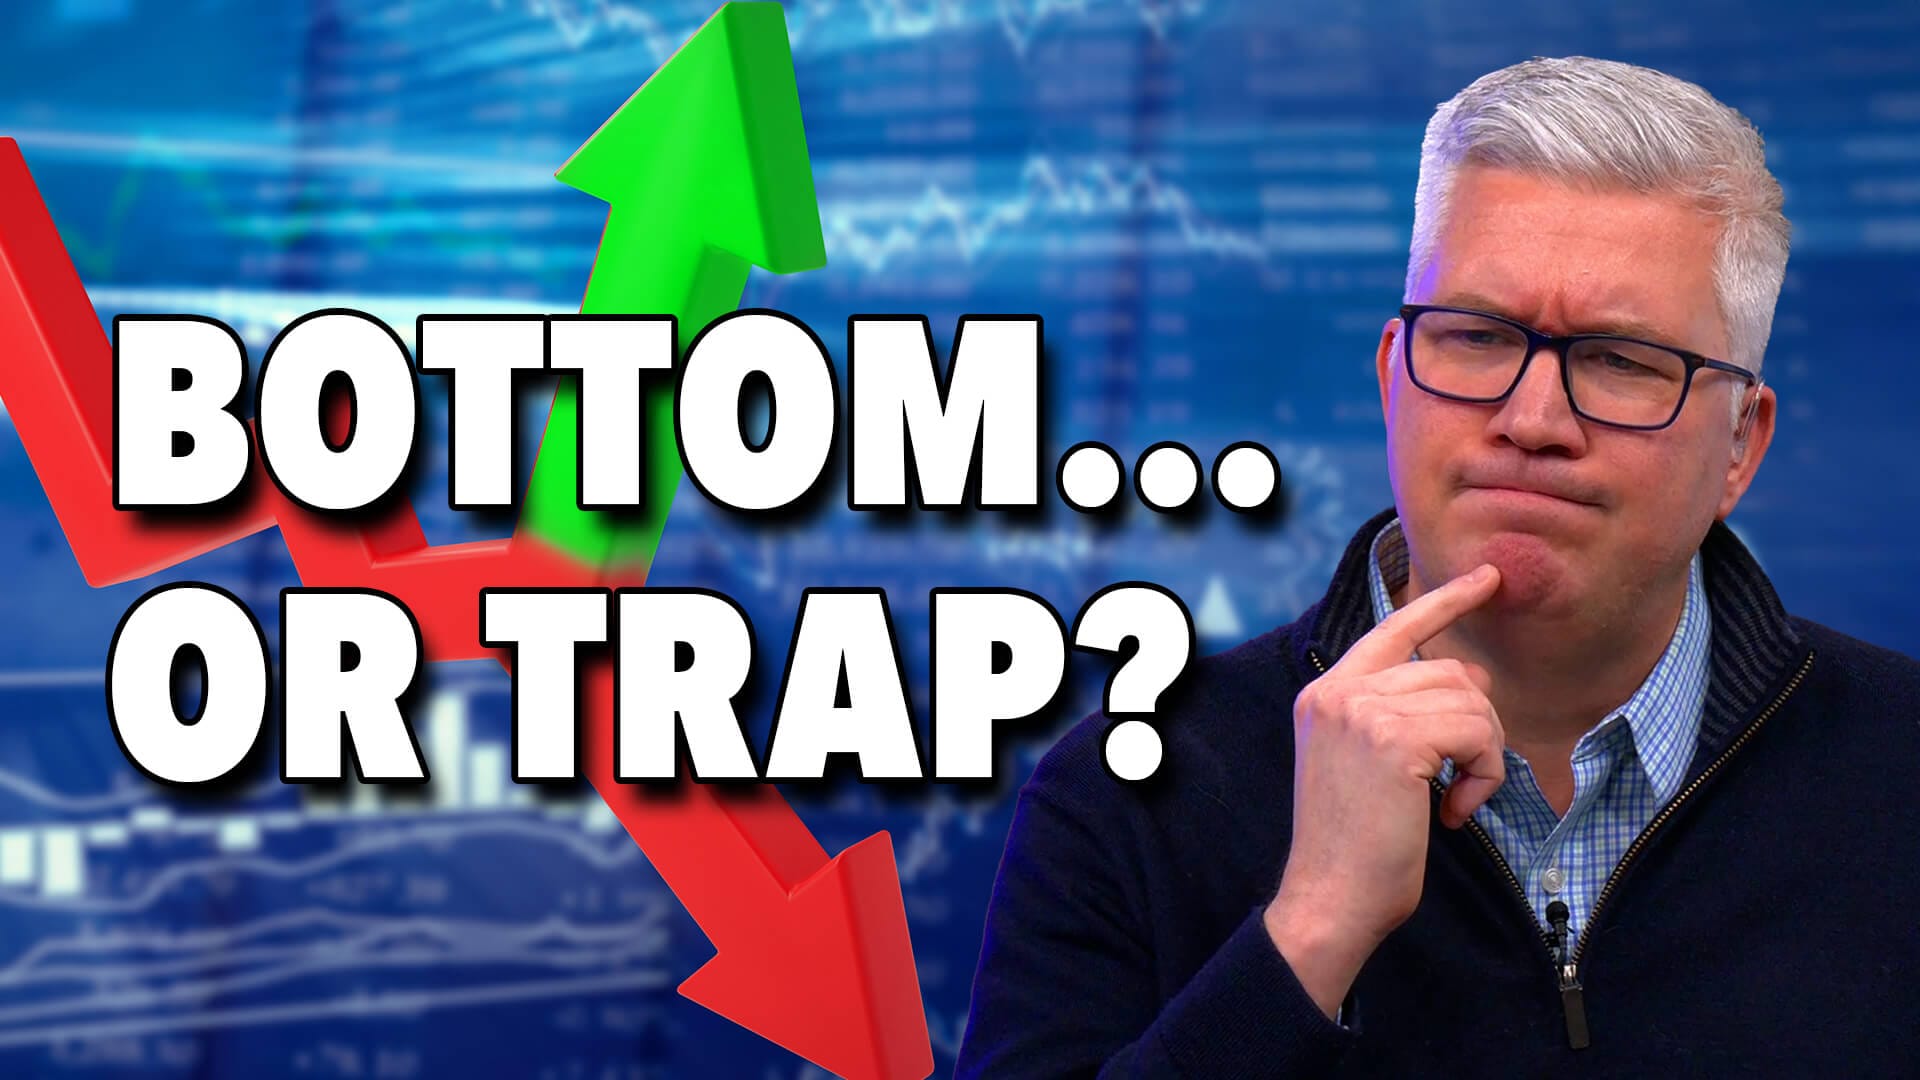
Bottom Fishing or Breakdown? How to Spot a True Trend Reversal
by David Keller,
President and Chief Strategist, Sierra Alpha Research
When high-flying stocks tumble, is it a buying opportunity or the start of a deeper decline? Dave Keller, CMT, uses Alaska Air as a case study to show how momentum divergences and moving averages can confirm a true bottom—then applies the framework to PLTR and COIN....
READ MORE
MEMBERS ONLY
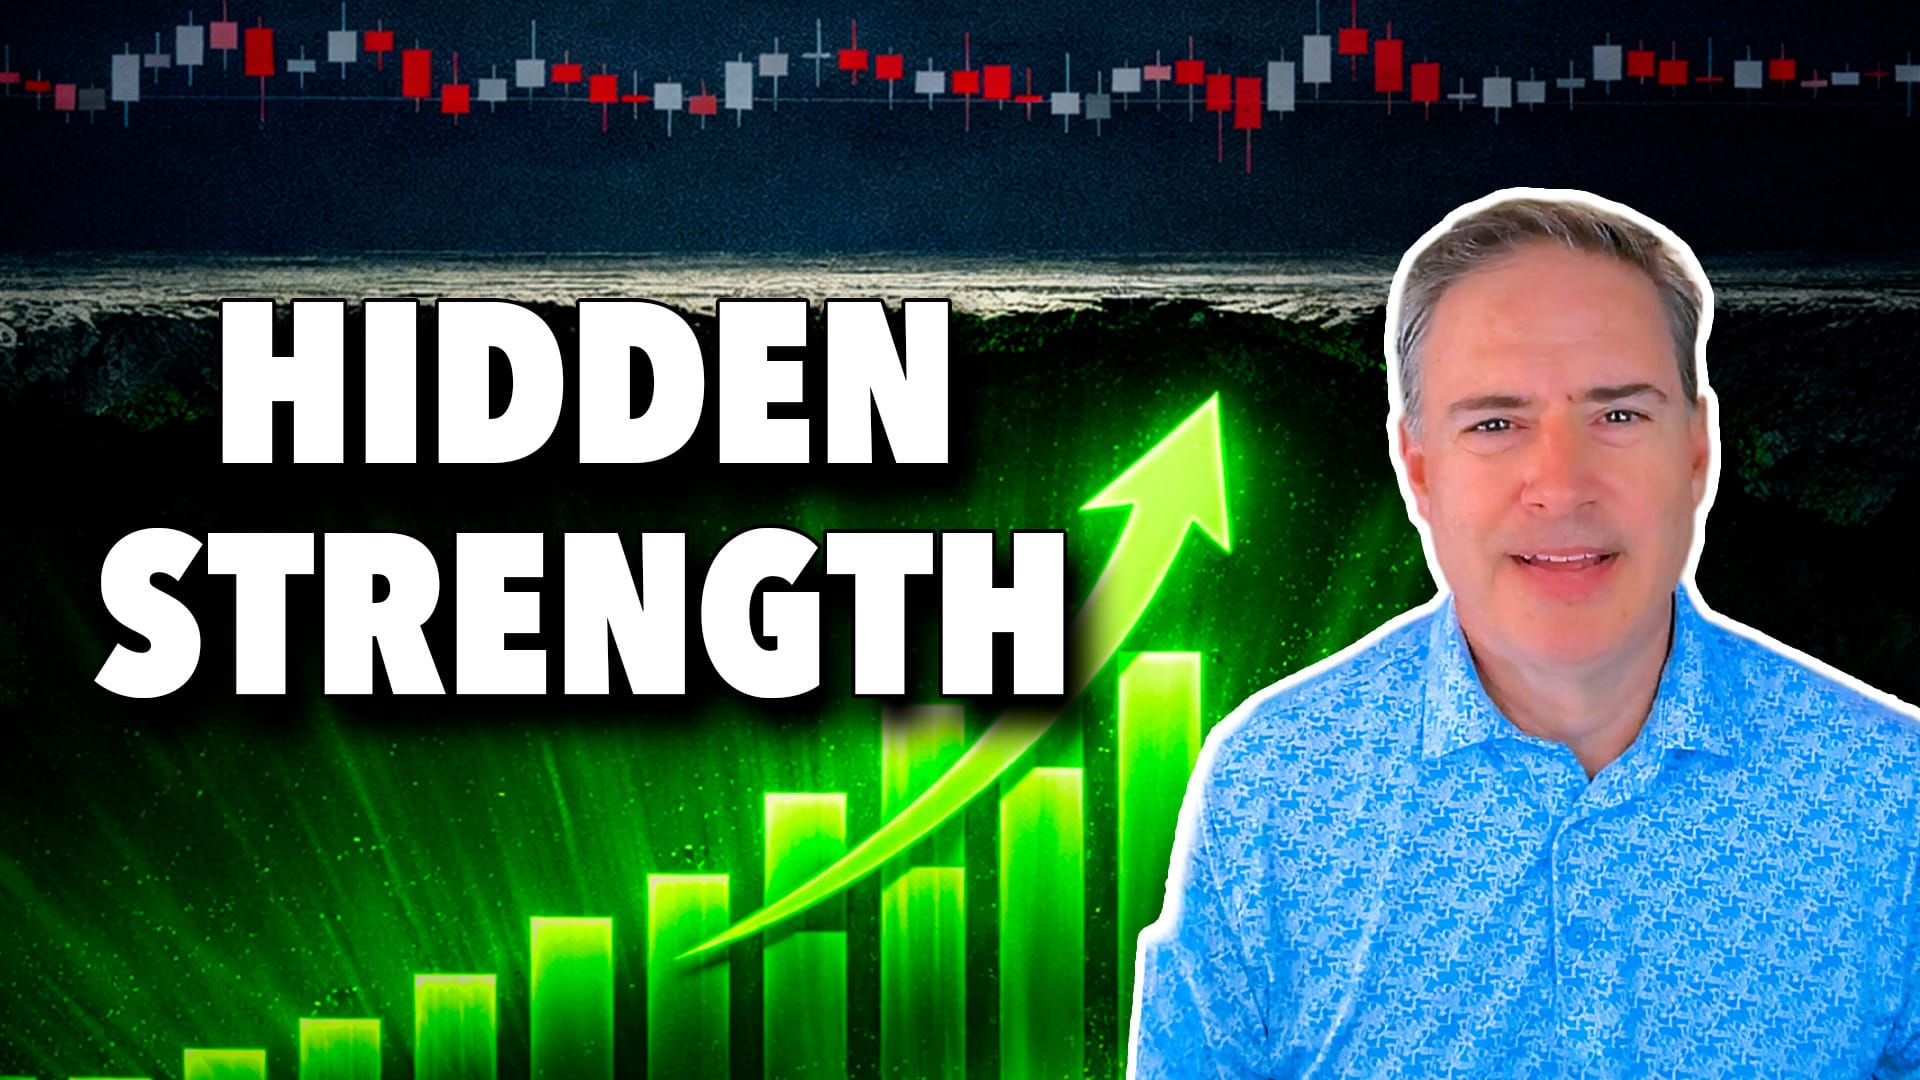
Sector Strength Is Building Even as the Market Stalls

by Joe Rabil,
President, Rabil Stock Research
Joe Rabil highlights improving sector strength and internal breadth, even as the broader market remains stuck in a range. He also reviews SPY conditions, volatility, sentiment, IWM relative strength, and select stock setups....
READ MORE
MEMBERS ONLY

Trillion-Dollar Walmart Hits New Highs Ahead of Earnings: What It Means for the Market
With Walmart's Q4 earnings on the horizon, Mike Zaccardi breaks down what makes WMT so critical this season and what's at stake for this year's leading sectors....
READ MORE
MEMBERS ONLY

StockCharts Insider: A Practical Guide to the Ichimoku Kijun-sen Pullback
by Karl Montevirgen,
The StockCharts Insider
Before We Dive In…
Ichimoku often gets dismissed for a number of reasons. Maybe it looks too complicated. Maybe it’s too slow. Not surprisingly, a lot of traders will fail with it when they go against its design and try to speed it up, "forcing" signals that...
READ MORE
MEMBERS ONLY
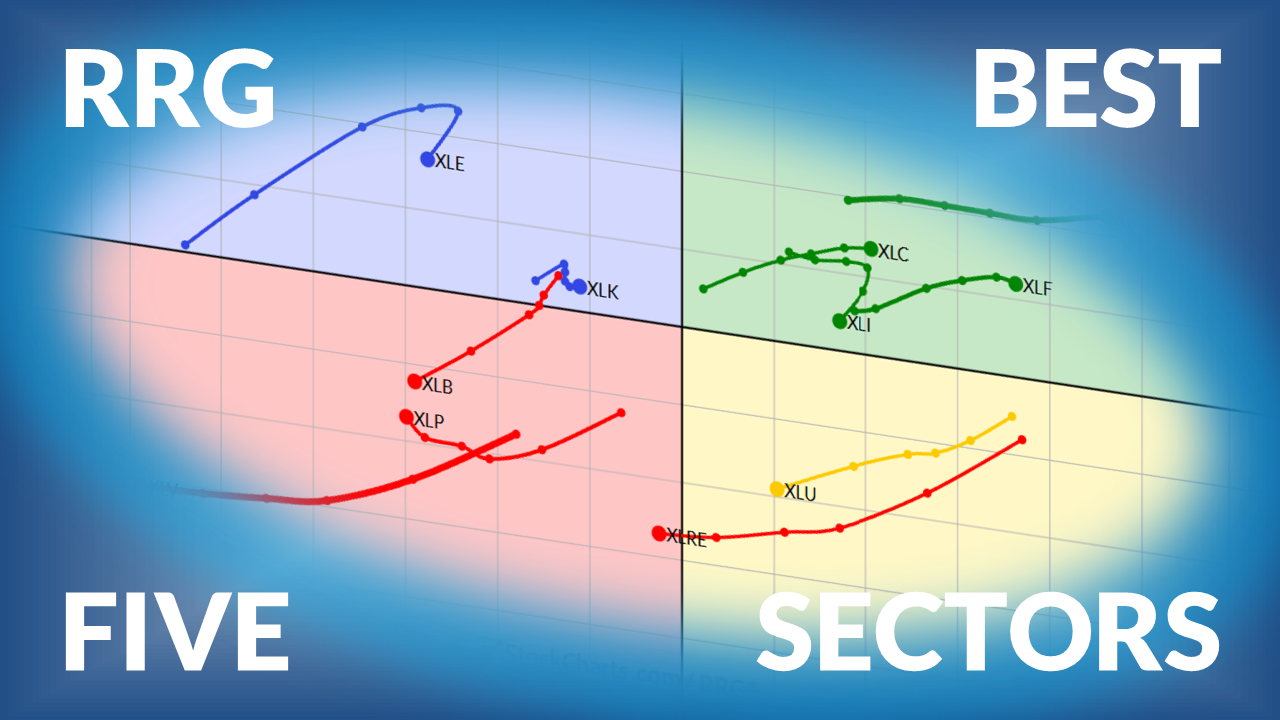
The Best Five Sectors This Week #53
by Julius de Kempenaer,
Senior Technical Analyst, StockCharts.com
Julius de Kempenaer presents his weekly update on sector rotation ranking using Relative Rotation Graphs....
READ MORE
MEMBERS ONLY

Week Ahead: Nifty Stares At A Major Medium-Term Support Zone; Avoid Aggressive Positioning
by Milan Vaishnav,
Founder and Technical Analyst, EquityResearch.asia and ChartWizard.ae
With India VIX rising sharply and the Nifty slipping below its 20-week moving average, what does this week hold for the Indian markets? Milan Vaishnav takes to the charts to analyze this question....
READ MORE
MEMBERS ONLY

AI Fears Introduce a New Wave of Market Volatility: Here’s How To Combat It

by Mary Ellen McGonagle,
President, MEM Investment Research
As the market experiences significant turbulence, Mary Ellen McGonagle talks ways to strategize beyond buy-and-hold. She also takes a look at EWJ in the wake of Japan's general election....
READ MORE
MEMBERS ONLY
Stock Market Pullback or Rotation? What This Week's Volatility Is Telling Us
by Jayanthi Gopalakrishnan,
Director of Site Content, StockCharts.com
This week may have felt a little déjà vu as, once again, the stock market gave investors a short-lived scare.
Thursday’s selloff had many investors wondering if something bigger was brewing, but afterwards, things seemed to stabilize. By Friday’s close, most major indexes managed to hold key support...
READ MORE
MEMBERS ONLY

Defensive Sectors Surge as Hindenburg Omen Flashes Warning
by David Keller,
President and Chief Strategist, Sierra Alpha Research
A confirmed Hindenburg Omen signal and renewed rotation into defensive sectors are raising caution flags for US equities. While the S&P 500 remains in a neutral range, Dave Keller, CMT, highlights key support levels and breadth signals investors should monitor closely....
READ MORE
MEMBERS ONLY

AI Fears Are Driving Rotation as Short Covering Is Fueling the Bounce!
by Mary Ellen McGonagle,
President, MEM Investment Research
Mary Ellen McGonagle breaks down how AI disruption fears are driving defensive rotation, along with how elevated short interest is fueling sharp short-covering bounces. She highlights what’s behind the volatility and what investors should watch for as positioning shifts intensify....
READ MORE
MEMBERS ONLY

This Sector Is Making Its First Relative Breakout in 8 Years
by Tom Bowley,
Chief Market Strategist, EarningsBeats.com
Industrials are starting to outperform the S&P 500; Tom Bowley analyzes the relative strength of the sector and the industry groups within....
READ MORE
MEMBERS ONLY

Large-Cap Dominoes are Falling; XLF Joins the Fray; Money Moves into Utes and Bonds
by Arthur Hill,
Chief Technical Strategist, TrendInvestorPro.com
The large-cap tech universe is struggling; Arthur Hill analyzes how the weakness is spreading into the broader market and other sectors. Meanwhile, investors are moving money into bonds and utilities....
READ MORE
MEMBERS ONLY

Stock Market Bounce or Breakdown? These Charts Hold the Clues
by Jayanthi Gopalakrishnan,
Director of Site Content, StockCharts.com
The stock market is stalling at critical levels. Discover what the S&P 500, Nasdaq, and mrket breadth signals mean for investors....
READ MORE
MEMBERS ONLY

Semiconductors vs. Software: The Battle Driving This Market
by Tom Bowley,
Chief Market Strategist, EarningsBeats.com
Though the market remains range-bound, a growing split inside technology could decide the next move. Follow along as Tom Bowley breaks down the semiconductor breakout attempt, software weakness, and the key levels shaping this battle....
READ MORE
MEMBERS ONLY

StockCharts Insider: Turning Sector Drill-Down into an Actionable Workflow
by Karl Montevirgen,
The StockCharts Insider
Before We Dive In…
The Sector Drill-Down is a popular and incredibly useful tool for observing relative sector rankings at a glance. But the data itself doesn’t give you a workflow, let alone a strategy. While many traders glance at the rankings and click a few charts, hoping something...
READ MORE
MEMBERS ONLY
These Breakout Setups Are Forming — Here’s What to Watch
by Joe Rabil,
President, Rabil Stock Research
Joe Rabil highlights breakout setups that are forming and explains what to watch for in a quality breakout entry. He also takes a look at SPY market conditions, volatility, sentiment, and Bitcoin’s technical outlook....
READ MORE
MEMBERS ONLY

The Best Five Sectors This Week #52
by Julius de Kempenaer,
Senior Technical Analyst, StockCharts.com
Julius de Kempenaer presents his weekly update on sector rotation using Relative Rotation Graphs....
READ MORE
MEMBERS ONLY
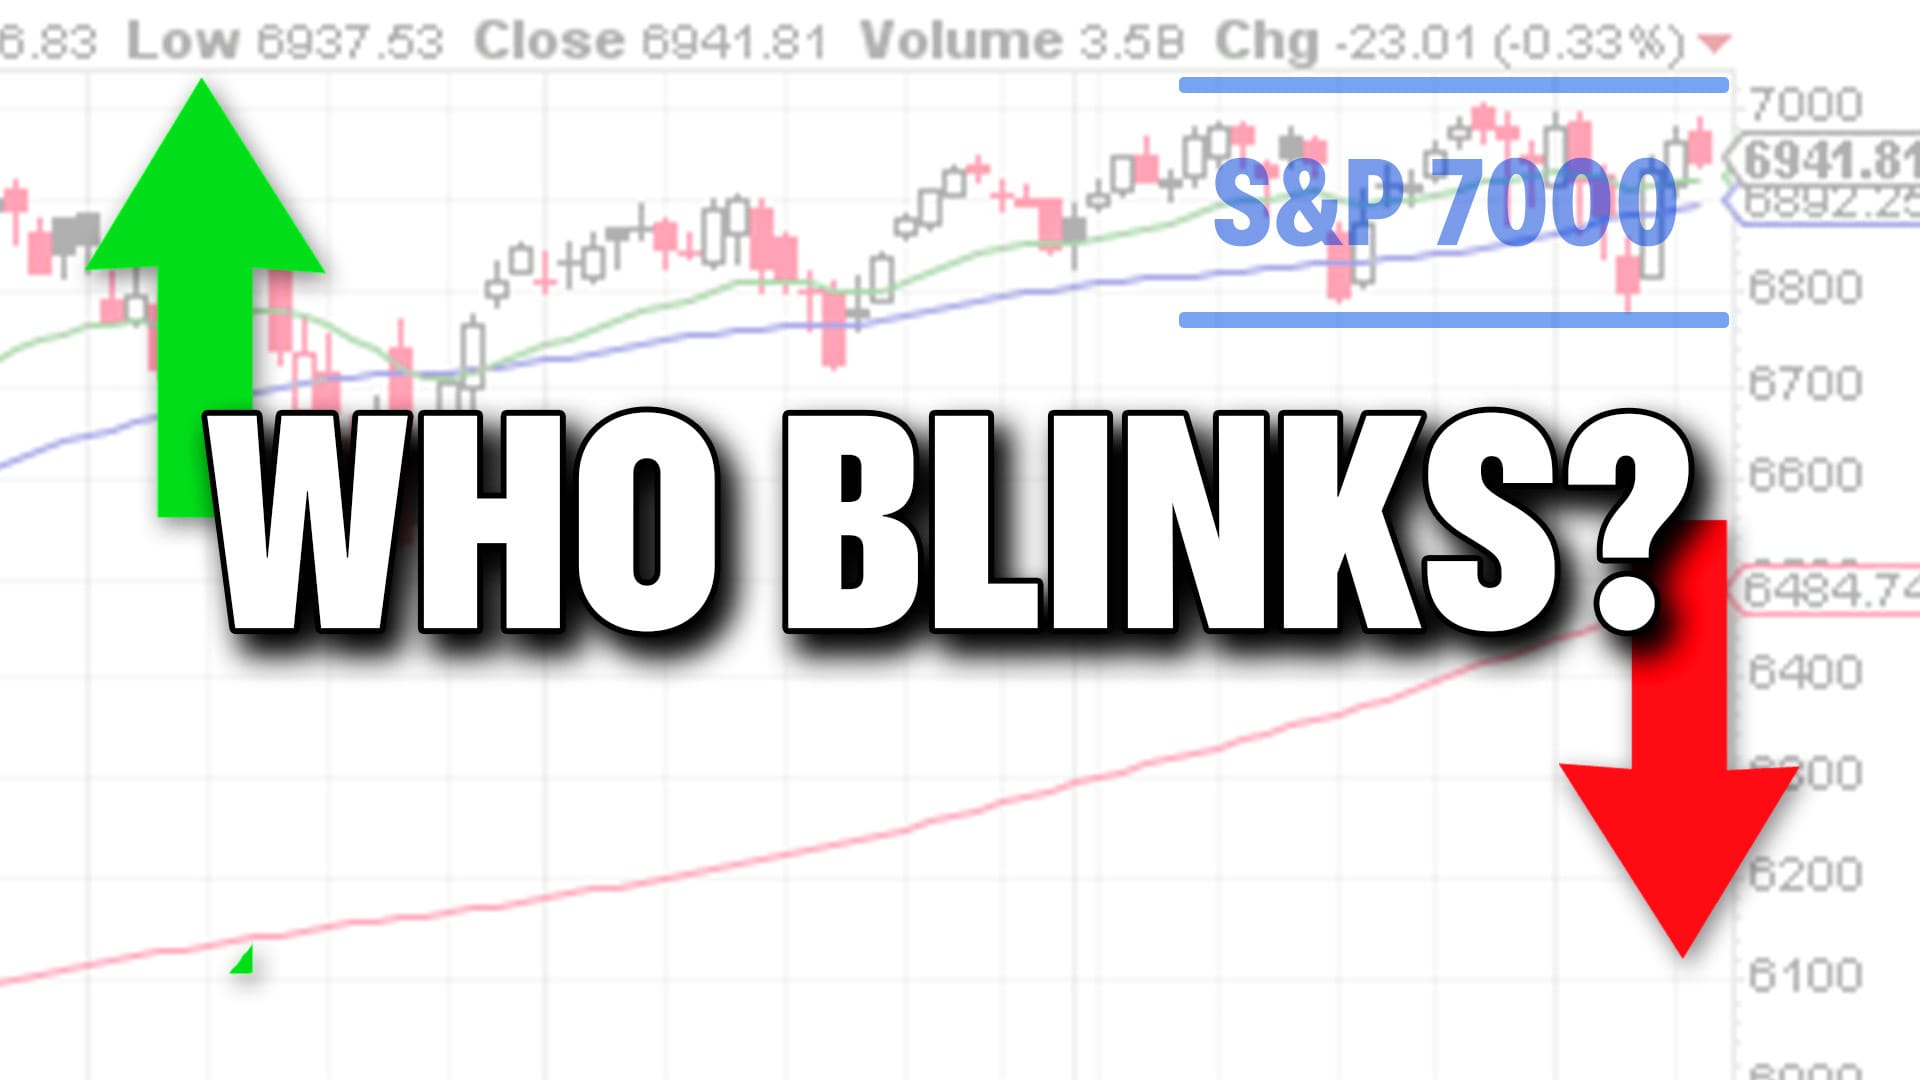
S&P 500 Can’t Clear 7000. Who Blinks First?

by Frank Cappelleri,
Founder & President, CappThesis, LLC
The S&P 500 keeps testing 7000, but follow-through has been elusive. Frank Cappelleri breaks down the breakout attempts, failed bearish signals, and internal strength that could determine who gives way first....
READ MORE
MEMBERS ONLY
How to Trade Trend Pullbacks with OptionsPlay
by Tony Zhang,
Chief Strategist, OptionsPlay
Tony Zhang shares his battle-tested trend following options strategy! Discover how the OptionsPlay Strategy Center automatically ranks call options, spreads, and credit trades to help you find the best risk-reward opportunities in minutes....
READ MORE
MEMBERS ONLY

Breaking Out: Cigna's Post-Earnings Recovery Just Getting Started
by Tony Zhang,
Chief Strategist, OptionsPlay
Cigna (CI) breaks out above $280 after a post-earnings selloff. In this article, Tony breaks down a compelling bullish options trade setup....
READ MORE
MEMBERS ONLY

StockCharts Insider: Ichimoku’s Forgotten Line - The Chikou Span (and How It Can Help You)
by Karl Montevirgen,
The StockCharts Insider
Before We Dive In…
The Chikou Span is arguably the most overlooked, most underestimated, and most underutilized part of the Ichimoku Cloud.
At first glance, it doesn’t look like much. It simply takes today’s closing price and plots it 26 periods back. If you’re focused on what’...
READ MORE
MEMBERS ONLY

This Sector Looks Ready to Break Out Big Time
by Martin Pring,
President, Pring Research
Martin takes a look at some important signs that suggest the Real Estate sector has reached the end of a corrective period and could be poised for a major breakout....
READ MORE
MEMBERS ONLY

Week Ahead: Nifty Near a Tactical Inflection Point
by Milan Vaishnav,
Founder and Technical Analyst, EquityResearch.asia and ChartWizard.ae
After a week of heightened volatility, the Nifty ended the week with gains and a positive broader trend. What will it take to reassert upside momentum -- or a correction?...
READ MORE
MEMBERS ONLY
Ignore the Headlines. Let the Charts Do the Talking.
by Jayanthi Gopalakrishnan,
Director of Site Content, StockCharts.com
This week’s market action is a reminder of why it’s important to tune out the noise and tune into the charts.
Three straight down days are enough to make any investor a little uneasy. Headlines clog up your inbox, opinions pile up, and it feels like something terrible...
READ MORE